Explore
 Validate
 Learn
Learn Western blot
 Immunohistochemistry
Antibody data
- Antibody Data
- Antigen structure
- References [1]
- Comments [0]
- Validations
- Western blot [1]
- Other assay [1]
Submit
Validation data
Reference
Comment
Report error
- Product number
- PA5-19509 - Provider product page

- Provider
- Invitrogen Antibodies
- Product name
- FASN Polyclonal Antibody
- Antibody type
- Polyclonal
- Antigen
- Synthetic peptide
- Description
- This antibody is predicted to react with chicken and cow based on sequence homology.
- Reactivity
- Human, Mouse, Rat
- Host
- Rabbit
- Isotype
- IgG
- Vial size
- 100 µg
- Concentration
- 0.9 mg/mL
- Storage
- Store at 4°C short term. For long term storage, store at -20°C, avoiding freeze/thaw cycles.
Submitted references Neonatal hyperoxia inhibits proliferation and survival of atrial cardiomyocytes by suppressing fatty acid synthesis.
Cohen ED, Yee M, Porter GA Jr, Ritzer E, McDavid AN, Brookes PS, Pryhuber GS, O'Reilly MA
JCI insight 2021 Mar 8;6(5)
JCI insight 2021 Mar 8;6(5)
No comments: Submit comment
Supportive validation
- Submitted by
- Invitrogen Antibodies (provider)
- Main image

- Experimental details
- Western blot analysis of Mouse Brain Tissue Lysate using Product # PA5-19509, Fatty Acid Synthase primary antibody at a dilution of 1 µg/mL. Blot treated with a secondary HRP-conjugated Goat polyclonal anti-Rabbit antibody was used at a dilution of 1:3000.

Supportive validation
- Submitted by
- Invitrogen Antibodies (provider)
- Main image
- Experimental details
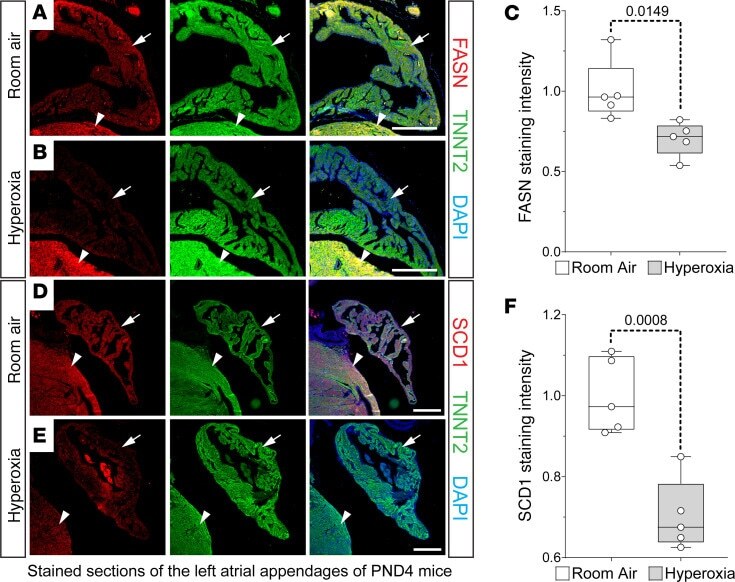
- Figure 5 Neonatal hyperoxia represses fatty acid synthesis enzymes in murine atrial cardiomyocytes. ( A , B , D , and E ). Sections of left atrial appendages from P4 neonates exposed to room air ( A and B ) or hyperoxia ( D and E ) costained for FASN (red, A and B ) or SCD1 (red, D and E ) and TNNT2 (green, A , B , D , and E ). Sections were also stained with DAPI to label nuclei (blue, A , B , D , and E ). Arrows and arrowheads show TNNT2 + cardiomyocytes in left atrial appendage and LV, respectively. Scale bars: 200 mum. ( C and F ) Graphs show relative staining intensities for Fasn ( C ) and Scd1 ( F ) measured using NIH ImageJ 2.0/Fiji. ( C and F ) Room air, n = 5; hyperoxia, n = 5. Box plots show median values and inner quartiles. Whiskers show the range of values. Circles show values for individual room air- and hyperoxia-exposed mice, respectively. F tests were used to determine if samples had equal or unequal variances. P values are the results of unpaired 2-tailed t tests.