Explore
 Validate
 Learn
LearnMA5-15064
antibody from Invitrogen Antibodies
Targeting: SPI1
OF, PU.1, SFPI1, SPI-1, SPI-A
 Western blot Immunocytochemistry
 Immunoprecipitation Immunohistochemistry Flow cytometry Chromatin Immunoprecipitation Other assay
Antibody data
- Antibody Data
- Antigen structure
- References [3]
- Comments [0]
- Validations
- Western blot [1]
- Immunocytochemistry [1]
- Immunohistochemistry [1]
- Chromatin Immunoprecipitation [1]
- Other assay [5]
Submit
Validation data
Reference
Comment
Report error
- Product number
- MA5-15064 - Provider product page

- Provider
- Invitrogen Antibodies
- Product name
- PU.1 Monoclonal Antibody (E.388.3)
- Antibody type
- Monoclonal
- Antigen
- Synthetic peptide
- Description
- It is not recommended to aliquot this antibody.
- Reactivity
- Human, Mouse
- Host
- Rabbit
- Isotype
- IgG
- Antibody clone number
- E.388.3
- Vial size
- 100 µL
- Concentration
- 150 µg/mL
- Storage
- -20°C
Submitted references KDM6A Lysine Demethylase Directs Epigenetic Polarity of MDSCs during Murine Sepsis.
Inhibiting KDM6A Demethylase Represses Long Non-Coding RNA Hotairm1 Transcription in MDSC During Sepsis.
TH9 cells that express the transcription factor PU.1 drive T cell-mediated colitis via IL-9 receptor signaling in intestinal epithelial cells.
Bah I, Alkhateeb T, Youssef D, Yao ZQ, McCall CE, El Gazzar M
Journal of innate immunity 2022;14(2):112-123
Journal of innate immunity 2022;14(2):112-123
Inhibiting KDM6A Demethylase Represses Long Non-Coding RNA Hotairm1 Transcription in MDSC During Sepsis.
Bah I, Youssef D, Yao ZQ, McCall CE, El Gazzar M
Frontiers in immunology 2022;13:823660
Frontiers in immunology 2022;13:823660
TH9 cells that express the transcription factor PU.1 drive T cell-mediated colitis via IL-9 receptor signaling in intestinal epithelial cells.
Gerlach K, Hwang Y, Nikolaev A, Atreya R, Dornhoff H, Steiner S, Lehr HA, Wirtz S, Vieth M, Waisman A, Rosenbauer F, McKenzie AN, Weigmann B, Neurath MF
Nature immunology 2014 Jul;15(7):676-86
Nature immunology 2014 Jul;15(7):676-86
No comments: Submit comment
Supportive validation
- Submitted by
- Invitrogen Antibodies (provider)
- Main image
- Experimental details
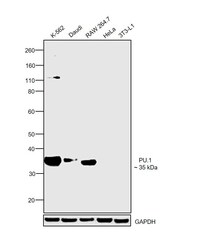
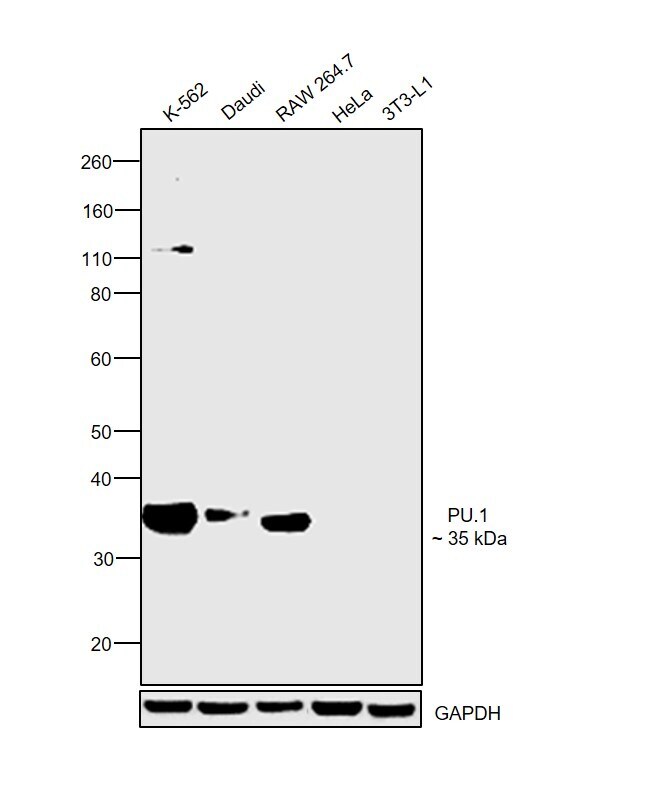
- Western blot was performed using Anti-PU.1 Monoclonal Antibody (E.388.3) (Product # MA5-15064) and a 35 kDa band corresponding to PU.1 was observed across cell lines tested except HeLa and 3T3-L1 which are reported to be negative. Modified whole cell extracts (1% SDS) (30 µg lysate) of K-562 (Lane 1), Daudi (Lane 2), RAW 264.7 (Lane 3), HeLa (Lane 4) and 3T3-L1 (Lane 5) were electrophoresed using NuPAGE™ 4-12% Bis-Tris Protein Gel (Product # NP0322BOX). Resolved proteins were then transferred onto a nitrocellulose membrane (Product # IB23001) by iBlot® 2 Dry Blotting System (Product # IB21001). The blot was probed with the primary antibody (1:1000 dilution) and detected by chemiluminescence with Goat anti-Mouse IgG (H+L) Superclonal™ Recombinant Secondary Antibody, HRP (Product # A28177, 1:4000 dilution) using the iBright FL 1000 (Product # A32752). Chemiluminescent detection was performed using SuperSignal™ West Dura Extended Duration Substrate (Product # 34076).
Supportive validation
- Submitted by
- Invitrogen Antibodies (provider)
- Main image
- Experimental details
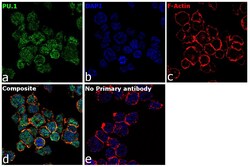
- Immunofluorescence analysis of PU.1 was performed using 70% confluent log phase THP-1 cells. The cells were fixed with 4% paraformaldehyde for 10 minutes, permeabilized with 0.1% Triton™ X-100 for 15 minutes, and blocked with 2% BSA for 1 hour at room temperature. The cells were labeled with PU.1 Rabbit Monoclonal Antibody (E.388.3) (Product # MA5-15064) at 1:150 dilution in 0.1% BSA, incubated at 4 degree Celsius overnight and then labeled with Goat anti-Rabbit IgG (H+L), Superclonal™ Recombinant Secondary Antibody, Alexa Fluor 488 (Product # A27034) at a dilution of 1:2000 for 45 minutes at room temperature (Panel a: green). Nuclei (Panel b: blue) were stained with ProLong™ Diamond Antifade Mountant with DAPI (Product # P36962). F-actin (Panel c: red) was stained with Rhodamine Phalloidin (Product # R415). Panel d represents the merged image showing Nuclear localization. Panel e represents control cells with no primary antibody to assess background. The images were captured at 60X magnification.

Supportive validation
- Submitted by
- Invitrogen Antibodies (provider)
- Main image
- Experimental details
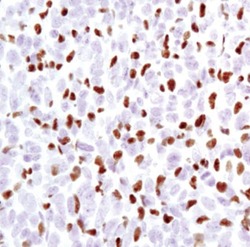
- Immunohistochemical analysis of PU.1 in paraffin-embedded 4T1 syngeneic mouse tumor using a PU.1 monoclonal antibody (Product # MA5-15064).

Supportive validation
- Submitted by
- Invitrogen Antibodies (provider)
- Main image
- Experimental details
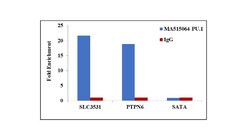
- Chromatin Immunoprecipitation (ChIP) assay of endogenous PU.1 protein using Anti-PU.1 Antibody: ChIP was performed using Anti-PU.1 Rabbit Monoclonal Antibody (Product # MA5-15064, 5 µg) on sheared chromatin from THP1 cells using the MAGnify ChIP System kit (Product # 49-2024). Normal Rabbit IgG was used as a negative IP control. The purified DNA was analyzed by qPCR using primers binding to SLC35C1 and PTPN6 promoter and SATA satellite repeats. Data is presented as fold enrichment of the antibody signal versus the negative control IgG using the comparative CT method.

Supportive validation
- Submitted by
- Invitrogen Antibodies (provider)
- Main image
- Experimental details
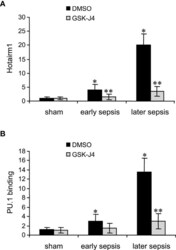
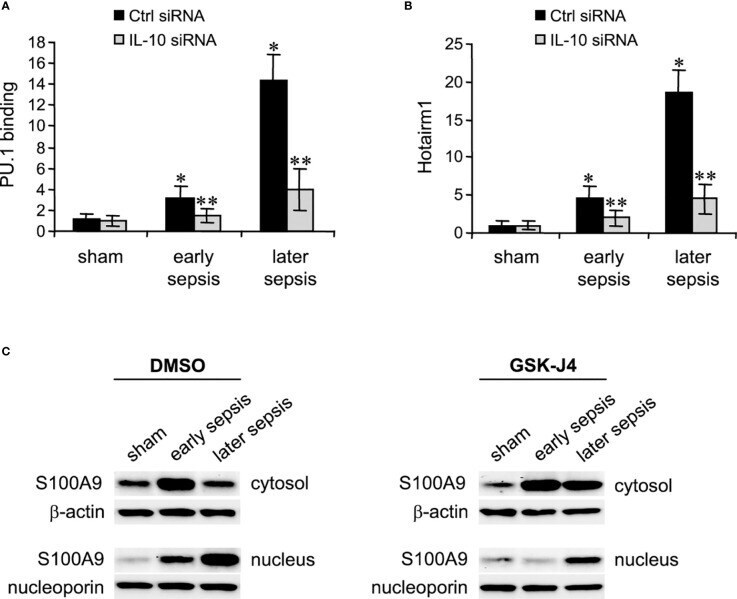
- Figure 3 Inhibition of KDM6A in MDSCs reduces Hotairm1 transcription. Gr1 + CD11b + cells were purified from bone marrow cells by negative selection using magnetic beads and anti-Gr1 and anti-CD11b antibodies. The cells were incubated with 4 muM of GSK-J4 or 0.1% DMSO for 12 h. (A) Total RNA was isolated and Hotairm1 levels were determined by real-time RT-qPCR using qPCR Primer Assay specific to Hotairm1. Sample values were normalized to GAPDH RNA as an internal control and are presented relative to sham (1-fold). (B) KDM6A inhibition reduces PU.1 binding at the Hotairm1 promoter. Chromatin was isolated as described in (A) and immunoprecipitated with anti-PU.1 or anti-IgG control antibody. The ChIPed DNA was analyzed by qPCR as described in (A) . Data represent mean +- SD for 5-6 mice per group, pooled from independent experiments. Data in (A) are presented relative to sham and data in (B) are presented relative to the IgG-immunoprecipitated samples (1-fold). * p < 0.05, early or later sepsis vs. sham; ** p < 0.05, GSK-J4 vs. DMSO.

- Submitted by
- Invitrogen Antibodies (provider)
- Main image
- Experimental details
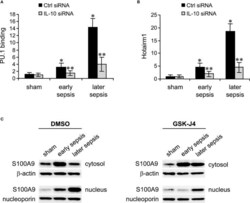
- Figure 5 PU.1 binding and Hotairm1 transcripts in MDSCs after IL-10 Knockdown. Gr1 + CD11b + cells were purified from bone marrow cells and transfected with IL-10-specific or scrambled/control siRNA for 36 h. (A) PU.1 binding at Hotairm1 promoter. Chromatin was immunoprecipitated with anti-PU.1 or anti-IgG isotype control antibody. The ChIPed DNA was analyzed by qPCR. Samples values were normalized to the ""input"" DNA and are presented relative to the IgG-immunoprecipitated samples (1-fold). (B) Total RNA was isolated and Hotairm1 levels were determined by real-time RT-qPCR using qPCR Primer Assay specific to Hotairm1. Sample values were normalized to GAPDH RNA as an internal control and are presented relative to sham (1-fold). Data represent mean +- SD for 4-6 mice per group, pooled from independent experiments. * p < 0.05, early or later sepsis vs. sham; ** p < 0.05, IL-10 siRNA vs. Ctrl siRNA. (C) Inhibition of KDM6A moves S100A9 protein from the nucleus to the cytosol. Western blot analysis of S100A9 protein localization. The cells were incubated with 4 muM of GSK-J4 or 0.1% DMSO for 12 h. Protein extracts were used to determine S100A9 levels in the cytosol and nucleus. The results are representative of two Western blots.
- Submitted by
- Invitrogen Antibodies (provider)
- Main image
- Experimental details
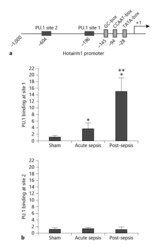
- Fig. 1. PU.1 binds at the Hotairm1 promoter. a A schematic diagram depicting the proximal promoter region of mouse Hotairm1. The PU.1 binding sites and consensus promoter motifs are shown. b ChIP assay for PU.1 binding. Bone marrow cells were harvested from septic mice that were moribund and sacrificed at days 1-5 (representing acute sepsis) and at days 7-28 (representing post-acute sepsis), as well as sham mice. Gr1 + CD11b + cells were then purified by negative selection using magnetic beads and anti-Gr1 and anti-CD11b antibodies. The cells were fixed in formaldehyde to cross-link protein-DNA and lysed, and the pelleted nuclei were digested with a chromatin shearing enzymatic cocktail. The sheared chromatin was immunoprecipitated with anti-PU.1 or anti-IgG isotype control antibody. Next, chromatin cross-links were reversed to recover the protein-bound DNA. To measure the amount of PU.1 binding at the promoter, the ChIPed DNA was analyzed by real-time qPCR using primers that amplify the promoter sequences surrounding the PU.1 binding sites 1 and 2 (see Fig. 1a). Sample values were normalized to the ""input"" DNA (DNA isolated before the immunoprecipitation) and are presented as fold change relative to the IgG-immunoprecipitated samples (1-fold). Data are means +- SD for 5-7 mice per group, from 3 experiments. * p < 0.05 versus sham; ** p < 0.05 versus acute sepsis. ChIP, chromatin immunoprecipitation.

- Submitted by
- Invitrogen Antibodies (provider)
- Main image
- Experimental details
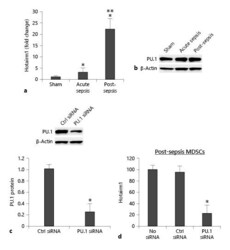
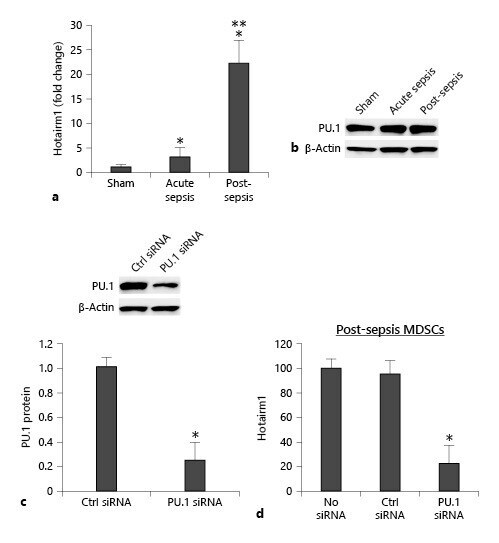
- Fig. 2. Knockdown of PU.1 reduces Hotairm1 expression. Gr1 + CD11b + cells were purified from bone marrow cells by negative selection using magnetic beads and anti-Gr1 and anti-CD11b antibodies. a Total RNA was isolated using TRIzol reagent, and Hotairm1 levels were determined by real-time RT-qPCR using QuantiTect qPCR Primer Assay specific to Hotairm1. Sample values were normalized to GAPDH RNA as an internal control. Data are means +- SD for 5-6 mice per group, from 3 experiments, and are presented relative to sham (1-fold). b Western blot of PU.1 protein in Gr1 + CD11b + cells. The results are representative of 2 blots from 2 experiments. c Knockdown of PU.1 in Gr1 + CD11b + cells. The cells were transfected with PU.1-specific or scrambled/control siRNA for 48 h. PU.1 protein levels were determined by Western blotting. Representative blots and densitometric analysis (lower panel) of 3 blots from 2 experiments are shown. Values were normalized to beta-actin and are presented relative to control siRNA. * p < 0.05. d Hotairm1 RNA levels were determined by real-time RT-qPCR as in a . Data are means +- SD for 6 mice per group, from 3 experiments, and are presented relative to nontransfected cells. * p < 0.05 versus no siRNA or control (Ctrl) siRNA. MDSCs, myeloid-derived suppressor cells.
- Submitted by
- Invitrogen Antibodies (provider)
- Main image

- Experimental details
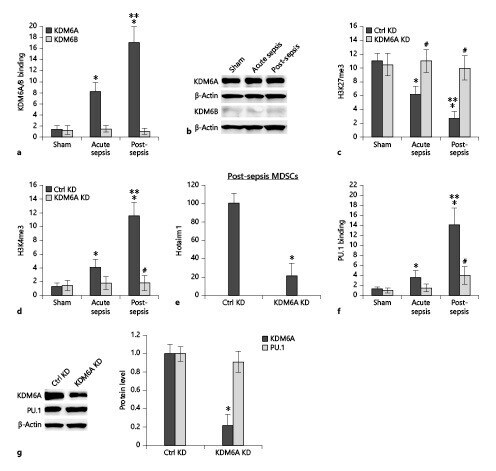
- Fig. 6. KDM6A binds at the Hotairm1 proximal promoter, and its knockdown reduces H3K4me3 and Hotairm1 expression. Gr1 + CD11b + cells were purified from bone marrow cells by negative selection using magnetic beads and anti-Gr1 and anti-CD11b antibodies. Chromatin was prepared as described in Figure 1. a The chromatin was immunoprecipitated with an antibody specific to KDM6A, KDM6B, or IgG isotype control antibody. The ChIPed DNA was analyzed by real-time qPCR using primers that amplify the promoter sequences surrounding PU.1 binding site 1. b Western blot analysis of KDM6A and KDM6B proteins in Gr1 + CD11b + cells. The results are representative of 2 blots from 2 experiments. c , d KD of KDM6A increases H3K27me3 and decreases H3K4me3. The Gr1 + CD11b + cells were transfected with KDM6A-specific or scrambled/control siRNA for 48 h. Chromatin was prepared and immunoprecipitated with antibody specific to H3K27me3 or H3K4me3, and the ChIPed DNA was analyzed by real-time PCR as in a . e Knockdown of KDM6A decreases Hotairm1 expression. Gr1 + CD11b + cells were purified from bone marrow cells from post-acute septic mice and transfected with KDM6A specific or scrambled/control siRNA for 48 h. The cells were harvested, and levels of Hotairm1 were determined by real-time RT-qPCR using QuantiTect Primer Assay specific to Hotairm1. Sample values were normalized to GAPDH RNA as an internal control. Data are means +- SD for 5-6 mice per group, from 3 experiments, and are presented relativ