Explore
 Validate
 Learn
Learn Western blot
Antibody data
- Antibody Data
- Antigen structure
- References [5]
- Comments [0]
- Validations
- Western blot [1]
- Immunocytochemistry [1]
- Immunohistochemistry [1]
- Flow cytometry [1]
Submit
Validation data
Reference
Comment
Report error
- Product number
- MA5-12287 - Provider product page

- Provider
- Invitrogen Antibodies
- Product name
- CD99 Monoclonal Antibody (O13)
- Antibody type
- Monoclonal
- Antigen
- Other
- Description
- MA5-12287 targets CD99 in IHC (P) applications and shows reactivity with Human samples.
- Antibody clone number
- O13
- Concentration
- 0.2 mg/mL
Submitted references Clofarabine induces ERK/MSK/CREB activation through inhibiting CD99 on Ewing sarcoma cells.
Histopathological, immunophenotypic and clinical particularities and evolution of a case of hepatosplenic T-cell lymphoma in transformation to leukemia.
MiR-30a-5p connects EWS-FLI1 and CD99, two major therapeutic targets in Ewing tumor.
Inducible expression of chimeric EWS/ETS proteins confers Ewing's family tumor-like phenotypes to human mesenchymal progenitor cells.
Kit expression in spindle cell rhabdomyosarcoma can possibly create a different approach for its tumorigenesis and therapy.
Sevim H, Çelik H, Düşünceli L, Ceyhan CS, Molotkova A, Nakazawa K, Graham GT, Petro JR, Toretsky JA, Üren A
PloS one 2021;16(6):e0253170
PloS one 2021;16(6):e0253170
Histopathological, immunophenotypic and clinical particularities and evolution of a case of hepatosplenic T-cell lymphoma in transformation to leukemia.
Benedek Lázár E, Köpeczi JB, Tunyogi AB, Kakucs E, Horváth E, Turcu M, Benedek I
Romanian journal of morphology and embryology = Revue roumaine de morphologie et embryologie 2013;54(4):1135-9
Romanian journal of morphology and embryology = Revue roumaine de morphologie et embryologie 2013;54(4):1135-9
MiR-30a-5p connects EWS-FLI1 and CD99, two major therapeutic targets in Ewing tumor.
Franzetti GA, Laud-Duval K, Bellanger D, Stern MH, Sastre-Garau X, Delattre O
Oncogene 2013 Aug 15;32(33):3915-21
Oncogene 2013 Aug 15;32(33):3915-21
Inducible expression of chimeric EWS/ETS proteins confers Ewing's family tumor-like phenotypes to human mesenchymal progenitor cells.
Miyagawa Y, Okita H, Nakaijima H, Horiuchi Y, Sato B, Taguchi T, Toyoda M, Katagiri YU, Fujimoto J, Hata J, Umezawa A, Kiyokawa N
Molecular and cellular biology 2008 Apr;28(7):2125-37
Molecular and cellular biology 2008 Apr;28(7):2125-37
Kit expression in spindle cell rhabdomyosarcoma can possibly create a different approach for its tumorigenesis and therapy.
Diniz G, Aktas S, Ortac R, Tunakan M, Unlu I, Vergin C
Pathology, research and practice 2006;202(9):671-7
Pathology, research and practice 2006;202(9):671-7
No comments: Submit comment
Supportive validation
- Submitted by
- Invitrogen Antibodies (provider)
- Main image

- Experimental details
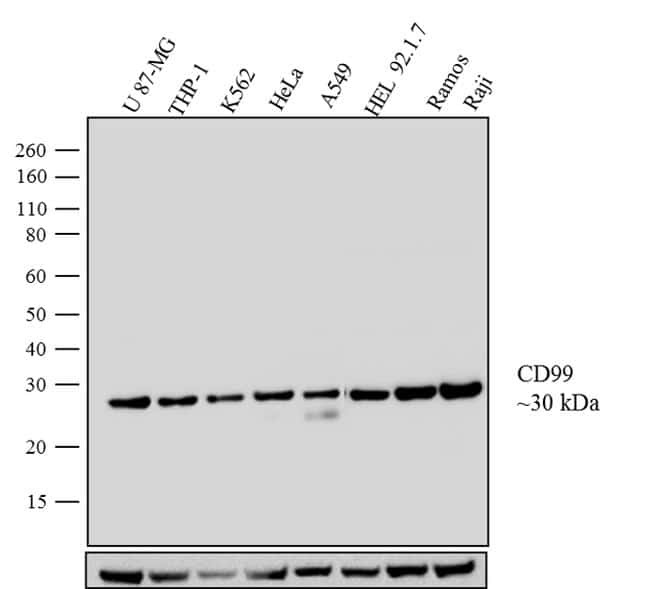
- Western blot analysis of CD99 was performed using membrane enriched extracts (30 µg lysate) of U 87-MG (Lane 1), THP-1 (Lane 2), K562 (Lane 3), HeLa (Lane 4), A549 (Lane 5), HEL 92.1.7 (Lane 6), Ramos (Lane 7), and Raji (Lane 8). The blots were probed with Anti-CD99 Mouse Monoclonal Antibody (Product # MA5-12287, 2 µg/mL) and detected by chemiluminescence using Goat anti-Mouse IgG (H+L) Superclonal™ Secondary Antibody, HRP conjugate (Product # A28177, 0.4 µg/mL, 1:2500 dilution). A 30 kDa band corresponding to CD99 was observed across the cell lines tested. Known quantity of protein samples were electrophoresed using Novex® NuPAGE® 10 % Bis-Tris gel (Product # NP0302BOX), XCell SureLock™ Electrophoresis System (Product # EI0002) and Novex® Sharp Pre-Stained Protein Standard (Product # LC5800). Resolved proteins were then transferred onto a nitrocellulose membrane with iBlot® 2 Dry Blotting System (Product # IB21001). The membrane was probed with the relevant primary and secondary Antibody following blocking with 5 % skimmed milk. Chemiluminescent detection was performed using Pierce™ ECL Western Blotting Substrate (Product # 32106).
Supportive validation
- Submitted by
- Invitrogen Antibodies (provider)
- Main image
- Experimental details
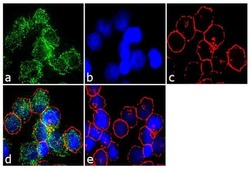
- Immunofluorescence analysis of CD99 was performed using 90% confluent log phase MOLT-4 cells. The cells were fixed with 4% paraformaldehyde for 10 minutes, permeabilized with 0.1% Triton™ X-100 for 10 minutes, and blocked with 1% BSA for 1 hour at room temperature. The cells were labeled with CD99/MIC2 (O13) Mouse Monoclonal Antibody (Product # MA5-12287) at 2 µg/mL in 0.1% BSA and incubated for 3 hours at room temperature and then labeled with Goat anti-Mouse IgG (H+L) Superclonal™ Secondary Antibody, Alexa Fluor® 488 conjugate (Product # A28175) a dilution of 1:2000 for 45 minutes at room temperature (Panel a: green). Nuclei (Panel b: blue) were stained with SlowFade® Gold Antifade Mountant with DAPI (Product # S36938). F-actin (Panel c: red) was stained with Alexa Fluor® 555 Rhodamine Phalloidin (Product # R415, 1:300). Panel d represents the merged image showing localization in the membrane. Panel e shows the no primary antibody control. The images were captured at 60X magnification.

Supportive validation
- Submitted by
- Invitrogen Antibodies (provider)
- Main image

- Experimental details
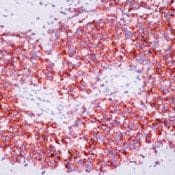
- Formalin-fixed, paraffin-embedded human Ewings sarcoma stained with CD99 antibody using peroxidase-conjugate and AEC chromogen. Note membrane staining of tumor cells.
Supportive validation
- Submitted by
- Invitrogen Antibodies (provider)
- Main image
- Experimental details
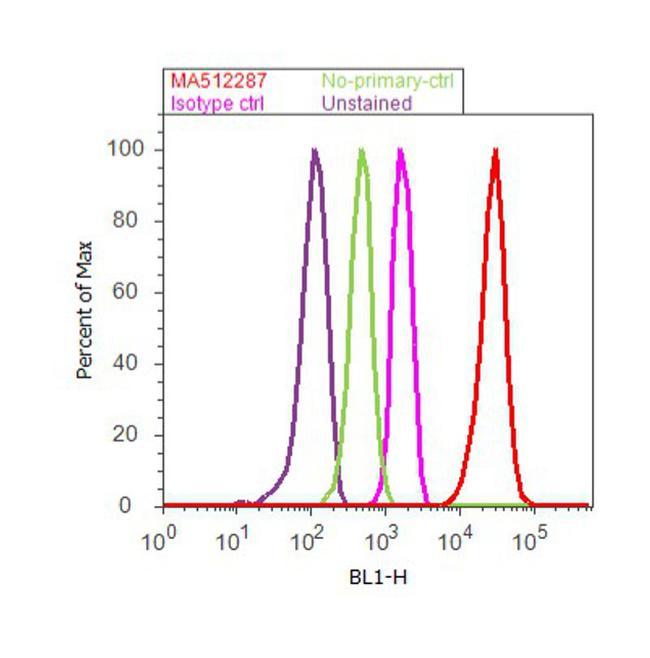
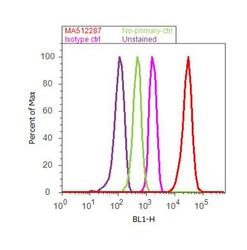
- Flow cytometry analysis of CD99 was performed using Jurkat cells. Cells were fixed with 70% ethanol for 10 minutes, permeabilized with 0.25% Triton™ X-100 for 20 minutes, and blocked with 5% BSA for 30 minutes at room temperature. Cells were labeled with CD99 Mouse Monoclonal Antibody (MA5-12287, red histogram) or with mouse isotype control (pink histogram) at 3-5 ug/million cells in 2.5% BSA. After incubation at room temperature for 2 hours, the cells were labeled with Alexa Fluor® 488 Rabbit Anti-Mouse Secondary Antibody (A11059) at a dilution of 1:400 for 30 minutes at room temperature. The representative 10,000 cells were acquired and analyzed for each sample using an Attune® Acoustic Focusing Cytometer. The purple histogram represents unstained control cells and the green histogram represents no-primary-antibody control..