 Explore
 Validate
 Learn
Learn Flow cytometry
Antibody data
- Antibody Data
- Antigen structure
- References [46]
- Comments [0]
- Validations
- Flow cytometry [1]
- Other assay [60]
Submit
Validation data
Reference
Comment
Report error
- Product number
- 69-7319-42 - Provider product page

- Provider
- Invitrogen Antibodies
- Product name
- IFN gamma Monoclonal Antibody (4S.B3), eFluor™ 506, eBioscience™
- Antibody type
- Monoclonal
- Antigen
- Other
- Description
- Description: The 4S.B3 monoclonal antibody reacts with interferon-gamma (IFN gamma). Human IFN gamma is a 17 kDa factor produced by activated T and NK cells and is an anti-viral and anti-parasitic cytokine. IFN gamma in synergy with other cytokines, such as TNF alpha, inhibits proliferation of normal and transformed cells. Immunomodulatory effects of IFN gamma are exerted on a wide range of cell types expressing the high affinity receptors for IFN gamma. Glycosylation of IFN gamma does not affect its biological activity. Applications Reported: This 4S.B3 antibody has been reported for use in intracellular staining followed by flow cytometric analysis. Applications Tested: This 4S.B3 antibody has been pre-titrated and tested by intracellular staining and flow cytometric analysis of stimulated normal human peripheral blood cells using the Intracellular Fixation & Permeabilization Buffer Set (Product # 88-8824-00) and protocol. Please refer to Best Protocols: Protocol A: Two step protocol for (cytoplasmic) intracellular proteins located under the Resources Tab online. This can be used at 5 µL (0.06 µg) per test. A test is defined as the amount (µg) of antibody that will stain a cell sample in a final volume of 100 µL. Cell number should be determined empirically but can range from 10^5 to 10^8 cells/test. eFluor® 506 can be excited with the violet laser line (405 nm) and emits at 506 nm. We recommend using a 510/20 band pass filter, or equivalent. Please make sure that your instrument is capable of detecting this fluorochrome. Excitation: 405 nm; Emission: 506 nm; Laser: Violet Laser. Filtration: 0.2 µm post-manufacturing filtered.
- Reactivity
- Human
- Host
- Mouse
- Isotype
- IgG
- Antibody clone number
- 4S.B3
- Vial size
- 100 Tests
- Concentration
- 5 µL/Test
- Storage
- 4° C, store in dark, DO NOT FREEZE!
Submitted references An Fc-Competent Anti-Human TIGIT Blocking Antibody Ociperlimab (BGB-A1217) Elicits Strong Immune Responses and Potent Anti-Tumor Efficacy in Pre-Clinical Models.
LINC01123 promotes immune escape by sponging miR-214-3p to regulate B7-H3 in head and neck squamous-cell carcinoma.
Identification of CTL Epitopes on Efflux Pumps of the ATP-Binding Cassette and the Major Facilitator Superfamily of Mycobacterium tuberculosis.
Early loss of T lymphocyte 4-1BB receptor expression is associated with higher short-term mortality in alcoholic hepatitis.
TIGIT(+) TIM-3(+) NK cells are correlated with NK cell exhaustion and disease progression in patients with hepatitis B virus‑related hepatocellular carcinoma.
Multipeptide stimulated PBMCs generate T(EM)/T(CM) for adoptive cell therapy in multiple myeloma.
Suppression of 4.1R enhances the potency of NKG2D-CAR T cells against pancreatic carcinoma via activating ERK signaling pathway.
Niraparib exhibits a synergistic anti-tumor effect with PD-L1 blockade by inducing an immune response in ovarian cancer.
Identification of HLA-A2-Restricted Mutant Epitopes from Neoantigens of Esophageal Squamous Cell Carcinoma.
YY1 regulation by miR-124-3p promotes Th17 cell pathogenicity through interaction with T-bet in rheumatoid arthritis.
Ageing promotes early T follicular helper cell differentiation by modulating expression of RBPJ.
Suppression of mucosal Th17 memory responses by acellular pertussis vaccines enhances nasal Bordetella pertussis carriage.
Lasting antibody and T cell responses to SARS-CoV-2 in COVID-19 patients three months after infection.
A protocol for isolation of primary human immune cells from the liver and mesenteric white adipose tissue biopsies.
A vaccine targeting mutant IDH1 in newly diagnosed glioma.
Cancer-secreted exosomal miR-1468-5p promotes tumor immune escape via the immunosuppressive reprogramming of lymphatic vessels.
A Method of Assessment of Human Natural Killer Cell Phenotype and Function in Whole Blood.
Th2 Biased Immunity With Altered B Cell Profiles in Circulation of Patients With Sporotrichosis Caused by Sporothrix globosa.
Inhibition of Cholesterol Esterification Enzyme Enhances the Potency of Human Chimeric Antigen Receptor T Cells against Pancreatic Carcinoma.
Duration of Cellular and Humoral Responses after Quadrivalent Human Papillomavirus Vaccination in Healthy Female Adults with or without Prior Type 16 and/or 18 Exposure.
Human Tumor-Infiltrating MAIT Cells Display Hallmarks of Bacterial Antigen Recognition in Colorectal Cancer.
TIRC7 inhibits Th1 cells by upregulating the expression of CTLA‑4 and STAT3 in mice with acute graft‑versus‑host disease.
Immunoprophylactic and immunotherapeutic control of hormone receptor-positive breast cancer.
Ovarian granulosa cell tumor characterization identifies FOXL2 as an immunotherapeutic target.
NPM1 upregulates the transcription of PD-L1 and suppresses T cell activity in triple-negative breast cancer.
Single-cell transcriptomics identifies an effectorness gradient shaping the response of CD4(+) T cells to cytokines.
Engineered triple inhibitory receptor resistance improves anti-tumor CAR-T cell performance via CD56.
CXCL4 is a novel inducer of human Th17 cells and correlates with IL-17 and IL-22 in psoriatic arthritis.
RKIP mediates autoimmune inflammation by positively regulating IL-17R signaling.
Accumulation of T-helper 22 cells, interleukin-22 and myeloid-derived suppressor cells promotes gastric cancer progression in elderly patients.
Human in vivo-generated monocyte-derived dendritic cells and macrophages cross-present antigens through a vacuolar pathway.
Chloroquine modulates antitumor immune response by resetting tumor-associated macrophages toward M1 phenotype.
Exposure to wild-type AAV drives distinct capsid immunity profiles in humans.
Dominant immunosuppression of dendritic cell function by prostate-cancer-derived exosomes.
Ebola virus glycoprotein directly triggers T lymphocyte death despite of the lack of infection.
Surrogate in vitro activation of innate immunity synergizes with interleukin-7 to unleash rapid antigen-driven outgrowth of CD4+ and CD8+ human peripheral blood T-cells naturally recognizing MUC1, HER2/neu and other tumor-associated antigens.
Single-cell profiling reveals GPCR heterogeneity and functional patterning during neuroinflammation.
Peritoneal carcinomatosis of colorectal cancer is characterized by structural and functional reorganization of the tumor microenvironment inducing senescence and proliferation arrest in cancer cells.
Heterologous Immunity between Adenoviruses and Hepatitis C Virus: A New Paradigm in HCV Immunity and Vaccines.
CD28 family of receptors on T cells in chronic HBV infection: Expression characteristics, clinical significance and correlations with PD-1 blockade.
A SnoRNA-derived piRNA interacts with human interleukin-4 pre-mRNA and induces its decay in nuclear exosomes.
Failure to upregulate cell surface PD-1 is associated with dysregulated stimulation of T cells by TGN1412-like CD28 superagonist.
Tumor-derived exosomes promote tumor progression and T-cell dysfunction through the regulation of enriched exosomal microRNAs in human nasopharyngeal carcinoma.
Multifactorial T-cell hypofunction that is reversible can limit the efficacy of chimeric antigen receptor-transduced human T cells in solid tumors.
Elevated frequencies of circulating Th22 cell in addition to Th17 cell and Th17/Th1 cell in patients with acute coronary syndrome.
Increased frequencies of Th22 cells as well as Th17 cells in the peripheral blood of patients with ankylosing spondylitis and rheumatoid arthritis.
Chen X, Xue L, Ding X, Zhang J, Jiang L, Liu S, Hou H, Jiang B, Cheng L, Zhu Q, Zhang L, Zhou X, Ma J, Liu Q, Li Y, Ren Z, Jiang B, Song X, Song J, Jin W, Wei M, Shen Z, Liu X, Wang L, Li K, Zhang T
Frontiers in immunology 2022;13:828319
Frontiers in immunology 2022;13:828319
LINC01123 promotes immune escape by sponging miR-214-3p to regulate B7-H3 in head and neck squamous-cell carcinoma.
Li H, Yang Z, Yang X, Zhang F, Wang J, Wu Z, Wanyan C, Meng Q, Gao W, Yang X, Wei J
Cell death & disease 2022 Feb 3;13(2):109
Cell death & disease 2022 Feb 3;13(2):109
Identification of CTL Epitopes on Efflux Pumps of the ATP-Binding Cassette and the Major Facilitator Superfamily of Mycobacterium tuberculosis.
Lin Y, Dong Y, Gao Y, Shi R, Li Y, Zhou X, Liu W, Li G, Qi Y, Wu Y
Journal of immunology research 2021;2021:8899674
Journal of immunology research 2021;2021:8899674
Early loss of T lymphocyte 4-1BB receptor expression is associated with higher short-term mortality in alcoholic hepatitis.
Eriksen LL, Nielsen MA, Laursen TL, Deleuran B, Vilstrup H, Støy S
PloS one 2021;16(8):e0255574
PloS one 2021;16(8):e0255574
TIGIT(+) TIM-3(+) NK cells are correlated with NK cell exhaustion and disease progression in patients with hepatitis B virus‑related hepatocellular carcinoma.
Yu L, Liu X, Wang X, Yan F, Wang P, Jiang Y, Du J, Yang Z
Oncoimmunology 2021;10(1):1942673
Oncoimmunology 2021;10(1):1942673
Multipeptide stimulated PBMCs generate T(EM)/T(CM) for adoptive cell therapy in multiple myeloma.
Vardam-Kaur T, Pathangey LB, McCormick DJ, Bergsagel PL, Cohen PA, Gendler SJ
Oncotarget 2021 Sep 28;12(20):2051-2067
Oncotarget 2021 Sep 28;12(20):2051-2067
Suppression of 4.1R enhances the potency of NKG2D-CAR T cells against pancreatic carcinoma via activating ERK signaling pathway.
Gao Y, Lin H, Guo D, Cheng S, Zhou Y, Zhang L, Yao J, Farooq MA, Ajmal I, Duan Y, He C, Tao L, Wu S, Liu M, Jiang W
Oncogenesis 2021 Sep 21;10(9):62
Oncogenesis 2021 Sep 21;10(9):62
Niraparib exhibits a synergistic anti-tumor effect with PD-L1 blockade by inducing an immune response in ovarian cancer.
Meng J, Peng J, Feng J, Maurer J, Li X, Li Y, Yao S, Chu R, Pan X, Li J, Zhang T, Liu L, Zhang Q, Yuan Z, Bu H, Song K, Kong B
Journal of translational medicine 2021 Oct 7;19(1):415
Journal of translational medicine 2021 Oct 7;19(1):415
Identification of HLA-A2-Restricted Mutant Epitopes from Neoantigens of Esophageal Squamous Cell Carcinoma.
Wang Z, Ran L, Chen C, Shi R, Dong Y, Li Y, Zhou X, Qi Y, Zhu P, Gao Y, Wu Y
Vaccines 2021 Oct 1;9(10)
Vaccines 2021 Oct 1;9(10)
YY1 regulation by miR-124-3p promotes Th17 cell pathogenicity through interaction with T-bet in rheumatoid arthritis.
Lin J, Tang J, Lin J, He Y, Yu Z, Jiang R, Yang B, Ou Q
JCI insight 2021 Nov 22;6(22)
JCI insight 2021 Nov 22;6(22)
Ageing promotes early T follicular helper cell differentiation by modulating expression of RBPJ.
Webb LMC, Fra-Bido S, Innocentin S, Matheson LS, Attaf N, Bignon A, Novarino J, Fazilleau N, Linterman MA
Aging cell 2021 Jan;20(1):e13295
Aging cell 2021 Jan;20(1):e13295
Suppression of mucosal Th17 memory responses by acellular pertussis vaccines enhances nasal Bordetella pertussis carriage.
Dubois V, Chatagnon J, Thiriard A, Bauderlique-Le Roy H, Debrie AS, Coutte L, Locht C
NPJ vaccines 2021 Jan 8;6(1):6
NPJ vaccines 2021 Jan 8;6(1):6
Lasting antibody and T cell responses to SARS-CoV-2 in COVID-19 patients three months after infection.
Jiang XL, Wang GL, Zhao XN, Yan FH, Yao L, Kou ZQ, Ji SX, Zhang XL, Li CB, Duan LJ, Li Y, Zhang YW, Duan Q, Wang TC, Li ET, Wei X, Wang QY, Wang XF, Sun WY, Gao YW, Kang DM, Zhang JY, Ma MJ
Nature communications 2021 Feb 9;12(1):897
Nature communications 2021 Feb 9;12(1):897
A protocol for isolation of primary human immune cells from the liver and mesenteric white adipose tissue biopsies.
Moreno-Fernandez ME, Damen MSMA, Divanovic S
STAR protocols 2021 Dec 17;2(4):100937
STAR protocols 2021 Dec 17;2(4):100937
A vaccine targeting mutant IDH1 in newly diagnosed glioma.
Platten M, Bunse L, Wick A, Bunse T, Le Cornet L, Harting I, Sahm F, Sanghvi K, Tan CL, Poschke I, Green E, Justesen S, Behrens GA, Breckwoldt MO, Freitag A, Rother LM, Schmitt A, Schnell O, Hense J, Misch M, Krex D, Stevanovic S, Tabatabai G, Steinbach JP, Bendszus M, von Deimling A, Schmitt M, Wick W
Nature 2021 Apr;592(7854):463-468
Nature 2021 Apr;592(7854):463-468
Cancer-secreted exosomal miR-1468-5p promotes tumor immune escape via the immunosuppressive reprogramming of lymphatic vessels.
Zhou C, Wei W, Ma J, Yang Y, Liang L, Zhang Y, Wang Z, Chen X, Huang L, Wang W, Wu S
Molecular therapy : the journal of the American Society of Gene Therapy 2021 Apr 7;29(4):1512-1528
Molecular therapy : the journal of the American Society of Gene Therapy 2021 Apr 7;29(4):1512-1528
A Method of Assessment of Human Natural Killer Cell Phenotype and Function in Whole Blood.
Market M, Tennakoon G, Ng J, Scaffidi M, de Souza CT, Kennedy MA, Auer RC
Frontiers in immunology 2020;11:963
Frontiers in immunology 2020;11:963
Th2 Biased Immunity With Altered B Cell Profiles in Circulation of Patients With Sporotrichosis Caused by Sporothrix globosa.
Zu J, Yao L, Song Y, Cui Y, Guan M, Chen R, Zhen Y, Li S
Frontiers in immunology 2020;11:570888
Frontiers in immunology 2020;11:570888
Inhibition of Cholesterol Esterification Enzyme Enhances the Potency of Human Chimeric Antigen Receptor T Cells against Pancreatic Carcinoma.
Zhao L, Liu Y, Zhao F, Jin Y, Feng J, Geng R, Sun J, Kang L, Yu L, Wei Y
Molecular therapy oncolytics 2020 Mar 27;16:262-271
Molecular therapy oncolytics 2020 Mar 27;16:262-271
Duration of Cellular and Humoral Responses after Quadrivalent Human Papillomavirus Vaccination in Healthy Female Adults with or without Prior Type 16 and/or 18 Exposure.
Lai L, Ault K, Rouphael N, Beck A, Domjahn B, Xu Y, Anderson EJ, Cheng A, Nakamura A, Hoagland RJ, Kelley C, Edupuganti S, Mask K, Nesin M, Unger ER, Panicker G, David H, Mulligan MJ
Vaccines 2020 Jun 30;8(3)
Vaccines 2020 Jun 30;8(3)
Human Tumor-Infiltrating MAIT Cells Display Hallmarks of Bacterial Antigen Recognition in Colorectal Cancer.
Li S, Simoni Y, Becht E, Loh CY, Li N, Lachance D, Koo SL, Lim TP, Tan EKW, Mathew R, Nguyen A, Golovato J, Berkson JD, Prlic M, Lee B, Minot SS, Nagarajan N, Dey N, Tan DSW, Tan IB, Newell EW
Cell reports. Medicine 2020 Jun 23;1(3):100039
Cell reports. Medicine 2020 Jun 23;1(3):100039
TIRC7 inhibits Th1 cells by upregulating the expression of CTLA‑4 and STAT3 in mice with acute graft‑versus‑host disease.
Zhu F, Qiu T, Zhu S, Zhao K, Chen C, Qiao J, Pan B, Yan Z, Chen W, Liu Q, Wu Q, Cao J, Sang W, Zeng L, Sun H, Li Z, Xu K
Oncology reports 2020 Jul;44(1):43-54
Oncology reports 2020 Jul;44(1):43-54
Immunoprophylactic and immunotherapeutic control of hormone receptor-positive breast cancer.
Buqué A, Bloy N, Perez-Lanzón M, Iribarren K, Humeau J, Pol JG, Levesque S, Mondragon L, Yamazaki T, Sato A, Aranda F, Durand S, Boissonnas A, Fucikova J, Senovilla L, Enot D, Hensler M, Kremer M, Stoll G, Hu Y, Massa C, Formenti SC, Seliger B, Elemento O, Spisek R, André F, Zitvogel L, Delaloge S, Kroemer G, Galluzzi L
Nature communications 2020 Jul 30;11(1):3819
Nature communications 2020 Jul 30;11(1):3819
Ovarian granulosa cell tumor characterization identifies FOXL2 as an immunotherapeutic target.
Pierini S, Tanyi JL, Simpkins F, George E, Uribe-Herranz M, Drapkin R, Burger R, Morgan MA, Facciabene A
JCI insight 2020 Aug 20;5(16)
JCI insight 2020 Aug 20;5(16)
NPM1 upregulates the transcription of PD-L1 and suppresses T cell activity in triple-negative breast cancer.
Qin G, Wang X, Ye S, Li Y, Chen M, Wang S, Qin T, Zhang C, Li Y, Long Q, Hu H, Shi D, Li J, Zhang K, Zhai Q, Tang Y, Kang T, Lan P, Xie F, Lu J, Deng W
Nature communications 2020 Apr 3;11(1):1669
Nature communications 2020 Apr 3;11(1):1669
Single-cell transcriptomics identifies an effectorness gradient shaping the response of CD4(+) T cells to cytokines.
Cano-Gamez E, Soskic B, Roumeliotis TI, So E, Smyth DJ, Baldrighi M, Willé D, Nakic N, Esparza-Gordillo J, Larminie CGC, Bronson PG, Tough DF, Rowan WC, Choudhary JS, Trynka G
Nature communications 2020 Apr 14;11(1):1801
Nature communications 2020 Apr 14;11(1):1801
Engineered triple inhibitory receptor resistance improves anti-tumor CAR-T cell performance via CD56.
Zou F, Lu L, Liu J, Xia B, Zhang W, Hu Q, Liu W, Zhang Y, Lin Y, Jing S, Huang M, Huang B, Liu B, Zhang H
Nature communications 2019 Sep 11;10(1):4109
Nature communications 2019 Sep 11;10(1):4109
CXCL4 is a novel inducer of human Th17 cells and correlates with IL-17 and IL-22 in psoriatic arthritis.
Affandi AJ, Silva-Cardoso SC, Garcia S, Leijten EFA, van Kempen TS, Marut W, van Roon JAG, Radstake TRDJ
European journal of immunology 2018 Mar;48(3):522-531
European journal of immunology 2018 Mar;48(3):522-531
RKIP mediates autoimmune inflammation by positively regulating IL-17R signaling.
Lin W, Wang N, Zhou K, Su F, Jiang Y, Shou J, Liu H, Ma C, Qian Y, Wang K, Wang X
EMBO reports 2018 Jun;19(6)
EMBO reports 2018 Jun;19(6)
Accumulation of T-helper 22 cells, interleukin-22 and myeloid-derived suppressor cells promotes gastric cancer progression in elderly patients.
Chen X, Wang Y, Wang J, Wen J, Jia X, Wang X, Zhang H
Oncology letters 2018 Jul;16(1):253-261
Oncology letters 2018 Jul;16(1):253-261
Human in vivo-generated monocyte-derived dendritic cells and macrophages cross-present antigens through a vacuolar pathway.
Tang-Huau TL, Gueguen P, Goudot C, Durand M, Bohec M, Baulande S, Pasquier B, Amigorena S, Segura E
Nature communications 2018 Jul 2;9(1):2570
Nature communications 2018 Jul 2;9(1):2570
Chloroquine modulates antitumor immune response by resetting tumor-associated macrophages toward M1 phenotype.
Chen D, Xie J, Fiskesund R, Dong W, Liang X, Lv J, Jin X, Liu J, Mo S, Zhang T, Cheng F, Zhou Y, Zhang H, Tang K, Ma J, Liu Y, Huang B
Nature communications 2018 Feb 28;9(1):873
Nature communications 2018 Feb 28;9(1):873
Exposure to wild-type AAV drives distinct capsid immunity profiles in humans.
Kuranda K, Jean-Alphonse P, Leborgne C, Hardet R, Collaud F, Marmier S, Costa Verdera H, Ronzitti G, Veron P, Mingozzi F
The Journal of clinical investigation 2018 Dec 3;128(12):5267-5279
The Journal of clinical investigation 2018 Dec 3;128(12):5267-5279
Dominant immunosuppression of dendritic cell function by prostate-cancer-derived exosomes.
Salimu J, Webber J, Gurney M, Al-Taei S, Clayton A, Tabi Z
Journal of extracellular vesicles 2017;6(1):1368823
Journal of extracellular vesicles 2017;6(1):1368823
Ebola virus glycoprotein directly triggers T lymphocyte death despite of the lack of infection.
Iampietro M, Younan P, Nishida A, Dutta M, Lubaki NM, Santos RI, Koup RA, Katze MG, Bukreyev A
PLoS pathogens 2017 May;13(5):e1006397
PLoS pathogens 2017 May;13(5):e1006397
Surrogate in vitro activation of innate immunity synergizes with interleukin-7 to unleash rapid antigen-driven outgrowth of CD4+ and CD8+ human peripheral blood T-cells naturally recognizing MUC1, HER2/neu and other tumor-associated antigens.
Pathangey LB, McCurry DB, Gendler SJ, Dominguez AL, Gorman JE, Pathangey G, Mihalik LA, Dang Y, Disis ML, Cohen PA
Oncotarget 2017 Feb 14;8(7):10785-10808
Oncotarget 2017 Feb 14;8(7):10785-10808
Single-cell profiling reveals GPCR heterogeneity and functional patterning during neuroinflammation.
Tischner D, Grimm M, Kaur H, Staudenraus D, Carvalho J, Looso M, Günther S, Wanke F, Moos S, Siller N, Breuer J, Schwab N, Zipp F, Waisman A, Kurschus FC, Offermanns S, Wettschureck N
JCI insight 2017 Aug 3;2(15)
JCI insight 2017 Aug 3;2(15)
Peritoneal carcinomatosis of colorectal cancer is characterized by structural and functional reorganization of the tumor microenvironment inducing senescence and proliferation arrest in cancer cells.
Seebauer CT, Brunner S, Glockzin G, Piso P, Ruemmele P, Schlitt HJ, Geissler EK, Fichtner-Feigl S, Kesselring R
Oncoimmunology 2016;5(12):e1242543
Oncoimmunology 2016;5(12):e1242543
Heterologous Immunity between Adenoviruses and Hepatitis C Virus: A New Paradigm in HCV Immunity and Vaccines.
Singh S, Vedi S, Samrat SK, Li W, Kumar R, Agrawal B
PloS one 2016;11(1):e0146404
PloS one 2016;11(1):e0146404
CD28 family of receptors on T cells in chronic HBV infection: Expression characteristics, clinical significance and correlations with PD-1 blockade.
Tang ZS, Hao YH, Zhang EJ, Xu CL, Zhou Y, Zheng X, Yang DL
Molecular medicine reports 2016 Aug;14(2):1107-16
Molecular medicine reports 2016 Aug;14(2):1107-16
A SnoRNA-derived piRNA interacts with human interleukin-4 pre-mRNA and induces its decay in nuclear exosomes.
Zhong F, Zhou N, Wu K, Guo Y, Tan W, Zhang H, Zhang X, Geng G, Pan T, Luo H, Zhang Y, Xu Z, Liu J, Liu B, Gao W, Liu C, Ren L, Li J, Zhou J, Zhang H
Nucleic acids research 2015 Dec 2;43(21):10474-91
Nucleic acids research 2015 Dec 2;43(21):10474-91
Failure to upregulate cell surface PD-1 is associated with dysregulated stimulation of T cells by TGN1412-like CD28 superagonist.
Thaventhiran T, Alhumeed N, Yeang HX, Sethu S, Downey JS, Alghanem AF, Olayanju A, Smith EL, Cross MJ, Webb SD, Williams DP, Bristow A, Ball C, Stebbings R, Sathish JG
mAbs 2014;6(5):1290-9
mAbs 2014;6(5):1290-9
Tumor-derived exosomes promote tumor progression and T-cell dysfunction through the regulation of enriched exosomal microRNAs in human nasopharyngeal carcinoma.
Ye SB, Li ZL, Luo DH, Huang BJ, Chen YS, Zhang XS, Cui J, Zeng YX, Li J
Oncotarget 2014 Jul 30;5(14):5439-52
Oncotarget 2014 Jul 30;5(14):5439-52
Multifactorial T-cell hypofunction that is reversible can limit the efficacy of chimeric antigen receptor-transduced human T cells in solid tumors.
Moon EK, Wang LC, Dolfi DV, Wilson CB, Ranganathan R, Sun J, Kapoor V, Scholler J, Puré E, Milone MC, June CH, Riley JL, Wherry EJ, Albelda SM
Clinical cancer research : an official journal of the American Association for Cancer Research 2014 Aug 15;20(16):4262-73
Clinical cancer research : an official journal of the American Association for Cancer Research 2014 Aug 15;20(16):4262-73
Elevated frequencies of circulating Th22 cell in addition to Th17 cell and Th17/Th1 cell in patients with acute coronary syndrome.
Zhang L, Wang T, Wang XQ, Du RZ, Zhang KN, Liu XG, Ma DX, Yu S, Su GH, Li ZH, Guan YQ, Du NL
PloS one 2013;8(12):e71466
PloS one 2013;8(12):e71466
Increased frequencies of Th22 cells as well as Th17 cells in the peripheral blood of patients with ankylosing spondylitis and rheumatoid arthritis.
Zhang L, Li YG, Li YH, Qi L, Liu XG, Yuan CZ, Hu NW, Ma DX, Li ZF, Yang Q, Li W, Li JM
PloS one 2012;7(4):e31000
PloS one 2012;7(4):e31000
No comments: Submit comment
Supportive validation
- Submitted by
- Invitrogen Antibodies (provider)
- Main image

- Experimental details
- Normal human peripheral blood cells were unstimulated (left) or stimulated with Cell Stimulation Cocktail (plus protein transport inhibitors) (500X) (Product # 00-4975-03) (right). Cells were fixed and stained intracellularly with Anti-Human CD4 APC (Product # 17-0047-42) and Anti-Human IFN gamma eFluor® 506, using the Intracellular Fixation & Permeabilization Buffer Set (Product # 88-8824-00) and protocol. Cells in the lymphocyte gate were used for analysis.

Supportive validation
- Submitted by
- Invitrogen Antibodies (provider)
- Main image

- Experimental details
- NULL

- Submitted by
- Invitrogen Antibodies (provider)
- Main image

- Experimental details
- NULL

- Submitted by
- Invitrogen Antibodies (provider)
- Main image

- Experimental details
- NULL

- Submitted by
- Invitrogen Antibodies (provider)
- Main image

- Experimental details
- NULL

- Submitted by
- Invitrogen Antibodies (provider)
- Main image

- Experimental details
- NULL

- Submitted by
- Invitrogen Antibodies (provider)
- Main image

- Experimental details
- NULL

- Submitted by
- Invitrogen Antibodies (provider)
- Main image

- Experimental details
- NULL

- Submitted by
- Invitrogen Antibodies (provider)
- Main image

- Experimental details
- NULL

- Submitted by
- Invitrogen Antibodies (provider)
- Main image

- Experimental details
- NULL

- Submitted by
- Invitrogen Antibodies (provider)
- Main image

- Experimental details
- NULL

- Submitted by
- Invitrogen Antibodies (provider)
- Main image

- Experimental details
- NULL

- Submitted by
- Invitrogen Antibodies (provider)
- Main image
- Experimental details
- NULL

- Submitted by
- Invitrogen Antibodies (provider)
- Main image
- Experimental details
- NULL

- Submitted by
- Invitrogen Antibodies (provider)
- Main image

- Experimental details
- NULL

- Submitted by
- Invitrogen Antibodies (provider)
- Main image

- Experimental details
- NULL

- Submitted by
- Invitrogen Antibodies (provider)
- Main image

- Experimental details
- Fig 4 Cross-reactive CD4 + and CD8 + T cells obtained from Ad vector immunized mice produce cytokines upon ex vivo stimulation with various HCV proteins. Splenocytes obtained from Ad vector immunized mice were cultured with HCV core, NS3, NS4 or NS5 antigens at 5 mug/ml, and analyzed after 5 days for intracellular IFN-gamma and IL-10 expression profile of CD4 + and CD8 + T cells by flow cytometry. Data are obtained from a pool (n = 5) of spleen cells and are representative of two independent experiments.

- Submitted by
- Invitrogen Antibodies (provider)
- Main image

- Experimental details
- Fig 5 Cross-reactive CD4 + and CD8 + T cells obtained from Ad vector immunized mice produce cytokines upon ex vivo stimulation with HCV peptides. Splenocytes obtained from Ad vector immunized mice were cultured with representative peptides derived from HCV core, NS3, NS4 or NS5 at 5 mug/ml each, and analyzed after 5 days for intracellular IFN-gamma and IL-10 expression profile of CD4 + and CD8 + T cells by flow cytometry. Data are obtained from a pool (n = 5) of spleen cells and are representative of two independent experiments.

- Submitted by
- Invitrogen Antibodies (provider)
- Main image

- Experimental details
- Figure 6. Adenosinergic suppression of T cell and DC function by exosomes. (a) T cell line: 5T4-specific responses to DC+peptide stimulation in the presence or absence of NECA. % IFNgamma-producing T cells, determined by flow cytometry. (b) Percentage of DC that produce TNFalpha (i) or IL-12 (ii) following LPS and exosome treatment in the presence or absence of ATP. Raw data are shown as symbols. Means and SE are also shown. Representatives of two repeated experiments are shown. (c) 5T4 peptide-pulsed DC, treated with/without exosomes and PGE 2 receptor inhibitor (PGE2Ri) for 24 h, were incubated with AMP (0 or 200 uM) for 20 min before being co-cultured with 5T4-specific T cells. A 2A receptor inhibitor (A2ARi) was added and cytokine flow cytometry carried out after overnight incubation. Means + SE % of IFNgamma + CD8 + T cells are shown from triplicate cultures. * p < 0.05, ** p < 0.01, *** p < 0.001.

- Submitted by
- Invitrogen Antibodies (provider)
- Main image

- Experimental details
- Fig. 6 Human mo-DCs, but not mo-Mac, are efficient inducers of effector cytotoxic CD8 + T cells. Purified DCs and macrophage from tumor ascites were cultured with allogeneic CellTrace Violet-stained naive CD8 + T cells for 7 days, in the absence ( a , b ) or presence ( c , d ) of naive CD4 + T cells autologous to CD8 + T cells. Expression of Granzyme A, Perforin, and IFN-gamma was assessed by intracellular flow cytometry. a , c Representative results of eight independent experiments. Gated on live CD8 + T cells. b Number of proliferating CD8 + T cells is shown. Symbols represent individual donors. N = 8. Median is shown. d Number of CD8 + T cells expressing effector molecules is shown. Symbols represent individual donors. N = 8. Median is shown. * p < 0.05, ** p < 0.01, Wilcoxon non-parametric test

- Submitted by
- Invitrogen Antibodies (provider)
- Main image

- Experimental details
- Figure 6. piR30840 regulates the development of Th2 lymphocytes. ( A and B ) Human CD4 naive cells were cultured in a conditioned medium for Th2 development and then transfected with an s30840 (A) or piR30840 inhibitor (B). IL-4 expression was detected by qRT-PCR and western blotting analyses. P < 0.01. The data represents three independent experiments. ( C ) Detection of IL-4 expression in human PBMCs isolated from humanized NOG mice. IL-4 expression was detected by qRT-PCR analysis. The data was expressed as the mean of three independent experiments. Wilcoxon test was used to calculate the P -value. P < 0.05. ( D ) CD4 naive cells were cultured in the conditioned medium for Th2 development and transfected with s30840 or control. After 7 days, the Th2 T-lymphocytes (intracellular stained as IL-4 + IFN-gamma - ) were detected with FACS analysis. The data was shown as a mean of six independent experiments. P < 0.01. ( E ) The CD4 naive cells were cultured in a conditioned medium for Th2 development with or without the transfection of inhibitor. We adoptively transferred the naive cells into the irradiated NOG mice which were first humanized. After 7 days, Th2 T-lymphocytes (intracellularly stained as IL-4 + IFNgamma - ) were detected by using FACS analysis. The data were expressed as the mean of six independent experiments. Statistical significance between two samples was determined by using the student's t -test. P < 0.01.

- Submitted by
- Invitrogen Antibodies (provider)
- Main image

- Experimental details
- Fig. 6 Interactions between effectorness and cytokine condition regulate gene expression. a Schematic representation of the gene expression interaction model. Effectorness and cytokine conditions were incorporated into a linear model with an interaction term (Methods). Genes were assigned to four groups: genes induced by cytokine-stimulation regardless of effectorness (left panel), genes which correlate with effectorness regardless of cytokine-stimulation (central left panel), and genes which correlate with both effectorness and cytokine-stimulation either independently (central right panel) or through an interaction (right panel). b Plots of gene expression ( y axis) as a function of effectorness ( x axis), with cells stratified by cytokine condition. Two example genes significantly associated with effectorness regardless of cytokine conditions (top panels) and two example genes with a strong interaction between effectorness and Th17 or iTreg-stimulation (bottom panels). Each dot represents a single-cell. c Protein expression levels for 18 genes associated with effectorness in activated T N , T CM , and T EM and T EMRA cells regardless of cytokines condition (genes used in the analysis: ACTB, CCL3, CCL5, CTSW, GNLY, GZMA, GZMB, HLA-DPB1, HLA-DQA1, HLA-DRA, HLA-DRB1, HOPX, IFNG, LGMN, LMNA, NFKBIA, TMEM173, TNFRSF18 )). Expression values were obtained from a publicly available quantitative proteomics data set (Methods). Significance was calculated using one-way ANOVA ( p = 3.

- Submitted by
- Invitrogen Antibodies (provider)
- Main image

- Experimental details
- 10.1371/journal.pone.0071466.g001 Figure 1 Flow cytometric analysis of Th1 cells, Th22 cells and CD4 + IFNgamma - IL17 + IL-22 + cells. Peripheral blood from patients with AMI, UA, SA and HC subjects were stimulated with PMA, ionomycin and monensin for 4 h, and then stained with labeled antibodies as described in Methods . A, Gating strategies and representative flow cytometry dot plot results of each group. Lymphocytes were gated in R1 by forward and side scatter gating. These cells were analyzed for IFN-gamma producing and CD4 expression T cells. CD4 + IFN-gamma - cells were gated in R2 and analyzed for IL-17 and IL-22 producing T cells. Numbers represent the percentage of cells in the quadrants. B, Comparison of the percentages of circulating Th22 cells (left panel, % of CD4 + IFN-gamma - cells), Th1 cells (middle panel, % of total lymphocytes) and CD4 + IFNgamma - IL17 + IL-22 + cells (right panel, % of CD4 + IFN-gamma - cells) from AMI, UA, SA patients and healthy controls. (* = P

- Submitted by
- Invitrogen Antibodies (provider)
- Main image

- Experimental details
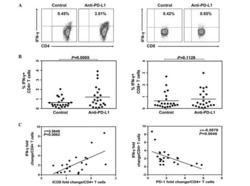
- Figure 5. Absence of PD-1 mediated regulation of T cell function in CD28SA- stimulated T cells. ( A ) Schematic of the protocol used to investigate the functional significance of PD-1 pathway on NIB1412-activated CD4 + T cells. ( B ) Human PBMCs were stimulated for 48 h with plate-bound anti-CD3 mAb (CD3, 5 mug/ml); NIB1412 (NIB1412, 10 mug/ml); anti-CD3 mAb and NIB1412 (CD3 and NIB1412); control category included cells without any treatment (Control). Cells were then re-stimulated with anti-CD3 only (CD3,1 mug/ml) or with anti-CD3 and 10 mug/ml of rPD-L1 (CD3 and rPD-L1). Cells were harvested and stained with fluorochrome-conjugated anti-CD4 antibody, fixed, permeabilized, stained with fluorochrome-conjugated anti-IFNgamma antibody and analyzed by flow cytometry. The CD4 + population is shown in light gray and the CD4 - population in dark gray. The percentages of the CD4 + IFNgamma + cells are shown in the upper right quadrant. Results are representative of four independent experiments.

- Submitted by
- Invitrogen Antibodies (provider)
- Main image

- Experimental details
- Fig. 8 NAM-treated tumors exhibit improved antigen presentation and superior cytotoxic functions. a tSNE plots of untreated and NAM-treated TSA tumors. Number of cells in each of the main four populations is reported. b Differential expression of genes involved in immune regulation in CD45 + cells isolated from untreated vs NAM-treated TSA tumors. Results are mean +- SEM plus individual data points. Number of cells independently analyzed for each gene is reported in ( a ), p values (two-sided Wilcoxon test) are indicated. See also Supplementary Data 1 . c , d Percentage of IFNG + and IFNG + GZMB + amongst CD8 + T cells ( c ) and CD56 + NK cells ( d ) from peripheral blood mononuclear cells (PBMCs) of healthy donors subjected to non-specific activation overnight in the presence of the indicated concentrations of NAM. Results are means +- SEM plus individual data points. Number of biologically independent samples and p values (one way-ANOVA plus Fisher LSD, as compared to untreated cells) are reported. e Relative expression levels of Ifnb1 and Ccl2 in TSA cells cultured in control conditions or exposed to the indicated concentrations of NAM for 48 h. Results are means +- SEM plus individual data points. Number of biologically independent samples and p values (one way-ANOVA plus Fisher LSD, as compared to untreated cells) are reported.

- Submitted by
- Invitrogen Antibodies (provider)
- Main image

- Experimental details
- Fig. 1 PTL-Her2-CAR T cells exerted a potent antitumor activity and infiltration in tumor tissue. a Schematic diagram of a complete animal experiment for b , c . SKOV3/luc cells were inoculated subcutaneously into NSG mice. Seven days later, various CAR-T cells were infused via tail injection and GP120-CAR-T cells were used as mock CAR-T cells. All the mice were analyzed on the IVIS once a week ( n = 3, GP120-CAR-T group; n = 8, other groups). b Tumor burden over time showed bioluminescent signal quantified per mouse. The black cross means death or killing of the debilitated mouse. c Kaplan-Meier survival analysis of mice. d , e SKOV3 cells were inoculated subcutaneously into NSG mice. Seven days later, various CAR-T cells were infused via tail injection ( n = 3 for GP120-CAR-T group and n = 5 for other groups). At day 28 after CAR-T cell infusion, tumor tissues were resected from the mice, followed by digestion and FACS analysis. d The percentage of infiltrating CAR-T cells in tumor. e Left panel shows representative flow cytometry analysis of IFN-gamma-positive cells; right panel shows the percentages of IFN-gamma-positive cells in tumor-infiltrating CAR-T cells among different groups. f Up panel shows schematic diagram of SKOV3/luc tumor re-challenge assay. SKOV3/luc cells were inoculated subcutaneously into the opposite hemisphere of NSG mice. Seven days later, 2 x 10 6 Her2-CAR-T cells or PTL-Her2-CAR-T cells per mouse, which were double dose than that for the above conv

- Submitted by
- Invitrogen Antibodies (provider)
- Main image

- Experimental details
- Fig. 5 Homophilic interaction of CD56 enhanced the antitumor activity of CAR-T cells. a Graph shows the emission ratio of FRET between the CFP-CD56 and YFP-CD56. Data were plotted as 500~550 nm/495~505 nm ratios vs. the concentration of P3DE + P3G peptides. b , c The effect of the P3DE + P3G on the function of PTL-Her2-CAR-T cells targeting SKOV3 cells were detected by cytotoxic activity ( n = 4, 4 healthy donors) ( b ) and IFN-gamma ELISpot assay ( n = 2, 2 healthy donors) ( c ). All peptides were used at a concentration of 200 mug ml -1 . d - h SKOV3-bearing NSG mice were infused via tail with various CAR-T cells. The mice receiving PTL-Her2-CAR-T cells infusion were divided into two groups, with P3DE + P3G or PNC peptide, respectively. Thirteen days later, mice were killed and tumor tissues were digested for FACS. d Volume of mice ( n = 4-5 mice for each group). e The representative flow cytometry analysis of CAR-T cells by detecting the scFv fragment of CAR moiety with anti-Fab antibody. f The representative flow cytometry analysis of IFN-gamma-positive cells in tumor-infiltrating CAR-T cells of different groups. g Immunofluorescence staining of the frozen tissue sections of xenograft tumors treated with PTL-Her2-CAR-T cells, in the presence of P3DE + P3G peptides or PNC. CAR-T cells were stained with anti-mouse IgG H&L (green). CD56 was stained with anti-human CD56 (white), IFN-gamma was stained with anti-human IFN-gamma (red), and nuclei were stained with DAPI (blue). S

- Submitted by
- Invitrogen Antibodies (provider)
- Main image

- Experimental details
- Figure5. TIGIT + TIM-3 + NK cells in HBV-HCC patients are functionally exhausted. a-c Intracellular staining for IFN-gamma (a), TNF-alpha (b) and CD107a (c) in TIGIT + TIM-3 + NK cells from HBV-HCC patients (n = 30) upon in vitro stimulation for IL-12, IL-15, and IL-18 (100, 20, and 100 ng/ml, respectively).d Percentage of expression of Ki67 (d) on TIGIT - TIM-3 - , TIGIT + TIM-3 - , TIGIT - TIM-3 + and TIGIT + TIM-3 + NK cells from patients with HBV-HCC (n = 8).e Representative flow cytometry data and histogram showing the percentage of T-bet lo Eomes hi and T-bet hi Eomes lo cells (e) in different subpopulations of TIGIT + TIM-3 + NK cells from patients with HBV-HCC (n = 8). P values were obtained by the Kruskal-Wallis ANOVA test. * P < .05, ** P < .01, *** P < .001

- Submitted by
- Invitrogen Antibodies (provider)
- Main image

- Experimental details
- 10.1371/journal.pone.0255574.g002 Fig 2 Cytokine production in 4-1BB + and 4-1BB - CD4 + T lymphocytes. Flow cytometry of peripheral blood mononuclear cells stimulated for 48 hours with anti-CD3 and anti-CD28 given PMA and brefaldin-A for the last 4 hours. (A) Typical flow cytometry plot of 4-1BB + CD4 + T lymphocytes from a patient with alcoholic hepatitis showing interferon-gamma (IFNy) on x-axis and interleukin-10 (IL-10) on y-axis. Frequencies of interferon-gamma + (B, n = 6) and IL-10 + (C, n = 3)) 4-1BB + and 4-1BB - CD4 + T lymphocytes in patients with alcoholic hepatitis. Differences between groups compared using paried T test. Graphs shown as median with interquartile range.

- Submitted by
- Invitrogen Antibodies (provider)
- Main image

- Experimental details
- Figure 1 CXCL4 increases the percentage of IL-17 producing cells in CD3/CD28-stimulated human CD4 + T cells. CD4 + T cells were isolated from healthy donors and cultured with CD3/CD28 coated Dynabeads and CXCL4 for five days. (A, B) The effect of CXCL4 on IL-17 production by CD4 + T cells was assessed by (A) flow cytometric intracellular cytokine staining and (B) enzyme-linked immunosorbent assay. (C) The percentage of of IFN-gamma-, IL-4- and IL-22-producing CD4 + T cells were measured by flow cytometry. (D, E) The amount of IL-17 producing cells co-expressing IFN-gamma (D) or IL-22 (E) were measured by flow cytometry. Cells were gated on live, single cells. Means (bars) and values from each donor are shown. Data are pooled from two to four independent experiments, except for panel B from 14 independent experiments, with one to four donor samples per experiment. Each dot on the bar graphs represent a single donor and paired t -test was used for statistical analysis. * p

- Submitted by
- Invitrogen Antibodies (provider)
- Main image

- Experimental details
- Figure 2 CXCL4 induces IL-17 producing cells differentiated from naive human CD4 + T cells. Naive CD4 + T cells were purified by fluorescence-activated cell sorting and cultured with CD3/CD28 coated Dynabeads and CXCL4 for seven days. (A, B) The effect of CXCL4 on IL-17 production by CD4 + T cells was assessed by (A) flow cytometric intracellular cytokine staining and (B) enzyme-linked immunosorbent assay. (C) The levels of IFN-gamma-, IL-4-, IL-22-, and IL-17/IFN-gamma-producing CD4 + T cells were measured by flow cytometry. (D) The amount of IL-17 producing cells co-expressing or IL-22 was measured by flow cytometry. Cells were gated on live, single cells. Means (bars) and values from each donor are shown. Data are pooled from four to 10 independent experiments, with one to two donor samples per experiment. Each dot on the bar graphs represents a single donor and paired t -test was used for statistical analysis. * p

- Submitted by
- Invitrogen Antibodies (provider)
- Main image

- Experimental details
- FIGURE 2 Age promotes pre-Tfh cell differentiation in humans. Flow plots showing the frequency of CXCR5 + PD-1 + cells amongst CD4 + following 4 days in vitro activation of naive CD4 + T cells taken from younger (17-39 yrs) and older (>60 yrs) donors in the presence/absence IL-12 and TGFbeta (a). Percentage of CXCR5 + PD-1 + following activation of naive CD4 + T cells from younger and older donors in the absence (b) or presence (c) of IL-12 and TGFbeta. Percentage of CXCR5 + PD1 + cells following activation of naive CD4 + T cells from older donors with or without neutralising antibodies to IL-12, Activin A and TGFbeta (d). Bar graphs showing percentage of cells expressing pSTAT3 (e, f), and pSTAT5 (g, h) on day 3 of culture in presence/absence of IL-12 and TGFbeta in donors of the indicated ages. RT-PCR determination MAF (i), BCL6 (j), FOXP3 (k) and CXCL13 (l) following 4 days activation of naive CD4 + T cells from younger and older donors in the absence of polarising cytokines. Flow plots (m-o) and bar graphs (n-o) showing percentage of IFNgamma and IL-21 expressing cells following PMA and ionomycin mediated restimulation after 4 days in vitro culture of naive CD4 + T cells from younger and older donors in the absence of IL-12 and TGFbeta (m-o). Bar graph showing levels of IgG produced by B cells following co-culture with CD4+ T cells from day four cultures from young and older donors, in the presence/absence of Tfh-polarising cytokines (p). Each symbol is representative of

- Submitted by
- Invitrogen Antibodies (provider)
- Main image

- Experimental details
- Figure 5 Activity of CTLs induced with peptide after preimmunization with CFA in HLA-A2.1/K b transgenic mice. Complete Freund's adjuvant (CFA, 200 mu L) was injected subcutaneously into HLA-A2.1/K b transgenic mice ( n = 5) on day-14. The mice were then subcutaneously immunized at the base of the tail with each peptide (100 mu g/mice) and T helper epitope (140 mu g/mice) emulsified with incomplete Freund's adjuvant (IFA) at 1 : 1 three times (on days 0, 5, and 10). On day 11, all mice were sacrificed and the serum was collected from each mouse to measure the IFN/- gamma concentration (a). The splenic lymphocytes were isolated from each mouse and restimulated once with each peptide (10 mu g/mL) and mIL-2 (10 U/mL) in vitro for another 6 days. On day 7, the IFN- gamma release in each group was measured with an intracellular cytokine staining (ICS) assay (b) and the lysis activity were measured with an LDH assay (c). Peptide-loaded T2A2 cells were used as the target cells. Normal saline (NS) group and Th epitope only group were the negative controls. Statistical significance was determined with Student's t -test ( n = 5). * P < 0.05, ** P < 0.01, and *** P < 0.001 represent the significance of differences relative to the NS group.

- Submitted by
- Invitrogen Antibodies (provider)
- Main image

- Experimental details
- Fig. 3 SARS-CoV-2-specific T cell responses in recovered COVID-19 patients 3-4 months after infection. a Fluorescence-activated cell sorting (FACS) plot example for analysing IFN-gamma expression in CD4 and CD8 T cells is shown for patient No. 4 (Pt4). b Percentage of CD4 + and CD8 + T cells producing IFN-gamma in response to a recombinant replication-deficient adenovirus type 5 that encodes green fluorescent protein (rAd5-GFP), SARS-CoV-2 spike (rAd5-S), or SARS-CoV-2 nucleocapsid protein (rAd5-N) in PBMCs from recovered patients. c FACS plot examples of IFN-gamma and granzyme B (GzmB) or TNF-a co-expression. d - e Functional profile of IFN-gamma + CD4 + ( d ) and CD8 + ( e ) T cells producing GzmB, or TNF-a in response to rAd5-S and rAd5-N. Data are expressed as mean +- SD for b , d and e . * p < 0.05, ** p < 0.01, and *** p < 0.001 by two-tailed paired t -test for b ( p = 0.0001, p = 0.0085, and p = 0.03 for CD4, and p = 0.009 and p = 0.174 for CD8). The two-tailed Mann-Whitney U -test was used for d and e . Gating strategies are in Supplementary Fig. 5 . Source data included as a Source Data File.

- Submitted by
- Invitrogen Antibodies (provider)
- Main image

- Experimental details
- Figure 2 Frequency and proportion of responders of HPV-specific CD4+ T cell induced by 4vHPV vaccination. ( A ) Frequency of HPV-16- (left panel) and HPV-18 (right panel)-specific CD4+ T cell response at Days 0, 67 and 187 in the prospective cohort for all (solid blue line), HPV-naive (dashed red line) and HPV-exposed (dashed green line) subjects expressed as the number of total IFNgamma, IL-2, IL-4 and IL-21 expressing cells per millions of total CD4 T cells; ( B ) proportion of responders for HPV-16- (left panel) and HPV-18 (right panel)-specific CD4+ T cell response at Days 67 and 187 in prospective cohort defined as subjects whose value was greater than the baseline value and with >180 HPV-16+ or >296 HPV-18+ CD4 T cells per million of total CD4 T cells for all (blue bar), HPV-naive (red bar) and HPV-exposed (green bar) subjects.

- Submitted by
- Invitrogen Antibodies (provider)
- Main image

- Experimental details
- Extended Data Fig. 4 T cell immunogenicity and standard treatment in the IDS. a , b , T cell immune responses assessed by MSS (top) and by immune response criteria for positivity over time (bottom) according to concomitant use of steroids until EOT ( a ) and primary SOC treatment ( b ). Top, individual values and median. n (steroids) = 2; n (no steroids) = 28. n (RT) = 5; n (RT + TMZ) = 22; n (TMZ) = 3. Two-sided Kruskal-Wallis test with Dunn's multiple comparison ( b ). c , Gating strategy for flow cytometric effector sub-phenotyping of peripheral IDH1-vac-induced T cells shown in Fig. 2c . FM2, fluorescence minus two; FMO, fluorescence minus one; MOG, negative control.

- Submitted by
- Invitrogen Antibodies (provider)
- Main image

- Experimental details
- Figure 2 PBMCs from healthy donors or multiple myeloma patients generated Ag-specific T cells following stimulation with four different peptide cocktails designed from various antigens. PBMCs from healthy donors (HD) or multiple myeloma (MM) patients' bloods (100 ml) were stimulated with 4 different cocktails, each consisting of either 3 or 5 peptides at 25 mug/ml for each peptide. Cells were harvested on day 19. Shown are percentages of ( A ) Ag-specific CD4 + IFN-gamma + + CD8 + IFN-gamma + and ( B ) CD4 + IFN-gamma + and ( C ) CD8 + IFN-gamma + T cells for HDs and MM patients observed following secondary stimulation with PBMCs pulsed with specific peptides present in MUC1 cocktail, cocktail 1, cocktail 3 and cocktail 4 at the end of the culture period (D19). Cocktails 3 and 4 lack MM2 and MM5 due to unavailability of cells. No statistically significant differences (NS) were observed between the different cocktails or between the HDs and MM patients in each cocktail (Student's t -test p > 0.1 in every comparison).

- Submitted by
- Invitrogen Antibodies (provider)
- Main image

- Experimental details
- Fig. 3 Niraparib treatment alters the proportion and function of tumor-associated lymphocytes in vivo. A Representative images of immunohistochemistry (IHC) staining for poly ADP-ribose polymerase (PARP1) in human normal ovarian tissues and ovarian cancer samples. Scale bar:100 mum. B Expression of PARP1 its relationship with clinical characteristics in ovarian cancer. C Representative images of IHC staining for programmed cell death ligand (PD-L1) and CD8 in human normal ovarian tissues and ovarian cancer samples. Scale bar:100 mum. D The correlation of CD8a and PD-L1 in GEPIA database. E - K Flow cytometry analysis of CD3 + T cells, CD3 + CD4 + T cells, CD3 + CD8 + T cells, CD4 + IFN-gamma + cells, and CD8 + IFN-gamma + cells of the Niraparib treatment patients. All experiments were repeated three times. Data are presented as the mean +- SD. * P < 0.05, ** P < 0.01

- Submitted by
- Invitrogen Antibodies (provider)
- Main image

- Experimental details
- Fig. 5 Combination of Niraparib with PD-L1 blockade can enhance the proportion and function of T lymphocytes in vivo. A Flow cytometry analysis of CD3 + CD4 + T lymphocytes from the peripheral blood of mice treated with control (PBS, 100 mul), Niraparib (25 mg/kg, four times a week), PD-L1 blockade (10 mg/kg, twice a week), and the combination. B Flow cytometry analysis of CD3 + CD8 + T lymphocytes from the peripheral blood of the mice from the four treatment groups. C Flow cytometry analysis of CD4 + IFN-gamma + T lymphocytes from the peripheral blood of the mice from the four treatment groups. D Flow cytometry analysis of CD8 + IFN-gamma + T lymphocytes from the peripheral blood of the mice from the four treatment groups. E Quantification of data of lymphocytes with four different treatment groups. F Representative images of immunohistochemistry (IHC) staining for CD8 and IFN-gamma staining from resected tumors with different treatments at day 52. Scale bar: 50 mum. G Quantification of lymphocytes and IFN-gamma with different treatment groups. All experiments were repeated three times. Data are presented as the mean +- SD. * P < 0.05, ** P < 0.01

- Submitted by
- Invitrogen Antibodies (provider)
- Main image

- Experimental details
- Figure 1 The immunogenicity of candidate mutant peptide-induced T cells to peptide-pulsing T2A2 cells in vitro. PBMCs isolated from five healthy HLA-A2 + donors (donors B-F) were induced by mature DCs pulsed by MUT peptides P53-R267P, NFE2L2-D13N, or PCLO-E4090Q (10 mug/mL) once a week for three weeks. After three rounds of stimulation, peptide-specific T cells were collected and co-cultured with T2A2 cells loaded with MUT or WT peptides and then were detected for IFN-gamma release. ( A ) Representative zebra plots. ( B ) n = 3, three duplicate samples of each donor, and lysis cytotoxicity. ( C ) Typical histogram profiles. ( D ) n = 5. T2A2 + PBS group served as negative control. Statistical significance was determined by Student's t -test. * p < 0.05, ** p < 0.01, *** p < 0.001 represented the significance of T2A2 cells loaded with MUT peptide group versus T2A2 cells loaded with WT peptide group; # p < 0.05, ## p < 0.01, ### p < 0.001 represented the significance of T2A2 cells loaded with MUT peptide group versus T2A2 + PBS group.

- Submitted by
- Invitrogen Antibodies (provider)
- Main image

- Experimental details
- Figure 1 Increased pTh17 cells have potential relationship with YY1 expression in RA. ( A and B ) Representative images of flow cytometry results for the proportion of CD4 + IL-17A + IFN-gamma + cells and CD4 + IL-17A + GM-CSF + cells in PBMCs of patients with RA and OA as well as HDs. Data presented as mean +- SD ( n = 11). * P < 0.05 (ANOVA). ( C ) The relative gene expression levels of YY1 in PBMCs of patients with RA ( n = 33) and OA ( n = 24) as well as HDs ( n = 32). Data presented as box-and-whisker plot (The line within the box and the bounds of the box represent median and interquartile range, respectively. The whiskers denote the 25th percentile minus 1.5 interquartile range and 75th percentile plus 1.5 interquartile range. The points, which are outside the whisker, represent outliers). *** P < 0.001, **** P < 0.0001 (ANOVA). ( D and E ) Analysis of the correlation of IL-17A or IL-22 mRNA and YY1 mRNA in PBMCs of RA patients ( n = 41, Pearson correlation). ( F ) The relative gene expression levels of YY1 in purified CD4 + T cells of patients with RA ( n = 36) and HD ( n = 18). Data presented as box-and-whisker plot (The meaning of the symbols is the same as C ). *** P < 0.001 (Student's t test). ( G and H ) Analysis of the correlation of IL-17A or IL-22 mRNA and YY1 mRNA in purified CD4 + T cells of RA patients ( n = 36, Pearson correlation).

- Submitted by
- Invitrogen Antibodies (provider)
- Main image

- Experimental details
- Figure 2 YY1 is involved in pTh17 cell differentiation. ( A ) Representative Western blots of YY1 in an ex vivo Th17 subset differentiation system including unpolarized, non-pTh17-polarized, and pTh17-polarized groups (at least 3 independent experiments). ( B ) Representative fluorescence images for transfection efficiency of the sh-YY1 lentivirus (scale bars = 100 mum, at least 3 independent experiments). ( C ) The relative expression levels of YY1 for knockdown effect of the sh-YY1 lentivirus ( n = 3 independent experiments). ( D ) Representative Western blots of YY1 for knockdown effect of the sh-YY1 lentivirus (at least 3 independent experiments). ( E and F ) Representative images of flow cytometry results for the proportion of CD4 + IL-17A + IFN-gamma + cells and CD4 + IL-17A + GM-CSF + cells in the pTh17-polarized group treated with the sh-YY1 lentivirus. All data presented as mean +- SEM ( n = 3 of independent experiments). ** P < 0.01, * P < 0.05 (ANOVA).

- Submitted by
- Invitrogen Antibodies (provider)
- Main image

- Experimental details
- Figure 4 YY1 specifically regulates pTh17 cell differentiation through affecting T-bet. ( A ) Heatmap of clustering analysis of differentially expressed genes of cells treated with the sh-YY1 lentiviruses in pTh17-polarized conditions. ( B ) The relative gene expressions of pTh17-related transcription factors and cytokines in cells from YY1-knockdown pTh17-polarized group. Data presented as mean +- SEM ( n = 6). *** P < 0.001, **** P < 0.0001 (Student's t test). ( C ) Representative Western blots of T-bet in an ex vivo Th17 subset differentiation system including unpolarized, non-pTh17-polarized, and pTh17-polarized (at least 3 independent experiments). ( D and E ) Representative images of flow cytometry results for the proportion of CD4 + IL-17A + IFN-gamma + cells and CD4 + IL-17A + GM-CSF + cells in pTh17-polarized group treated with the sh-YY1 lentivirus or cotransfected with sh-YY1 lentivirus and T-bet-overexpressing lentivirus. Data presented as mean +- SEM ( n = 3 independent experiments). ** P < 0.01, * P < 0.05 (ANOVA). ( F and G ) Representative images of flow cytometry results for the proportion of CD4 + IL-17A + IFN-gamma + cells in Th1-polarized group treated with the sh-YY1 lentivirus. Data presented as mean +- SEM ( n = 3 independent experiments). * P < 0.05 (ANOVA).

- Submitted by
- Invitrogen Antibodies (provider)
- Main image

- Experimental details
- Figure 7 miR-124-3p is involved in the pathogenicity of Th17 cells. ( A and B ) Representative images of flow cytometry results for the proportion of CD4 + IL-17A + IFN-gamma + cells and CD4 + IL-17A + GM-CSF + cells in pTh17-polarized group transfected with miR-124-3p mimics, inhibitors, or control plasmid. Data presented as mean +- SEM ( n = 3 independent experiments). * P < 0.05 (ANOVA). ( C - F ) Analysis of the correlation of miR-124-3p and anti-CCP, RF, CRP, and ESR in purified CD4 + T cells of patients with RA ( n = 36. C , E , and F using Pearson correlation, D using Spearman correlation). ( G ) Sketch of miR-124-3p and YY1 in differentiation of pTh17 cells in RA.

- Submitted by
- Invitrogen Antibodies (provider)
- Main image

- Experimental details
- Figure 8. Changes in cytokines in recipient mice on day 21 post-allo-BMT. (A) Changes in IFN-gamma-positive Th1 in recipient mice on day 21 post-allo-BMT as determined via flow cytometry. (B) Changes in IL-4-positive Th2 cells in recipient mice on day 21 post-allo-BMT as determined via flow cytometry. (C) Changes in IL-17-positive Tg17 cells in recipient mice on day 21 post-allo-BMT as determined via flow cytometry. (D) Changes in IL-22-positive Th22 cells in recipient mice on day 21 post-allo-BMT as determined via flow cytometry. Allo-BMT, allogeneic bone marrow transplant; Th, T helper; IFN, interferon; IL, interleukin.

- Submitted by
- Invitrogen Antibodies (provider)
- Main image

- Experimental details
- Fig. 2 NPM1 binds to PD-L1 promoter and upregulates PD-L1 expression in TNBC cells. a Fragments of PD-L1 promoter in the luciferase reporter plasmids. b Activity of the different fragments of PD-L1 promoter was determined by dual-luciferase assay. n = 3 independent experiments. c Schematic diagram of the streptavidin-agarose pull-down assay. d Proteins from the pull-down assay were separated by polyacrylamide gel eletrophoresis and revealed by sliver staining. The protein band marked in red rectangle was cut out to be analyzed by mass spectrometry. Three biological replicate samples were used. e Binding of NPM1 to PD-L1 promoter was examined by ChIP-qPCR. n = 3 independent experiments. f PD-L1 promoter activity in MDA-MB-231 cells transiently transfected with control siRNA (nc), NPM1 siRNAs (si-NPM1-1, si-NPM1-2), control plasmid for NPM1(vector), or NPM1 overexpression plasmid (NPM1 oe) was measured by dual-luciferase assay. g , h PD-L1 mRNA levels ( g ), NPM1 and PD-L1 protein expression ( h ) in MDA-MB-231 and HCC1806 cells with transient NPM1 knockdown or overexpression was detected. i Jurkat cells were co-cultured with MDA-MB-231 or HCC1806 cells in a 1:4 ratio for 48 h, and IL-2 secreted was detected by ELISA. j Primary T cells were co-cultured with MDA-MB-231 and HCC-1806 cells in a 1:30 ratio for 24 h. IFN-gamma producing T cells were detected by flow cytometry. k Western blot analysis of NPM1 and PD-L1 expression in MDA-MB-231 cells with NPM1 knockdown and/or PD-L1 o

- Submitted by
- Invitrogen Antibodies (provider)
- Main image

- Experimental details
- Fig. 2 The expression of NKG2DLs in pancreatic carcinoma cell lines and cytotoxic activity of NKG2D-CAR T cells. a Flow cytometry histograms showed the expression of NKG2DLs on SW1990, CAPAN2, and PANC28. b Line plots displayed the cytotoxicity of Mock T, NKG2D-CAR T, NC-NKG2D-CAR T, and KD2-NKG2D-CAR T against the indicated cell lines at a different effector to target ( E : T ) ratios for 16 h. The expression of CD69 ( c ), IFN-gamma ( d ) and Gzm B ( e ) as well as the expression of CD107a ( f ) were measured by flow cytometry after co-incubating with PANC28 at a 9:1 ratio for 16 h (left). MFI and percentage were statistically analyzed and shown in column chart (middle and right) ( n = 3). Data were representative of three independent experiments. * P < 0.05, ** P < 0.01, *** P < 0.001, **** P < 0.0001, NS not significant.

- Submitted by
- Invitrogen Antibodies (provider)
- Main image

- Experimental details
- Figure 8 Gating strategy for FACS analyses of CD4 + and CD8 + T cytokine production after in vitro stimulation with PMA and Ionomycin A representative of 60 individual human samples. Gating strategy for intracellular detection of TNFalpha and IFNgamma from liver T cells. (A) Intracellular detection of TNFalpha and IFNgamma in CD3 + CD4 + T cells (gated from Figure 6 E) with and without stimulation with PMA/Ionomycin. (B) Intracellular detection of TNFalpha and IFNgamma in CD3 + CD8 + T cells (gated from Figure 6 F) with and without stimulation with PMA/Ionomycin. Left panels unstimulated control. Right panels PMA/Ionomycin stimulated cells.

- Submitted by
- Invitrogen Antibodies (provider)
- Main image

- Experimental details
- Fig. 4 Upregulation of LINC01123 or B7-H3 or downregulation of miR-214-3p induces dysfunction of CD8 + T cells. CD8 + T cells were isolated from PBMCs using immunomagnetic beads. After activation and amplification, CD8 + T cells were cocultured with different CAL-27 cell treatment groups. A Expression of TNF-alpha, IFN-gamma, perforin, and granzyme B in CD8 + T-cell population was analyzed with flow cytometry. B Statistical analysis of the results from flow cytometry of CD8 + T cells. C Expression levels of TNF-alpha, IFN-gamma, perforin, and granzyme B in CAL-27-CD8 + T cocultured supernatants, as detected by ELISA. D CCK8 cytotoxicity test of CD8 + T cells. E ELISA was used to assess the immune activity of CD8 + T cells after recombinant human B7-H3 treatment. * P < 0.05 compared with cells without treatment. The experiment was repeated three times.

- Submitted by
- Invitrogen Antibodies (provider)
- Main image

- Experimental details
- Fig. 6 The function of LINC01123 in HNSCC can be reversed by miR-214-3p silencing. HNSCC cells were transfected with sh-LINC01123 in the presence of inhibitor-NC or miR-214-3p inhibitor. A Relative expression levels of LINC01123, miR-214-3p, and B7-H3 were determined by qRT-PCR. B B7-H3 protein expression was determined by western blot analysis. C CAL-27 cell viability was measured using a CCK8 assay. D Migration of CAL-27 cells was determined by scratch wound-healing assay. E Statistical results of the scratch-healing test. F Migration and invasion of CAL-27 cells, as determined by transwell migration and invasion assay. G Number of migration and invasion cells. H Apoptosis rate and cell-cycle stage were detected by flow cytometry. I Statistical analysis of apoptosis results. J Statistical analysis of cell cycle stage results. K CD8 + T cells were cocultured with CAL-27 cells that had been transfected with plasmids, and the expression of TNF-alpha, IFN-gamma, perforin, and granzyme B in the CD8 + T cells was analyzed by flow cytometry. L Statistical analysis of CD8 + T-cell flow cytometry results. M After different treatments, CAL-27 cells were cocultured with CD8 + T cells, and the expression levels of TNF-alpha, IFN-gamma, perforin, and granzyme B in coculture supernatants were detected by ELISA. N Killing effect of CD8 + T cells on CAL-27 cells, as assessed by CCK8. O Tumor-volume growth curves of the sh-LINC01123 + inhibitor-NC group and sh-LINC01123 + miR-214-3p-inhibit

- Submitted by
- Invitrogen Antibodies (provider)
- Main image

- Experimental details
- Cancer-secreted exosomes reprogram HDLECs to suppress CD8 + T cell immunity (A) Confocal imaging showed the transfer of GFP-labeled exosomes (green) to phalloidin-labeled HDLECs (red) at the indicated time point using Transwell chamber. (B and C) Exosomes secreted by Siha and hCEp were detected by transmission electron microscopy (TEM) (B) and NanoSight analysis (C). Scale bar, 100 nm. (D) Western blot for characteristic proteins of exosomes compared with conditioned media (CM) from Siha and hCEp. (E and F) Flow cytometry analysis of PD-L1 expression (E) and tube-formation assay (F) in HDLECs treated with PBS, hCEp-exo, or Siha-exo. Scale bar, 10 mum. (G-J) Flow cytometry analysis of IFN-gamma (G), CD69 (H), PD-1 (I), and Annexin V (J) expression on CD8 + T cells co-cultured with HDLECs treated with PBS, hCEp-exo, or Siha-exo. (K and L) Quantification of PD-L1 expression (K) and tube formation (L) in HDLECs with indicated treatment. (M-P) Quantification of IFN-gamma (M), CD69 (N), PD-1 (O), and Annexin V (P) expression on CD8 + T cells co-cultured with HDLECs with indicated treatment. The numeric values under the western blot bands represent the protein relative expression (baseline value 1.00). Error bars represent the mean +- SD of three independent experiments. ***p < 0.001.

- Submitted by
- Invitrogen Antibodies (provider)
- Main image

- Experimental details
- Figure 3 NPC tumor-released exosomes inhibited Th1 and Th17 cell induction but promoted Tregs by altering STAT protein phosphorylation A. Differentiation of naive CD4 + T cells into Th1 and Th17 cells and Tregs after stimulation with tumor cells with or without EXOs. Purified naive CD4 + T cells from healthy donors were co-cultured with the irradiated NPC cell line TW03 (EBV + ) and then treated with EXOs or left or untreated in the presence of OKT3 in IL-2 medium for 5 days. INFgamma, IL-17, and Foxp3 staining following by FACS analysis was performed after stimulation with PMA/ionomycin. Representative data of five experiments are shown. B. Numerous data showing the mean percentage +- S.E.M. of positive cell subsets in three independent experiments. * means P < 0.05. C. Western blot analysis for the expression of P-STAT1, P-STAT3, and P-STAT5 proteins. Stimulation with EXOs decreased the expression of P-STAT1 and P-STAT3 but increased the expression of P-STAT5 in OKT3 and NPC cells stimulated by CD4 + T cells; the GAPDH gene was included as a control. Representative data of three experiments are shown.

- Submitted by
- Invitrogen Antibodies (provider)
- Main image

- Experimental details
- Figure 1 Unfractionated PBMC contain highly serviceable, readily activated myeloid Ag-presenting cells A . Cryopreserved healthy donor PBMC derived by leukapheresis were thawed on d0, cultured overnight in RPMI 1640 with standard additives,10% heat deactivated human AB serum, 40ng/ml rhGM-CSF and 20ng/ml rhIL-4, then exposed on d1 to single or paired danger signals (pIC 50mug/ml, R848 10muM, LPS 50ng/ml, IFNgamma 2000 IU/ml). Supernatants were harvested for ELISA on d2 to determine production of IL-12 (functionally assembled IL-12p70 dimer), pg/ml, 6 million PBMC/ml. This is representative of 8 biological replicates. B . Scheme depicting Steps 1 and 2 of culture for groups receiving rhGM-CSF+R848+LPS. C . d2 analyses of PBMC cultured three different ways: (a) standard ""IL-12"" culture group (2 days prior to their initial exposure to rhIL-12 and rhIL-2); (b) ""GM"" conditioned culture group which received rhGM-CSF (40 ng/ml) on d0; (c) ""GM+R848+LPS"" group, same as ""GM"" group but also receiving R848+LPS on d1. d2 supernatants were assayed for IL-12p70 and IL-23 (BD = below detection) and resuspended PBMC were analyzed by FACS for B7.1 and HLA-DR expression within the CD33+ myeloid subpopulation. Mean fluorescent indices (MFI) were normalized relative to isotype control values of 1.0, and are representative of 5 biological replicates. D . Same groups as in C ., carried forward in culture after pulsation either with Candida albicans extract at a 1:10 dilution (CAN) or with r

- Submitted by
- Invitrogen Antibodies (provider)
- Main image

- Experimental details
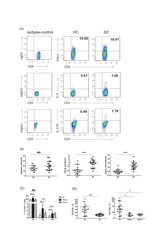
- Figure 1. Flow cytometric analysis was used to determine the distribution of Th22, Th17 and Th1 cells in EGC, HE and HY ( Fig. 1 ). Flow cytometric analysis of Th22, Th17 and Th1 cells in peripheral whole blood from EGC (n=39), HE (n=32) and HY (n=31). (A) Lymphocytes were gated in P1 using flow cytometry. CD4 + IFN-gamma - lymphocytes were gated in P2 using flow cytometry, and representative results of flow cytometric analyses for (B) Th1 (CD4 + IFN-gamma + ), (C) Th22 (CD4 + IFN-gamma - IL-17 - IL-22 + ) and Th17 (CD4 + IFN-gamma - IL-17 + IL-22 - ) cells in the three groups of subjects are presented. The number of cells stained in EGC, HE and HY in P2 were 2,654, 4,696 and 5,185, respectively. The proportion of (D) Th22, (E) Th17 and (F) Th1 cells in the three groups of subjects. The proportion of (G) Th22 and (H) Th17 cells in peripheral whole blood derived from patients with early (n=13) or advanced (n=26) gastric cancer. The association between the proportion of (I) Th22 and Th17 cells, (J) Th22 and Th1 cells, and (K) Th17 and Th1 cells, in peripheral whole blood of all subjects. *P

- Submitted by
- Invitrogen Antibodies (provider)
- Main image

- Experimental details
- Figure 3 The Phenotype of Anti-MLSN CAR-T Cells (A-H) Flow cytometry profile showing the (A and B) transduction efficiencies of CAR-T cells and the (C-H) percentage distribution of CD8 + , IFNgamma + CD8 + , and TNF-alpha + CD8 + targeting MSLN CAR-T cells. Representative results from one of six patients are shown. (A and B) The transduction efficiencies of CAR-T-1847 and CAR-T-1848 cells were significantly lower than that of CAR-T-2598 cells ( P < 0.001). (C-H) There were no significant differences in the percentages of CD8 + CAR-T, IFNgamma + CD8 + CAR-T, and TNFalpha + CD8 + CAR-T cells among all three groups ( P > 0.05).

- Submitted by
- Invitrogen Antibodies (provider)
- Main image

- Experimental details
- Figure 4 Expanded TILs recognize the GCT marker FOXL2. The human FOXL2 peptides library (91 peptides) was divided in 4 pools and used to assess TIL reactivity to FOXL2. A total of 1 x 10 5 of IL-2 rested TILs (post-REP) from individual culture was cocultured overnight with autologous PBMCs pulsed with FOXL2 peptides at a 1:1 ratio. T cell activation was assessed using IFN-gamma ELISA ( A and B ) and IFN-gamma intracellular staining (ICS) ( C ). ( A ) Bar chart shows IFN-gamma values from 2 representative patients with 2 responding fragments (2406 #1 and 2409 #9) and 2 unresponding fragments (2406 #6 and 2402 #15). ( B ) Chart shows the IFN-gamma values divided by pool ( n = 7 patients). A 150 pg/mL threshold was set to distinguish positive from negative values. ( C ) Representative FACS plots show IFN-gamma ICS of specimen 2406 #1. Bar graph summarizes the ICS values from specimen 2406 #1. Mean +- SD is shown.

- Submitted by
- Invitrogen Antibodies (provider)
- Main image

- Experimental details
- Figure 5 Whole blood secretory cytokine methodology, gating strategy, and quantification. Whole blood was collected from patients and 1 mL was aliquoted per stimulatory condition. Whole blood was stimulated for 24 h in the presence of PMA-ionomycin or IL-2/12. At 22 h post-stimulation, Golgiplug was added to whole blood and incubated for an additional 2 h. At 24 h post-stimulation, whole blood was incubated for 15 min with an extracellular staining mix. Lyse/fix buffer was then added and incubated for 10 min before blood was spun down. Cells were washed, resuspended in Perm III Buffer, and incubated on ice for 30 min before being spun down and resuspended in an intracellular staining mix. Cells were then incubated for an additional 30 min at 4degC prior to being resuspended and assessed by flow cytometry (A) . The lymphocyte population was gated on before excluding doublets and dead cells. CD45 + CD14 - CD56 Bright/Dim CD3 - cells were gated on to assess intracellular IFNgamma based on unstimulated controls. The percentage of CD56 Bright/Dim CD3 - cells expressing INFgamma after stimulation was assessed in healthy donors ( n = 11) and cancer patients ( n = 9) (B) . Shown are the median values +- IQR.

- Submitted by
- Invitrogen Antibodies (provider)
- Main image

- Experimental details
- Figure 6 Plasma collection methodology for secretory cytokine quantification by ELISA. After incubation in the absence of stimulation or with either PMA-ionomycin or IL-2/12 stimulation for 24 h, 600 muL of whole blood was collected and spun down prior to being collected and stored at -80degC for subsequent use in a human IFNgamma ELISA (A) . Extracellular IFNgamma was quantified in response to stimuli in healthy donors ( n = 13) and cancer patients ( n = 10) (B) . Shown are the median values +- IQR.

- Submitted by
- Invitrogen Antibodies (provider)
- Main image

- Experimental details
- Fig. 2 Bp-infected BALB/c mice develop Th17 T RM cells in the nose. Six-week-old C57BL/6 mice and BALB/c mice were infected with 10 6 CFU of B1917GR. Nasal immune cells were collected at indicated time points post challenge (D0-D28). Ten minutes before euthanasia, mice were intravenously injected with anti-CD45-PE antibody enabling us to discriminate T RM cells from circulating cells. T RM cells express CD44, CD69, and/or CD103. Cell activation was assessed by nonspecific ex vivo stimulation and intracellular staining of IL-17 and IFN-gamma. Cells were fixed and permeabilized to perform intracellular staining of IL-17 and IFN-gamma. Numbers indicate percentages of events in each square. a Representative graph showing the accumulation of CD103 + CD44 + T RM cells in the nose of BALB/c mice at indicated time points after Bp challenge. b Representative graph comparing the pattern of expression of CD44 (left panels) and CD103 (right panels) in the nose of C57BL/6 (black) and BALB/c mice (gray) at indicated time points after Bp challenge. Numbers indicate mean fluorescence intensities and dotted lines indicate the cut-off between positive and negative cells. c Representative graph showing the proportion of IL-17- and/or IFN-gamma-producing CD4 + T RM cells in the nose of C57BL/6 (left panels) and BALB/c mice (right panels) at indicated time points after Bp challenge. Numbers indicate percentages of events in each square.

- Submitted by
- Invitrogen Antibodies (provider)
- Main image

- Experimental details
- Figure 3 High Enrichment of CD39 Expression on Tumor-Infiltrating MAIT Cells (A) Left: CD39 expression shown by UMAP plot. Center: representative staining of CD39 expression on MAIT cells from PBMC, adjacent tissue, and tumor of CRC, gated on CD45 + live, DNA + , CD14 - CD16 - CD3 + T cells. Right: frequencies of CD39 + MAIT cells in different compartments. PBMC = 10, colon = 19, tumor = 24. Data are mean with SD from at least 7 experiments. Mann-Whitney U test. (B). Expression intensities of selected markers on CD39 + and CD39 - MAIT cells in 4 different tumors (left). The numbers are patient IDs. Also shown is analysis of selected markers expression between the CD39 + and CD39 - subset; n = 22 (right). Data are from at least 7 experiments. Two-tailed paired t test. (C) CD39 co-expression with PD-1 or CTLA-4 gated on total MAIT cells from one representative tumor sample. (D) Representative staining of CD39 and Ki-67 expression on tumor-infiltrating MAIT cells (left) and Ki67 expression on CD39 + and CD39 - tumor-infiltrating MAIT cells (right); n = 18. Data are from at least 3 experiments. Two-tailed paired t test. (E) Representative example of IFNgamma, TNF-alpha, IL-17, and CD39 expression on tumor-infiltrating MAIT cells upon 4 h of PMA/ionomycin stimulation (left) and polyfunctionality profile of CD39 + and CD39 - tumor-infiltrating MAIT cells (right); n = 8. Data are mean with SD from 2 experiments. Two-tailed paired t test. (F) Flow cytometry data of CD39 and IFNgamma

- Submitted by
- Invitrogen Antibodies (provider)
- Main image

- Experimental details
- Figure 4 TCR-Dependent MAIT Cell Activation Is Associated with Tumor Infiltration by Bacteria (A) Representative staining of CD39 expression plotted against tet-MR1 in CRC, NSCLC and RCC tumor samples, gated on total T cells (top panel). Frequencies of CD39 expression on total MAIT cells and CD39 + MAIT frequencies on total T cells (bottom panel). CRC = 24, NSCLC = 11, RCC = 9. Data are mean with SD from at least 10 experiments. Mann-Whitney U test. (B) Relative bacterial load (per sample) summed across all species in adjacent tissue versus corresponding CRC tumors. n = 61, two-tailed paired t test. (C) Ratio of of bacterial load in tumor versus tissue expressed in fold change(log10) versus p value expressed in -log10(q value). Bacterial species n = 1479. (D) Flow cytometry data of IFNgamma production by MAIT cells stimulated under different conditions ( STAR Methods ); n = 12-16. Data are mean with SD from 6 experiments. Two-tailed paired t test. See also Figures S4 and S5 .
