 Explore
 Validate
 Learn
Learn Western blot
Antibody data
- Antibody Data
- Antigen structure
- References [0]
- Comments [0]
- Validations
- Western blot [5]
- Immunocytochemistry [8]
- Flow cytometry [1]
- Other assay [23]
Submit
Validation data
Reference
Comment
Report error
- Product number
- 32-2600 - Provider product page

- Provider
- Invitrogen Antibodies
- Product name
- beta Tubulin Monoclonal Antibody (2 28 33)
- Antibody type
- Monoclonal
- Antigen
- Other
- Description
- This antibody reacts with the ~50 kDa beta-tubulin and has been shown to bind to the two major and one of the minor beta-tubulin isotypes. Reactivity has been confirmed with mouse NIH3T3 fibroblast cells, rat brain, and mouse testis.
- Reactivity
- Human, Mouse, Rat, Canine
- Host
- Mouse
- Isotype
- IgG
- Antibody clone number
- 2 28 33
- Vial size
- 100 µg
- Concentration
- 0.5 mg/mL
- Storage
- -20°C
No comments: Submit comment
Supportive validation
- Submitted by
- Invitrogen Antibodies (provider)
- Main image

- Experimental details
- Western blot analysis of Beta-Tubulin was performed by loading 20 µg of SH-SY5Y (lane1), U2OS (lane2), Raji (lane3), A549 (lane4), HEK-293 (lane5), HeLa (lane6), MCF7 (lane 7) and Jurkat (lane8) cell lysate using Novex® NuPAGE® 4-12 % Bis-Tris gel (Product # NP0321BOX), XCell SureLock Electrophoresis System (Product # EI0002), Novex® Sharp Pre-Stained Protein Standard (LC5800), and iBlot® Dry Blotting System (IB21001). Proteins were transferred to a nitrocellulose membrane and blocked with 5 % skim milk for 1 hour at room temperature. Beta-Tubulin was detected at ~50 kDa using Beta-Tubulin Mouse Monoclonal Antibody (Product # 32-2600) at 0.5-1 µg/mL in 2.5 % skim milk at 4°C overnight on a rocking platform. Goat Anti-Mouse IgG - HRP Secondary Antibody (Product # 62-6520) at 1:4000 dilution was used and chemiluminescent detection was performed using Pierce™ ECL Western Blotting Substrate (Product # 32106).

- Submitted by
- Invitrogen Antibodies (provider)
- Main image
- Experimental details
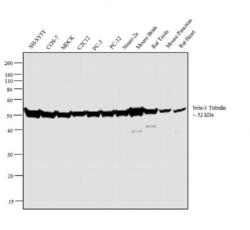
- Western blot analysis was performed on whole cell extracts (30µg lysate) of SH-SY5Y (Lane 1), COS-7 (Lane 2), MDCK (Lane 3), C2C12 (Lane 4), PC-3 (Lane 5), PC-12 (Lane 6), Neuro-2a (Lane 7) tissue extracts of Mouse Brain (Lane 8), Rat Testis (Lane 9), Mouse Pancreas (Lane 10) and Rat Heart (Lane 11). The blot was probed with Anti-beta-3 Tubulin Mouse Monoclonal Antibody (Product # 32-2600, 2µg/mL) and detected by chemiluminescence using Goat anti-Mouse IgG (H+L) Superclonal™ Secondary Antibody, HRP conjugate (Product # A28177, 0.25µg/mL, 1:4000 dilution). A 52 kDa band corresponding to beta-3 Tubulin was observed across the cell lines and tissues tested. Known quantity of protein samples were electrophoresed using Novex® NuPAGE® 4-12 % Bis-Tris gel (Product # NP0322BOX), XCell SureLock™ Electrophoresis System (Product # EI0002) and Novex® Sharp Pre-Stained Protein Standard (Product # LC5800). Resolved proteins were then transferred onto a nitrocellulose membrane with iBlot® 2 Dry Blotting System (Product # IB21001). The membrane was probed with the relevant primary and secondary Antibody following blocking with 5 % skimmed milk. Chemiluminescent detection was performed using Pierce™ ECL Western Blotting Substrate (Product # 32106).

- Submitted by
- Invitrogen Antibodies (provider)
- Main image

- Experimental details
- Western blot analysis of Beta-Tubulin was performed by loading 20 µg of SH-SY5Y (lane1), U2OS (lane2), Raji (lane3), A549 (lane4), HEK-293 (lane5), HeLa (lane6), MCF7 (lane 7) and Jurkat (lane8) cell lysate using Novex® NuPAGE® 4-12 % Bis-Tris gel (Product # NP0321BOX), XCell SureLock Electrophoresis System (Product # EI0002), Novex® Sharp Pre-Stained Protein Standard (LC5800), and iBlot® Dry Blotting System (IB21001). Proteins were transferred to a nitrocellulose membrane and blocked with 5 % skim milk for 1 hour at room temperature. Beta-Tubulin was detected at ~50 kDa using Beta-Tubulin Mouse Monoclonal Antibody (Product # 32-2600) at 0.5-1 µg/mL in 2.5 % skim milk at 4°C overnight on a rocking platform. Goat Anti-Mouse IgG - HRP Secondary Antibody (Product # 62-6520) at 1:4000 dilution was used and chemiluminescent detection was performed using Pierce™ ECL Western Blotting Substrate (Product # 32106).

- Submitted by
- Invitrogen Antibodies (provider)
- Main image

- Experimental details
- Western blot analysis was performed on whole cell extracts (30µg lysate) of SH-SY5Y (Lane 1), COS-7 (Lane 2), MDCK (Lane 3), C2C12 (Lane 4), PC-3 (Lane 5), PC-12 (Lane 6), Neuro-2a (Lane 7) tissue extracts of Mouse Brain (Lane 8), Rat Testis (Lane 9), Mouse Pancreas (Lane 10) and Rat Heart (Lane 11). The blot was probed with Anti-beta-3 Tubulin Mouse Monoclonal Antibody (Product # 32-2600, 2µg/mL) and detected by chemiluminescence using Goat anti-Mouse IgG (H+L) Superclonal™ Secondary Antibody, HRP conjugate (Product # A28177, 0.25µg/mL, 1:4000 dilution). A 52 kDa band corresponding to beta-3 Tubulin was observed across the cell lines and tissues tested. Known quantity of protein samples were electrophoresed using Novex® NuPAGE® 4-12 % Bis-Tris gel (Product # NP0322BOX), XCell SureLock™ Electrophoresis System (Product # EI0002) and Novex® Sharp Pre-Stained Protein Standard (Product # LC5800). Resolved proteins were then transferred onto a nitrocellulose membrane with iBlot® 2 Dry Blotting System (Product # IB21001). The membrane was probed with the relevant primary and secondary Antibody following blocking with 5 % skimmed milk. Chemiluminescent detection was performed using Pierce™ ECL Western Blotting Substrate (Product # 32106).

- Submitted by
- Invitrogen Antibodies (provider)
- Main image

- Experimental details
- Western blot analysis was performed on whole cell extracts (30µg lysate) of SH-SY5Y (Lane 1), COS-7 (Lane 2), MDCK (Lane 3), C2C12 (Lane 4), PC-3 (Lane 5), PC-12 (Lane 6), Neuro-2a (Lane 7) tissue extracts of Mouse Brain (Lane 8), Rat Testis (Lane 9), Mouse Pancreas (Lane 10) and Rat Heart (Lane 11). The blot was probed with Anti-beta-3 Tubulin Mouse Monoclonal Antibody (Product # 32-2600, 2µg/mL) and detected by chemiluminescence using Goat anti-Mouse IgG (H+L) Superclonal™ Secondary Antibody, HRP conjugate (Product # A28177, 0.25µg/mL, 1:4000 dilution). A 52 kDa band corresponding to beta-3 Tubulin was observed across the cell lines and tissues tested. Known quantity of protein samples were electrophoresed using Novex® NuPAGE® 4-12 % Bis-Tris gel (Product # NP0322BOX), XCell SureLock™ Electrophoresis System (Product # EI0002) and Novex® Sharp Pre-Stained Protein Standard (Product # LC5800). Resolved proteins were then transferred onto a nitrocellulose membrane with iBlot® 2 Dry Blotting System (Product # IB21001). The membrane was probed with the relevant primary and secondary Antibody following blocking with 5 % skimmed milk. Chemiluminescent detection was performed using Pierce™ ECL Western Blotting Substrate (Product # 32106).

Supportive validation
- Submitted by
- Invitrogen Antibodies (provider)
- Main image

- Experimental details
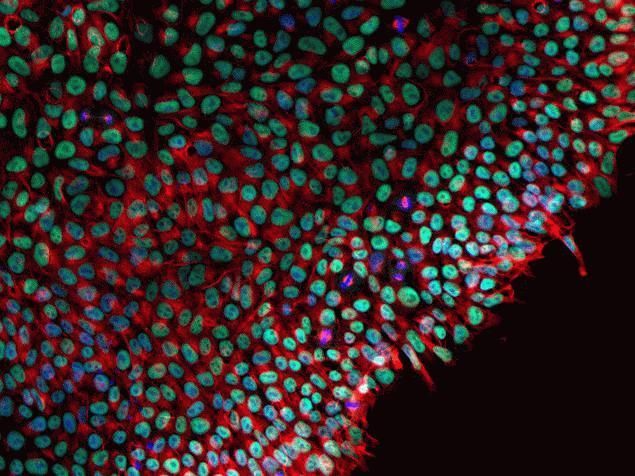
- Human iPSC Staining Human iPSCs were cultured on glass slides under feeder-free conditions in StemPro® hESC Medium (Product # A1000701). Cells were fixed and permed with the Image-iT® Fixation/Permeabilization Kit (Product # R37602). Oct4 (green) expression was visualized using anti-Oct4 primary Ab and Alexa Fluor® 488 secondary Ab (Product # A-11034). Tubulin (red) expression was visualized using anti-tubulin primary Ab (Product # 32-2600) and Alexa Fluor® 594 secondary Ab (Product # A-11005). Nuclei (blue) were labeled with NucBlue™ Fixed Cell Stain (Product # R37606). Images were collected on the FLoid™ Cell Imaging Station (Product # 4471136).
- Submitted by
- Invitrogen Antibodies (provider)
- Main image

- Experimental details
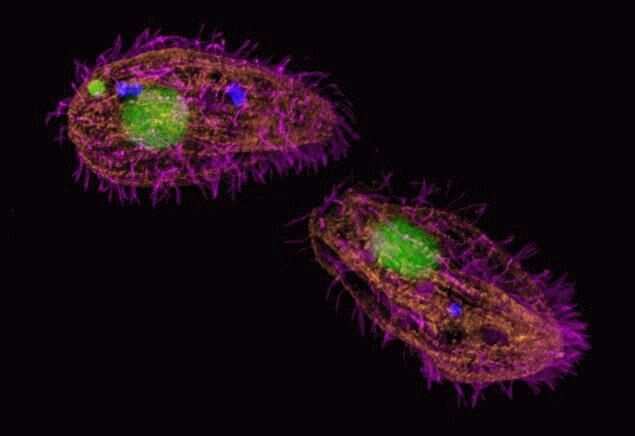
- Tetrahymena pyriformis were cultured with EdU (Product # A10044), Click-iT® GalNAz glycoprotein labeling reagent (Product # C33365), and InSpeck™ Blue (350/440) Intensity Calibration microspheres (I7221). Following fix/perm using Image-iT™ Fixation/Permeabilization kit (Product # R37602), EdU-incorporated DNA was labeled with Alexa Fluor® 488 azide (Product # A10266) and GalNAz-incorporated cellular components with Alexa Fluor® 555 alkyne (Product # A20013). Cilia were labeled with anti-beta-tubulin Ab (Product # 32-2600) and Alexa Fluor® 647 secondary Ab (Product # A-21236). Imaging followed mounting in SlowFade® Gold (S36937).

- Submitted by
- Invitrogen Antibodies (provider)
- Main image

- Experimental details
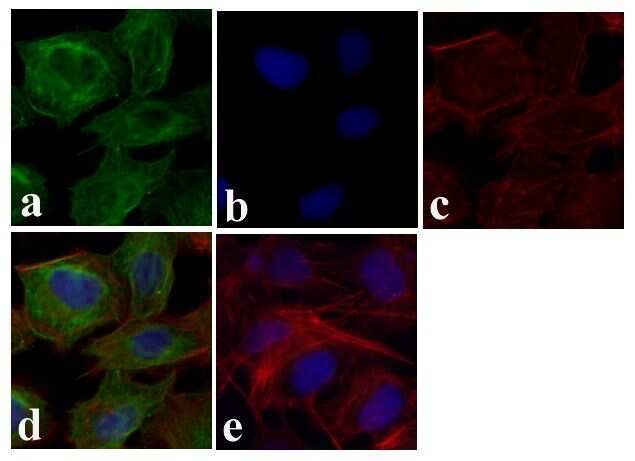
- Immunofluorescent analysis of Beta - Tubulin was done on 70% confluent log phase U-2 OS cells. The cells were fixed with 4% paraformaldehyde for 15 minutes, permeabilized with 0.25% Triton X-100 for 10 minutes, and blocked with 5% BSA for 1 hour at room temperature. The cells were labeled with Beta - Tubulin Mouse Monoclonal Antibody (Product # 32-2600) at 0.5 µg/mL in 1% BSA and incubated for 3 hours at room temperature and then labeled with Alexa Fluor 488 Rabbit Anti-Mouse IgG Secondary Antibody (Product # A-11059) at a dilution of 1:400 for 30 minutes at room temperature (Panel a: green). Nuclei (Panel b: blue) were stained with SlowFade® Gold Antifade Mountant with DAPI (Product # S36938). F-actin (Panel c: red) was stained with Alexa Fluor 594 Phalloidin (Product # A12381). Panel d is a merged image showing cytoplasmic localization. Panel e shows no primary antibody control. The images were captured at 20X magnification.
- Submitted by
- Invitrogen Antibodies (provider)
- Main image

- Experimental details
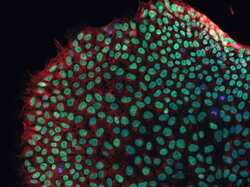
- Human iPSCs were cultured on glass slides under feeder-free conditions in StemPro® hESC Medium (Product # A1000701). Cells were fixed and permed with the Image-iT® Fixation/Permeabilization Kit (Product # R37602). Oct4 (green) expression was visualized using anti-Oct4 primary Ab and Alexa Fluor® 488 secondary Ab (Product # A-11034). Tubulin (red) expression was visualized using anti-tubulin primary Ab (Product # 32-2600) and Alexa Fluor® 594 secondary Ab (Product # A-11005). Nuclei (blue) were labeled with NucBlue Fixed Cell Stain (Product # R37606). Images were collected on the FLoid Cell Imaging Station (Product # 4471136).

- Submitted by
- Invitrogen Antibodies (provider)
- Main image
- Experimental details
- Human iPSC Staining Human iPSCs were cultured on glass slides under feeder-free conditions in StemPro® hESC Medium (Product # A1000701). Cells were fixed and permed with the Image-iT® Fixation/Permeabilization Kit (Product # R37602). Oct4 (green) expression was visualized using anti-Oct4 primary Ab and Alexa Fluor® 488 secondary Ab (Product # A-11034). Tubulin (red) expression was visualized using anti-tubulin primary Ab (Product # 32-2600) and Alexa Fluor® 594 secondary Ab (Product # A-11005). Nuclei (blue) were labeled with NucBlue Fixed Cell Stain (Product # R37606). Images were collected on the FLoid Cell Imaging Station (Product # 4471136).

- Submitted by
- Invitrogen Antibodies (provider)
- Main image

- Experimental details
- Tetrahymena pyriformis were cultured with EdU (Product # A10044), Click-iT® GalNAz glycoprotein labeling reagent (Product # C33365), and InSpeck Blue (350/440) Intensity Calibration microspheres (I7221). Following fix/perm using Image-iT Fixation/Permeabilization kit (Product # R37602), EdU-incorporated DNA was labeled with Alexa Fluor® 488 azide (Product # A10266) and GalNAz-incorporated cellular components with Alexa Fluor® 555 alkyne (Product # A20013). Cilia were labeled with anti-beta-tubulin Ab (Product # 32-2600) and Alexa Fluor® 647 secondary Ab (Product # A-21236). Imaging followed mounting in SlowFade® Gold (S36937).
- Submitted by
- Invitrogen Antibodies (provider)
- Main image

- Experimental details
- Visualizing a rat cortical neuron culture. Cryopreserved Gibco™ Primary Mouse Cortical Neurons (Product # A15585) were grown in culture for 3 weeks using the Gibco™ B-27™ Plus Neuronal Culture System (Product # A3653401). Cells were fixed and labeled with Invitrogen™ NucBlue™ Fixed Cell ReadyProbes™ Reagent (Product # R37606), anti-β-3 tubulin mouse monoclonal antibody (Product # 32-2600) in conjunction with Invitrogen™ Alexa Fluor™ 488 goat anti-mouse IgG antibody (Product # A-11029), and Invitrogen™ ActinRed™ 555 ReadyProbes™ Reagent (Product # R37112). Cells were mounted in Invitrogen™ ProLong™ Glass Antifade Mountant (Product # P36980) and imaged on an Invitrogen™ EVOS™ FL Auto 2 Imaging System using a 60x oil-immersion objective.

Supportive validation
- Submitted by
- Invitrogen Antibodies (provider)
- Main image

- Experimental details
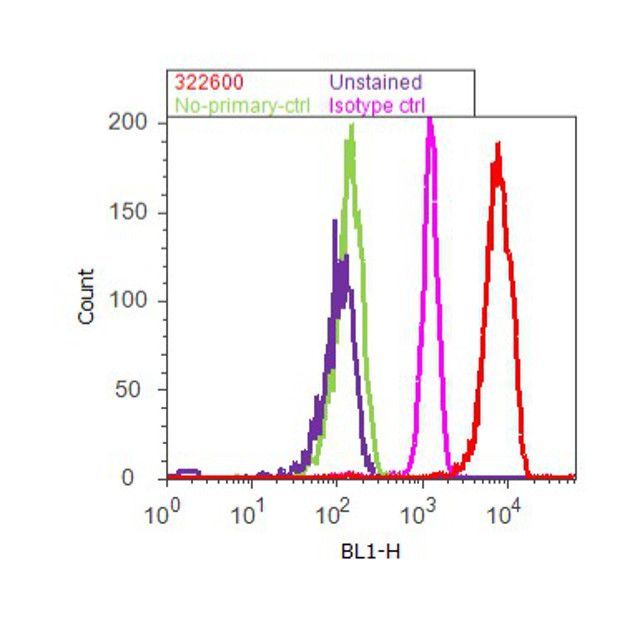
- Flow cytometry analysis of Beta-tubulin was done on HeLa cells. Cells were fixed with 70% ethanol for 10 minutes, permeabilized with 0.25% Tritonª X-100 for 20 minutes, and blocked with 5% BSA for 1 hour at room temperature. Cells were labeled with Beta-tubulin Mouse Monoclonal Antibody (322600, red histogram) or with mouse isotype control (pink histogram) at 1-3 µg/million cells in 2.5% BSA. After incubation at room temperature for 2-3 hours, the cells were labeled with Alexa Fluor¨ 488 Rabbit Anti-Mouse Secondary Antibody (A11059) at a dilution of 1:400 for 30 minutes at room temperature. The representative 10,000 cells were acquired and analyzed for each sample using an Attune¨ Acoustic Focusing Cytometer. The purple histogram represents unstained control cells and the green histogram represents no-primary-antibody control.
Supportive validation
- Submitted by
- Invitrogen Antibodies (provider)
- Main image

- Experimental details
- NULL

- Submitted by
- Invitrogen Antibodies (provider)
- Main image

- Experimental details
- NULL

- Submitted by
- Invitrogen Antibodies (provider)
- Main image

- Experimental details
- NULL

- Submitted by
- Invitrogen Antibodies (provider)
- Main image

- Experimental details
- NULL

- Submitted by
- Invitrogen Antibodies (provider)
- Main image

- Experimental details
- NULL
- Submitted by
- Invitrogen Antibodies (provider)
- Main image
- Experimental details
- NULL
- Submitted by
- Invitrogen Antibodies (provider)
- Main image

- Experimental details
- NULL
- Submitted by
- Invitrogen Antibodies (provider)
- Main image

- Experimental details
- NULL

- Submitted by
- Invitrogen Antibodies (provider)
- Main image
- Experimental details
- NULL

- Submitted by
- Invitrogen Antibodies (provider)
- Main image

- Experimental details
- NULL

- Submitted by
- Invitrogen Antibodies (provider)
- Main image

- Experimental details
- NULL

- Submitted by
- Invitrogen Antibodies (provider)
- Main image

- Experimental details
- Figure 1. Glucose deficiency induces eIF2alpha phosphorylation in human tumors. HT1080 cells (A) and A549 cells (B) were maintained in media containing glucose (Con; A, B), media lacking glucose (-Gluc; A) or in media containing glucose supplemented with 50 mM 2-deoxyglucose (2-DG; B) for the indicated times. (A and B) Whole cell extract (50 mug of protein) was used for immunoblot analysis with anti-eIF2alpha-pSer51 antibody (a), anti-eIF2alpha antibody (b), anti-BiP/GRP78 antibody (c), anti-tubulin antibody (Ad) or anti-actin antibody (Bd). The ratio of phosphorylated to total protein of eIF2alpha is indicated (a/b). Quantification of protein bands was performed by densitometry using Scion Image from NIH. The data represent one of three reproducible experiments. The ratio was set to 1 for each time point control (untreated).

- Submitted by
- Invitrogen Antibodies (provider)
- Main image
- Experimental details
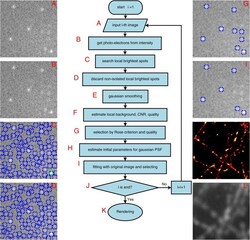
- Figure 1 SNSMIL Work Flow. Schematic diagram of SNSMIL work flow ( A - J ), super-resolution image ( K ), and TIRF image ( L ) of tubulin fibers obtained from fixed HL-1 cells immunohistochemically stained with anti-beta-tubulin primary and Alexa647 labeled secondary antibodies.

- Submitted by
- Invitrogen Antibodies (provider)
- Main image

- Experimental details
- Figure 3 d STORM imaging of beta-tubulin immunostaining in a HL-1 cell. ( a ) TIRF image. ( b ) Super-resolution images reconstructed by using Auto-Bayes with the WLDM from a sequence of 4000 single molecules images. ( c ) Distribution of n psf (blue) with using a logarithmic scale and Auto-Bayes automated threshold analysis using the WLDM (red solid curves). The n psf threshold (red solid vertical line) is 101.5 and 82959 single molecules were found. ( d ) Line profiles of a tubulin structure (marked by the yellow boxes in ( a , b )); projection on the solid yellow line in ( a , b ). Scale bars are 2 mum.

- Submitted by
- Invitrogen Antibodies (provider)
- Main image

- Experimental details
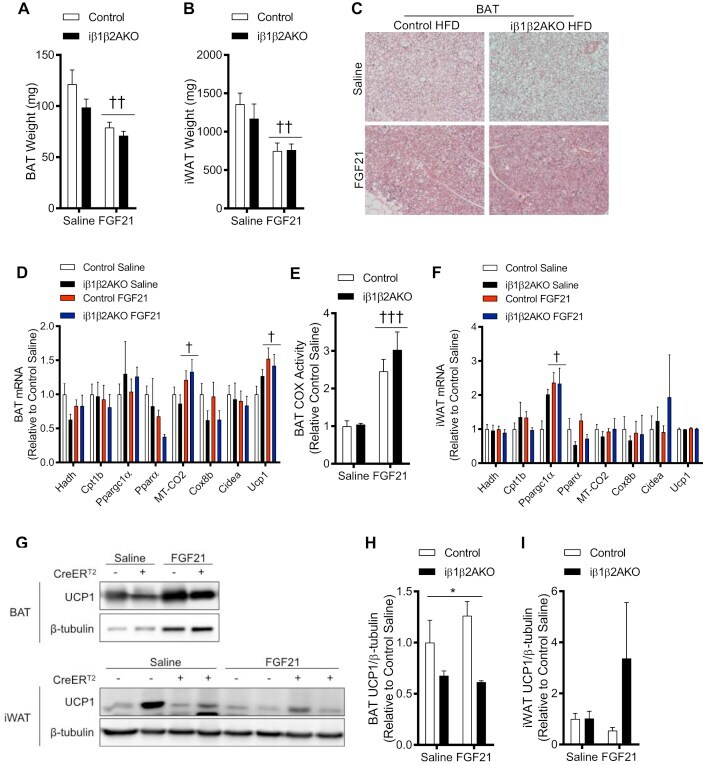
- Figure 5 The beneficial effects of native FGF21 in control and ibeta1beta2AKO mice are not driven by the upregulation of a thermogenic program in vivo . A and B: tissue weights of BAT ( A ) and iWAT ( B ) of control and ibeta1beta2AKO mice treated with saline or native FGF21 for 14 days (n = 4-7 per group). ( C ) representative H&E stains (10x) of BAT from control and ibeta1beta2AKO mice fed a high fat diet (45%) for 10 weeks and treated with saline or native FGF21 for 14 days. D and E: mRNA expression of mitochondrial and browning markers (Hadh, MT-CO2, Cox8b, Cpt1b, Ppargc1alpha, Pparalpha, Cidea, Ucp1) in BAT ( D ) and iWAT ( F ) (n = 4-7 per group). ( E ) mitochondrial COX activity in whole tissue BAT lysates from control and ibeta1beta2AKO mice treated with FGF21 (n = 4-7 per group). G-H: representative UCP1 and beta-tubulin immunoblotting ( G ) with quantification in BAT ( H ) and iWAT ( I ) of high fat diet-fed and two week treated (saline or native FGF21) control and ibeta1beta2AKO mice (n = 4-7 per group). Data are means +- SEM with +++ p < 0.001, ++ p < 0.01, + p < 0.05 denoting a general treatment effect and * p < 0.05 denoting a general genotype effect as determined by a two-way ANOVA. Figure 5
- Submitted by
- Invitrogen Antibodies (provider)
- Main image

- Experimental details
- Figure 2 Detection of cellular DNA damage induced by H 2 O 2 and bleomycin treatments in the human HeLa cell line. ( A ) Relative gamma-H2AX protein levels after cell exposure to 50, 100, 150 and 250 uM of H 2 O 2 for 6 h and 12 h (estimated in relation to untreated cells in the beginning of the experiment (0 h)). ( B ) Relative gamma-H2AX protein levels after cell exposure to 2, 10 and 50 µg/mL of bleomycin for 24 h and 48 h (estimated in relation to untreated cells (0 µg/mL) at each timepoint). ( C ) Relative gamma-H2AX protein levels after cell exposure to 50 and 200 µg/mL of bleomycin for 30 min (T), followed by 45 min, 3 h and 6 h of recovery (R) (estimated in relation to untreated cells (0 µg/mL) at each timepoint). In all treatments, HeLa cells' whole lysates were analyzed by immunoblotting using a specific antibody against gamma-H2AX to measure DNA damage levels. A representative blot is shown for each treatment. Quantitative data are presented as mean +- SEM ( n = 3 ( A , B ) or n = 4 ( C )). Before determining relative gamma-H2AX protein levels, data normalization was performed using beta-tubulin immunoblotting ( A ) or Ponceau S staining ( B , C ) as protein loading control. * p < 0.05, ** p < 0.01 and *** p < 0.001 for comparisons between control and treatment conditions using the Kruskal-Wallis test followed by the Dunn's multiple comparison test. gamma-H2AX, histone variant H2AX phosphorylated at Ser139; H 2 O 2 , hydrogen peroxide; SEM,

- Submitted by
- Invitrogen Antibodies (provider)
- Main image

- Experimental details
- Fig. 4 FASN is required for viral replication and regulated by NS1. a Interactions between NS1 protein and FASN were examined by endogenous immunoprecipitation (IP)-western. Three biological replicates were performed, and a representative experiment is shown. b The gene expression level and protein expression level of FASN was examined post-NS1 overexpression in 293T cells ( N = 4 biologically independent samples). c The effect of FASN on viral replication was examined using shRNA knock-down (KD) in A549 cells. The expression level of FASN upon KD was examined by western blot (upper panel). Control cells or KD cells were infected with WT WSN at MOI 0.1. The viral titer in supernatant were determined using TCID50 assays ( N = 3 biologically independent samples). d The effect of FASN on viral replication in A549 cells was examined using FASN inhibitors, including C75, Fasnall and GSK2195069. Indicated concentrations of inhibitors were used at the time of infection. The effect of inhibitor treatment on viral replication at 24-h post infection was examined by TCID50 assay ( N = 3 biologically independent samples). e The levels of newly synthesized fatty acids or cholesterol upon expression of indicated viral proteins were examined by GC/MS. Ctl is transfection with GFP-expressing vector ( N = 4 biologically independent samples). f Interactions between WT and mutant (R38A/K41A) NS1 protein with FASN were examined by Co-immunoprecipitation assay, using Strep-tagged NS1 and FLAG-tag

- Submitted by
- Invitrogen Antibodies (provider)
- Main image

- Experimental details
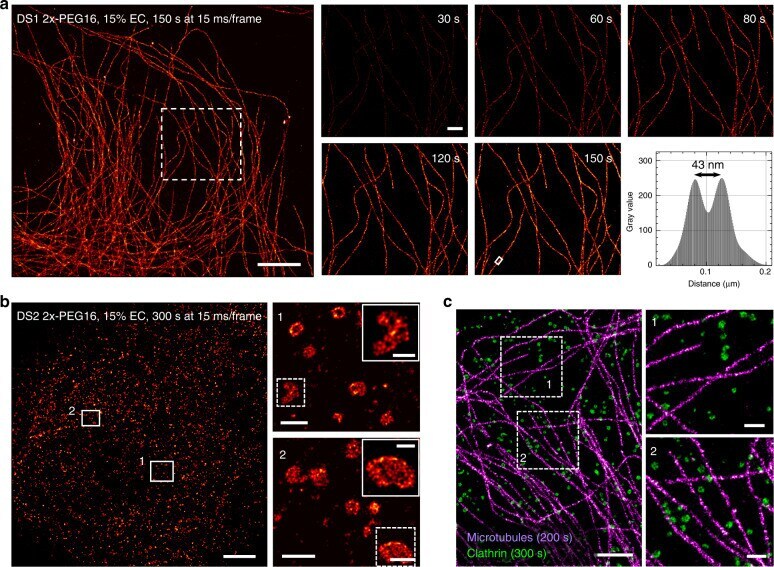
- Fig. 3 Fast superresolution imaging with DNA-PAINT-ERS using multiple DS-IS pairs. a DNA-PAINT-ERS imaging of microtubules in U2OS cells using the DS1-2x-PEG16 construct paired with IS1-CF660R. Left panel shows the reconstructed superresolution image of the whole FOV, with zoom-in-views at different acquisition times shown on the right. Bottom right plot shows the intensity profile of the structure in the boxed area in the reconstructed image at 150 s. Similar results were obtained from at least six FOVs in two independent experiments. b DNA-PAINT-ERS imaging of clathrin in U2OS cells using the DS2-2x-PEG16 construct paired with IS2-CF660R. Left panel shows the reconstructed image of the whole FOV, and the right panels are the zoom-in views of the boxed areas in the image on the left. Insets in the two images on the right are the zoom-in views of the regions in the dashed boxes. Similar results were obtained from at least four FOVs in two independent experiments. c Two-color imaging of microtubules (purple) and clathrin (green) in U2OS cells with DNA-PAINT-ERS, using the same DS1-IS1 (tubulin) and DS2-IS2 (clathrin) constructs as used in ( a ) and ( b ). The left panel shows a ~10 x 15 um 2 FOV, and the right panels are the zoom-in views of the two regions in the dashed boxes. Similar results were obtained from six FOVs in two independent experiments. Scale bars: 5 um ( a , left), 500 nm ( a , right), 5 um ( b , left), 500 nm ( b , right), 200 nm ( b , right insets), 2 um ( c
- Submitted by
- Invitrogen Antibodies (provider)
- Main image

- Experimental details
- Figure 4 Capacitation and the AR in spermatozoa from HFD-fed mice. Comparison between HFD-fed and chow-diet (control) mice. (a) Total sperm count in cauda epididymis, graph represents the mean +- s.d., n = 4. No significant differences were observed. (b) Representative images of acrosomal ultrastructure in HFD-fed and chow-fed mice. The images depict the acrosome (A), sub-acrosomal compartment (SC), nucleus (N), and plasma membrane (PL). (c) Representative images of the time-dependent pattern of tyrosine phosphorylation; beta-tubulin was used as a loading control, n = 3. (d) Quantification of AR; spermatozoa from each group were incubated in CM. The time-dependent percentage of spontaneous AR (SP-AR) and AR induced by 40 mumol l -1 of progesterone (P4-AR) was evaluated with the Coomassie blue dye technique. As a control, the maximum AR response was evaluated in the presence of 10 mumol l -1 A23187, a calcium ionophore. All graphs represent the mean +- s.d., n = 4. SP-AR and P4-AR were analyzed with an unpaired t -test: * P < 0.05, ** P < 0.01, *** P < 0.001. (e) SP-AR and P4-AR and the rate of ARPC were measured with the Coomassie blue dye technique, after incubating the spermatozoa in CM with 10 mg ml -1 or 30 mg ml -1 bovine serum albumin as a cholesterol scavenger. All graphs represent the mean +- s.d., n = 4. Data were statistically analyzed with an unpaired t -test: * P < 0.05, ** P < 0.01. s.d. : standard deviation; AR: acrosomal reaction; HFD: high-fat diet; CM: capaci

- Submitted by
- Invitrogen Antibodies (provider)
- Main image

- Experimental details
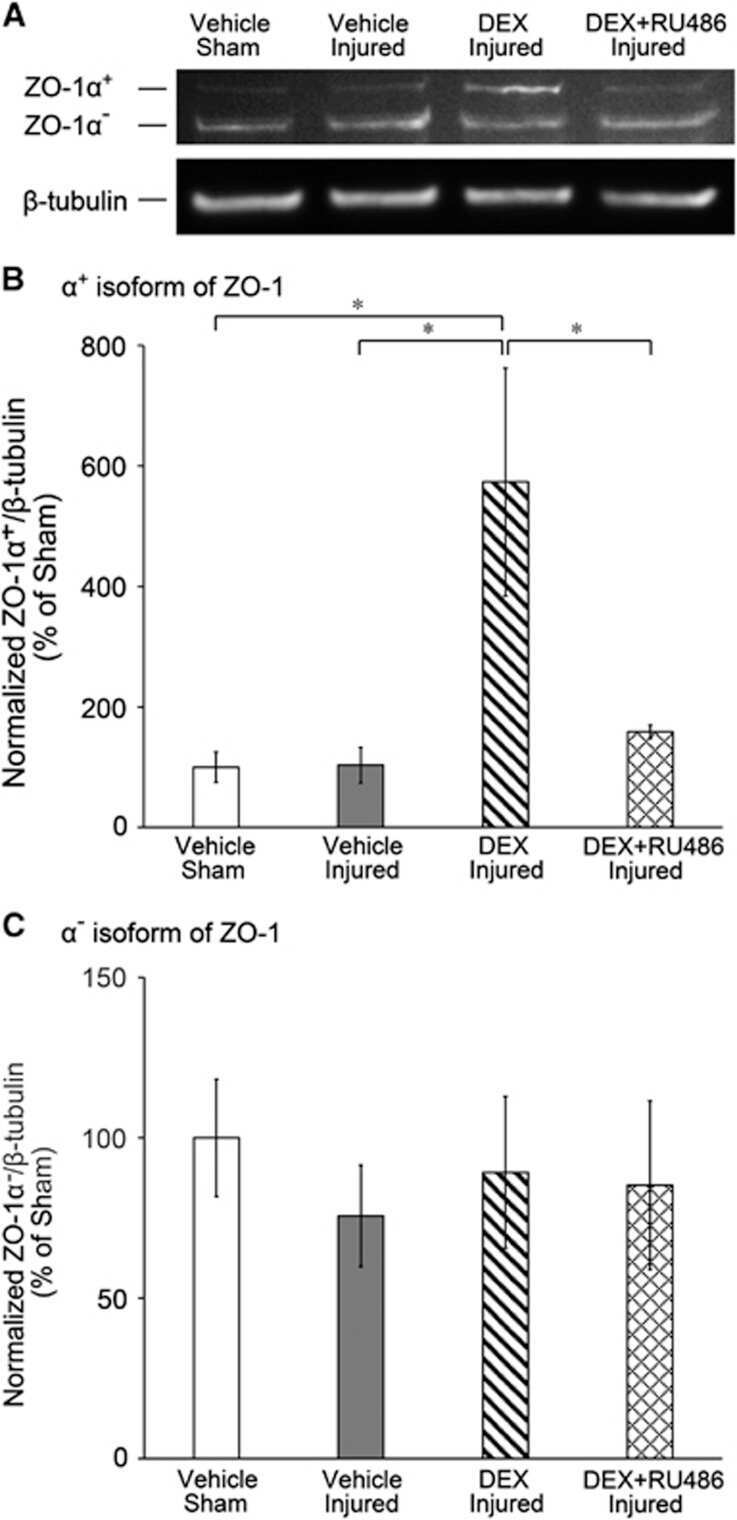
- Figure 2. The rat monoclonal R40.76 and the rabbit polyclonal R3 bind to the alpha and ZU5 domains of ZO-1, respectively. (a). Schematic diagrams of mouse and human ZO-1 constructs expressed in HEK cells, used for the mapping of antibody epitopes. The N-terminal tags, either GFP or myc, the amino-acid residues of ZO-1 included in each construct, and the presence or absence of the alpha domain (alpha+) or (alpha-) are indicated. (b). Antibody R40.76 binds to the alpha domain. Immunoblotting analysis of HEK cell lysates expressing the mouse ZO-1 constructs. FL, N-term and C-term constructs, the presence (+) or absence (-) of the alpha domain, and amino-acid residues of each construct are indicated on top. Numbers on the left indicate the migration of pre-stained molecular weight markers (kDa). Antibodies used for IB are indicated on the right. Antibodies against beta-tubulin were used to normalize lysates. (c). Antibody R3 binds to the ZU5 domain. Immunoblotting analysis of HEK cell lysates expressing the human FL, DeltaZU5, and ZU5 constructs, using antibodies against ZO-1 (R3) and GFP and myc tags. (d). Schematic diagram summarizing experimentally determined the reactivity of antibodies against indicated regions/constructs of mouse ZO-1 (green lines above the scheme), and position of antigens (black lines below the scheme)

- Submitted by
- Invitrogen Antibodies (provider)
- Main image
- Experimental details
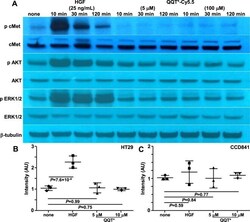
- Figure 4 Peptide effect on cell signaling and growth. (A ) HGF (25 ng/mL) induces phosphorylation of cMet and downstream AKT and Erk1/2 in HT29 cells after 10, 30 and 120 min of incubation from Western blot. No HGF (none) serves as a negative control. Incubation with QQT*-Cy5.5 at either 5 or 100 muM shows no effect on p-cMet expression or downstream AKT and Erk1/2 signaling. beta-tubulin is used as a loading control. This group of bands is cropped from different parts of the same gel. The original uncropped blots are displayed in Fig. S6D-H . An alamar blue assay shows increased growth of ( B ) HT29 but not ( C ) CCD841 cells with addition of HGF after 48 hours. No change is seen with either 5 or 100 muM of QQT*-Cy5.5. An ANOVA model with terms for 4 groups is fit to log-transformed data with 3 independent experiments.

- Submitted by
- Invitrogen Antibodies (provider)
- Main image
- Experimental details
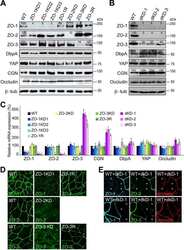
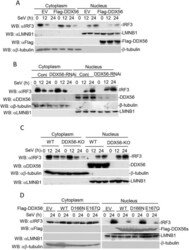
- Fig. 6. DDX56 inhibits the nuclear translocation of IRF3. (A) Overexpression of DDX56 inhibits nuclear translocation of IRF3. Stably transfected DDX56 293T cells (5x10 7 ) were left untreated or treated with SeV for the indicated time. Cell fractionation was performed, and the cytoplasmic and nuclear proteins were prepared in 1 mL of homogenization buffer or nuclear extraction buffer, respectively, followed by co-immunoprecipitation and immunoblotting (WB) analysis. (B) Effects of DDX56 knockdown on IRF3 nuclear translocation. The DDX56-RNAi stable cells (5x10 7 ) were left untreated or treated with SeV for the indicated time points. Experiments were performed similar to those in A. (C) DDX56 deficiency increases nuclear translocation of IRF3 in HeLa cells. Experiments were performed in a similar manner to those in A. (D) Effects of DDX56D166N and DDX56E167Q on the nuclear translocation of IRF3. Experiments were performed in a similar manner to those in A. EV, empty vector; WT, wild type; Coni, control siRNA.

- Submitted by
- Invitrogen Antibodies (provider)
- Main image

- Experimental details
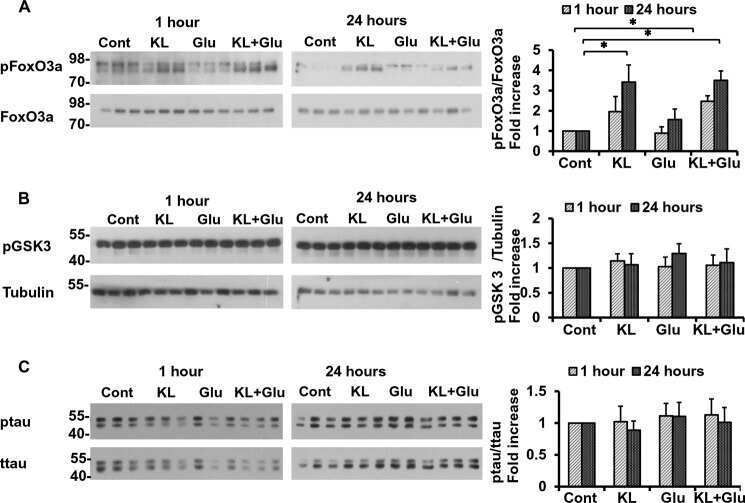
- Figure 6 Effect of AS605240 on amyloid beta precursor protein (APP) production in ICV-STZ-induced rat brain homogenates. APP protein levels in rat brain extracts were determined by immunoblot analysis (A) and quantified by image analysis (B). Equal loading of proteins was illustrated by beta-tubulin bands. Values are expressed as means +- S.E.M. (n=12). # p < 0.001 when compared with control group and * p < 0.05, ** p < 0.01 and *** p < 0,001, respectively when compared with STZ alone treated group. APP: Amyloid beta precursor protein, STZ: Streptozotocin
