Explore
 Validate
 Learn
Learn Flow cytometry
Antibody data
- Antibody Data
- Antigen structure
- References [15]
- Comments [0]
- Validations
- Flow cytometry [1]
- Other assay [11]
Submit
Validation data
Reference
Comment
Report error
- Product number
- 25-9858-80 - Provider product page

- Provider
- Invitrogen Antibodies
- Product name
- IRF4 Monoclonal Antibody (3E4), PE-Cyanine7, eBioscience™
- Antibody type
- Monoclonal
- Antigen
- Other
- Description
- Description: The monoclonal antibody 3E4 reacts with human and mouse interferon regulatory factor 4 (IRF4). IRF4 is a 52 kDa transcription factor with roles in B cell, T cell and macrophage function. In B cells, IRF4 is highly expressed in mature plasma cells and plays a crucial role in their differentiation. IRF4 has been shown to interact with PU.1 and control the transcription of many B cell-specific genes including Prdm1, which encodes Blimp1. In T cells, IRF4 has been implicated in regulatory T (Treg), Th2, Th9 and Th17 cell development and function. This transcription factor is upregulated upon T cell activation and is expressed in mature T cells. Studies have shown that IRF4 directly induces Blimp1 expression in Tregs, leading to IL-10 expression. IRF4 has also been demonstrated to be involved in macrophage polarization and regulation. Lastly, in addition to its roles in normal immune function, IRF4 expression has been reported to be upregulated in many blood-related cancers. Applications Reported: This 3E4 antibody has been reported for use in intracellular staining followed by flow cytometric analysis. Applications Tested: This 3E4 antibody has been tested by intracellular staining and flow cytometric analysis of stimulated normal human peripheral blood cells using the Foxp3/Transcription Factor Buffer Set (Product # 00-5523-00) and protocol. Please see Best Protocols Section (Staining Intracellular Antigens for Flow Cytometry) for staining protocol (refer to Protocol B: One-step protocol for intracellular (nuclear) proteins). This can be used at less than or equal to 0.25 µg per test. A test is defined as the amount (µg) of antibody that will stain a cell sample in a final volume of 100 µL. Cell number should be determined empirically but can range from 10^5 to 10^8 cells/test. It is recommended that the antibody be carefully titrated for optimal performance in the assay of interest. Light sensitivity: This tandem dye is sensitive to photo-induced oxidation. Please protect this vial and stained samples from light. Fixation: Samples can be stored in IC Fixation Buffer (Product # 00-822-49) (100 µL of cell sample + 100 µL of IC Fixation Buffer) or 1-step Fix/Lyse Solution (Product # 00-5333-54) for up to 3 days in the dark at 4°C with minimal impact on brightness and FRET efficiency/compensation. Some generalizations regarding fluorophore performance after fixation can be made, but clone specific performance should be determined empirically. Excitation: 488-561 nm; Emission: 775 nm; Laser: Blue Laser, Green Laser, Yellow-Green Laser. Filtration: 0.2 µm post-manufacturing filtered.
- Reactivity
- Human, Mouse
- Host
- Rat
- Isotype
- IgG
- Antibody clone number
- 3E4
- Vial size
- 25 µg
- Concentration
- 0.2 mg/mL
- Storage
- 4° C, store in dark, DO NOT FREEZE!
Submitted references Low-dose Ad26.COV2.S protection against SARS-CoV-2 challenge in rhesus macaques.
Expansion of tumor-associated Treg cells upon disruption of a CTLA-4-dependent feedback loop.
B cells promote CD8 T cell primary and memory responses to subunit vaccines.
Programming Multifaceted Pulmonary T Cell Immunity by Combination Adjuvants.
Genetic timestamping of plasma cells in vivo reveals tissue-specific homeostatic population turnover.
Transplantation tolerance modifies donor-specific B cell fate to suppress de novo alloreactive B cells.
Mitochondrial Oxidative Phosphorylation Regulates the Fate Decision between Pathogenic Th17 and Regulatory T Cells.
Ufbp1 promotes plasma cell development and ER expansion by modulating distinct branches of UPR.
ROCK2, but not ROCK1 interacts with phosphorylated STAT3 and co-occupies TH17/TFH gene promoters in TH17-activated human T cells.
RANKL-mediated harmonious dialogue between fetus and mother guarantees smooth gestation by inducing decidual M2 macrophage polarization.
Batf3 selectively determines acquisition of CD8(+) dendritic cell phenotype and function.
Affinity and dose of TCR engagement yield proportional enhancer and gene activity in CD4+ T cells.
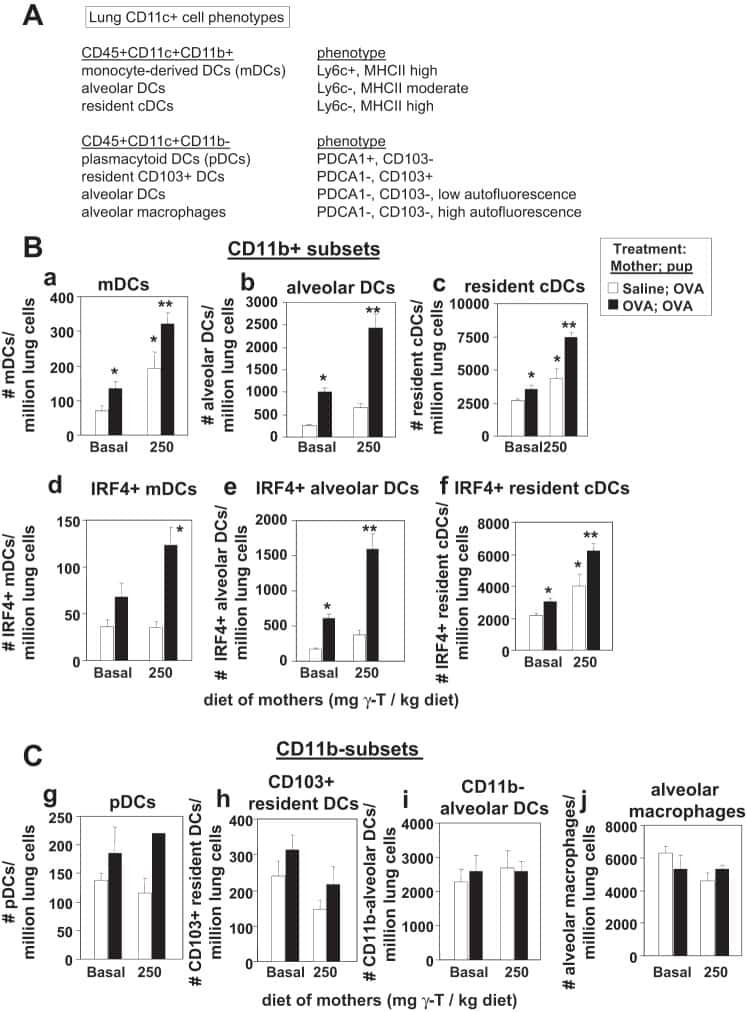
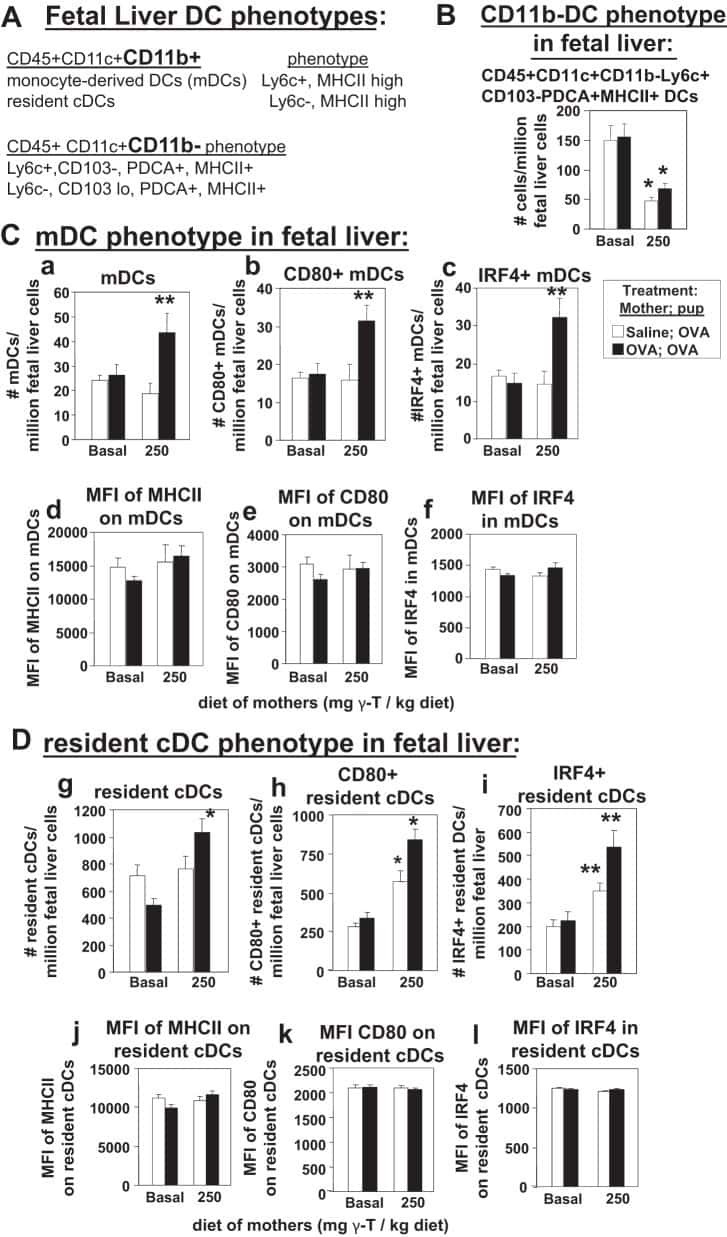
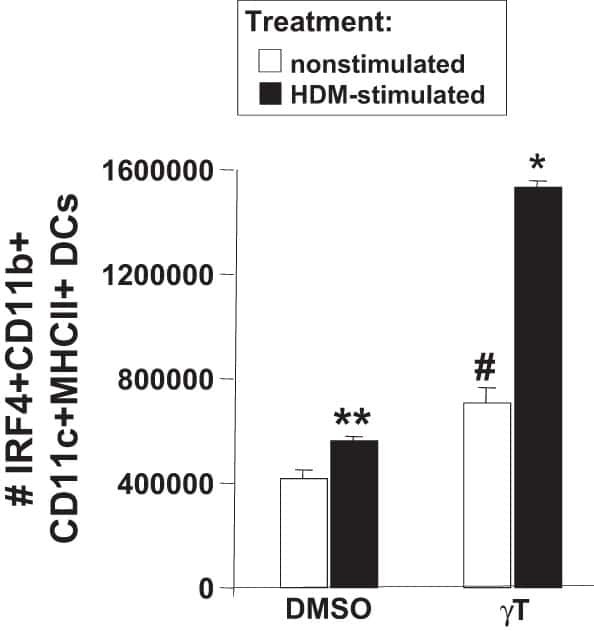
γ-Tocopherol supplementation of allergic female mice augments development of CD11c+CD11b+ dendritic cells in utero and allergic inflammation in neonates.
Cell-intrinsic expression of TLR9 in autoreactive B cells constrains BCR/TLR7-dependent responses.
Beta-catenin signaling drives differentiation and proinflammatory function of IRF8-dependent dendritic cells.
He X, Chandrashekar A, Zahn R, Wegmann F, Yu J, Mercado NB, McMahan K, Martinot AJ, Piedra-Mora C, Beecy S, Ducat S, Chamanza R, Huber SR, van Heerden M, van der Fits L, Borducchi EN, Lifton M, Liu J, Nampanya F, Patel S, Peter L, Tostanoski LH, Pessaint L, Van Ry A, Finneyfrock B, Velasco J, Teow E, Brown R, Cook A, Andersen H, Lewis MG, Schuitemaker H, Barouch DH
Cell 2021 Jun 24;184(13):3467-3473.e11
Cell 2021 Jun 24;184(13):3467-3473.e11
Expansion of tumor-associated Treg cells upon disruption of a CTLA-4-dependent feedback loop.
Marangoni F, Zhakyp A, Corsini M, Geels SN, Carrizosa E, Thelen M, Mani V, Prüßmann JN, Warner RD, Ozga AJ, Di Pilato M, Othy S, Mempel TR
Cell 2021 Jul 22;184(15):3998-4015.e19
Cell 2021 Jul 22;184(15):3998-4015.e19
B cells promote CD8 T cell primary and memory responses to subunit vaccines.
Klarquist J, Cross EW, Thompson SB, Willett B, Aldridge DL, Caffrey-Carr AK, Xu Z, Hunter CA, Getahun A, Kedl RM
Cell reports 2021 Aug 24;36(8):109591
Cell reports 2021 Aug 24;36(8):109591
Programming Multifaceted Pulmonary T Cell Immunity by Combination Adjuvants.
Marinaik CB, Kingstad-Bakke B, Lee W, Hatta M, Sonsalla M, Larsen A, Neldner B, Gasper DJ, Kedl RM, Kawaoka Y, Suresh M
Cell reports. Medicine 2020 Sep 22;1(6):100095
Cell reports. Medicine 2020 Sep 22;1(6):100095
Genetic timestamping of plasma cells in vivo reveals tissue-specific homeostatic population turnover.
Xu AQ, Barbosa RR, Calado DP
eLife 2020 Nov 2;9
eLife 2020 Nov 2;9
Transplantation tolerance modifies donor-specific B cell fate to suppress de novo alloreactive B cells.
Khiew SH, Jain D, Chen J, Yang J, Yin D, Young JS, Dent A, Sciammas R, Alegre ML, Chong AS
The Journal of clinical investigation 2020 Jul 1;130(7):3453-3466
The Journal of clinical investigation 2020 Jul 1;130(7):3453-3466
Mitochondrial Oxidative Phosphorylation Regulates the Fate Decision between Pathogenic Th17 and Regulatory T Cells.
Shin B, Benavides GA, Geng J, Koralov SB, Hu H, Darley-Usmar VM, Harrington LE
Cell reports 2020 Feb 11;30(6):1898-1909.e4
Cell reports 2020 Feb 11;30(6):1898-1909.e4
Ufbp1 promotes plasma cell development and ER expansion by modulating distinct branches of UPR.
Zhu H, Bhatt B, Sivaprakasam S, Cai Y, Liu S, Kodeboyina SK, Patel N, Savage NM, Sharma A, Kaufman RJ, Li H, Singh N
Nature communications 2019 Mar 6;10(1):1084
Nature communications 2019 Mar 6;10(1):1084
ROCK2, but not ROCK1 interacts with phosphorylated STAT3 and co-occupies TH17/TFH gene promoters in TH17-activated human T cells.
Chen W, Nyuydzefe MS, Weiss JM, Zhang J, Waksal SD, Zanin-Zhorov A
Scientific reports 2018 Nov 9;8(1):16636
Scientific reports 2018 Nov 9;8(1):16636
RANKL-mediated harmonious dialogue between fetus and mother guarantees smooth gestation by inducing decidual M2 macrophage polarization.
Meng YH, Zhou WJ, Jin LP, Liu LB, Chang KK, Mei J, Li H, Wang J, Li DJ, Li MQ
Cell death & disease 2017 Oct 12;8(10):e3105
Cell death & disease 2017 Oct 12;8(10):e3105
Batf3 selectively determines acquisition of CD8(+) dendritic cell phenotype and function.
Chandra J, Kuo PT, Hahn AM, Belz GT, Frazer IH
Immunology and cell biology 2017 Feb;95(2):215-223
Immunology and cell biology 2017 Feb;95(2):215-223
Affinity and dose of TCR engagement yield proportional enhancer and gene activity in CD4+ T cells.
Allison KA, Sajti E, Collier JG, Gosselin D, Troutman TD, Stone EL, Hedrick SM, Glass CK
eLife 2016 Jul 4;5
eLife 2016 Jul 4;5
γ-Tocopherol supplementation of allergic female mice augments development of CD11c+CD11b+ dendritic cells in utero and allergic inflammation in neonates.
Abdala-Valencia H, Soveg F, Cook-Mills JM
American journal of physiology. Lung cellular and molecular physiology 2016 Apr 15;310(8):L759-71
American journal of physiology. Lung cellular and molecular physiology 2016 Apr 15;310(8):L759-71
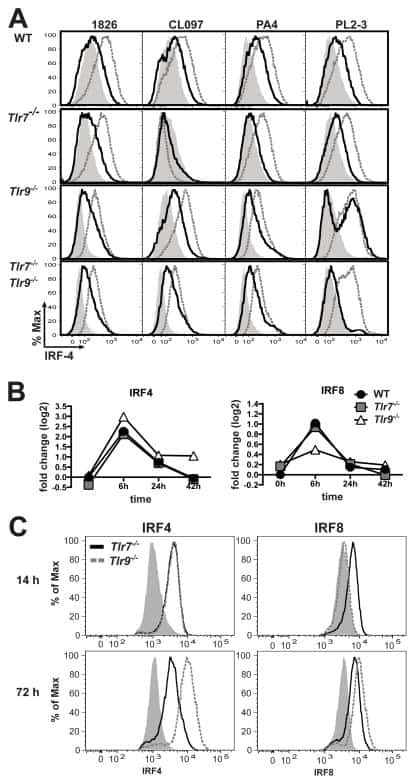
Cell-intrinsic expression of TLR9 in autoreactive B cells constrains BCR/TLR7-dependent responses.
Nündel K, Green NM, Shaffer AL, Moody KL, Busto P, Eilat D, Miyake K, Oropallo MA, Cancro MP, Marshak-Rothstein A
Journal of immunology (Baltimore, Md. : 1950) 2015 Mar 15;194(6):2504-12
Journal of immunology (Baltimore, Md. : 1950) 2015 Mar 15;194(6):2504-12
Beta-catenin signaling drives differentiation and proinflammatory function of IRF8-dependent dendritic cells.
Cohen SB, Smith NL, McDougal C, Pepper M, Shah S, Yap GS, Acha-Orbea H, Jiang A, Clausen BE, Rudd BD, Denkers EY
Journal of immunology (Baltimore, Md. : 1950) 2015 Jan 1;194(1):210-22
Journal of immunology (Baltimore, Md. : 1950) 2015 Jan 1;194(1):210-22
No comments: Submit comment
Supportive validation
- Submitted by
- Invitrogen Antibodies (provider)
- Main image

- Experimental details
- Normal human peripheral blood cells were stimulated for 3 days with Anti-Human CD3 and Anti-Human CD28 Functional Grade Purified (Product # 16-0037-81 and Product # 16-0289-81) and then intracellularly stained with 0.125 µg of Rat IgG1 K Isotype Control PE-Cyanine7 (Product # 25-4301-82) (blue histogram) or 0.125 µg of Anti-Human/Mouse IRF4 PE-Cyanine7 (purple histogram) using the Foxp3/Transcription Factor Staining Buffer Set (Product # 00-5523-00) and protocol. The orange histogram is unstimulated cells stained with 0.125 µg of Anti-Human/Mouse IRF4 PE-Cyanine7. Viable lymphocytes, as determined by Fixable Viability Dye eFluor® 450, were used for analysis.

Supportive validation
- Submitted by
- Invitrogen Antibodies (provider)
- Main image

- Experimental details
- NULL
- Submitted by
- Invitrogen Antibodies (provider)
- Main image
- Experimental details
- NULL
- Submitted by
- Invitrogen Antibodies (provider)
- Main image

- Experimental details
- NULL
- Submitted by
- Invitrogen Antibodies (provider)
- Main image

- Experimental details
- NULL
- Submitted by
- Invitrogen Antibodies (provider)
- Main image

- Experimental details
- NULL
- Submitted by
- Invitrogen Antibodies (provider)
- Main image
- Experimental details
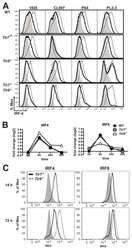
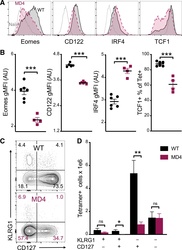
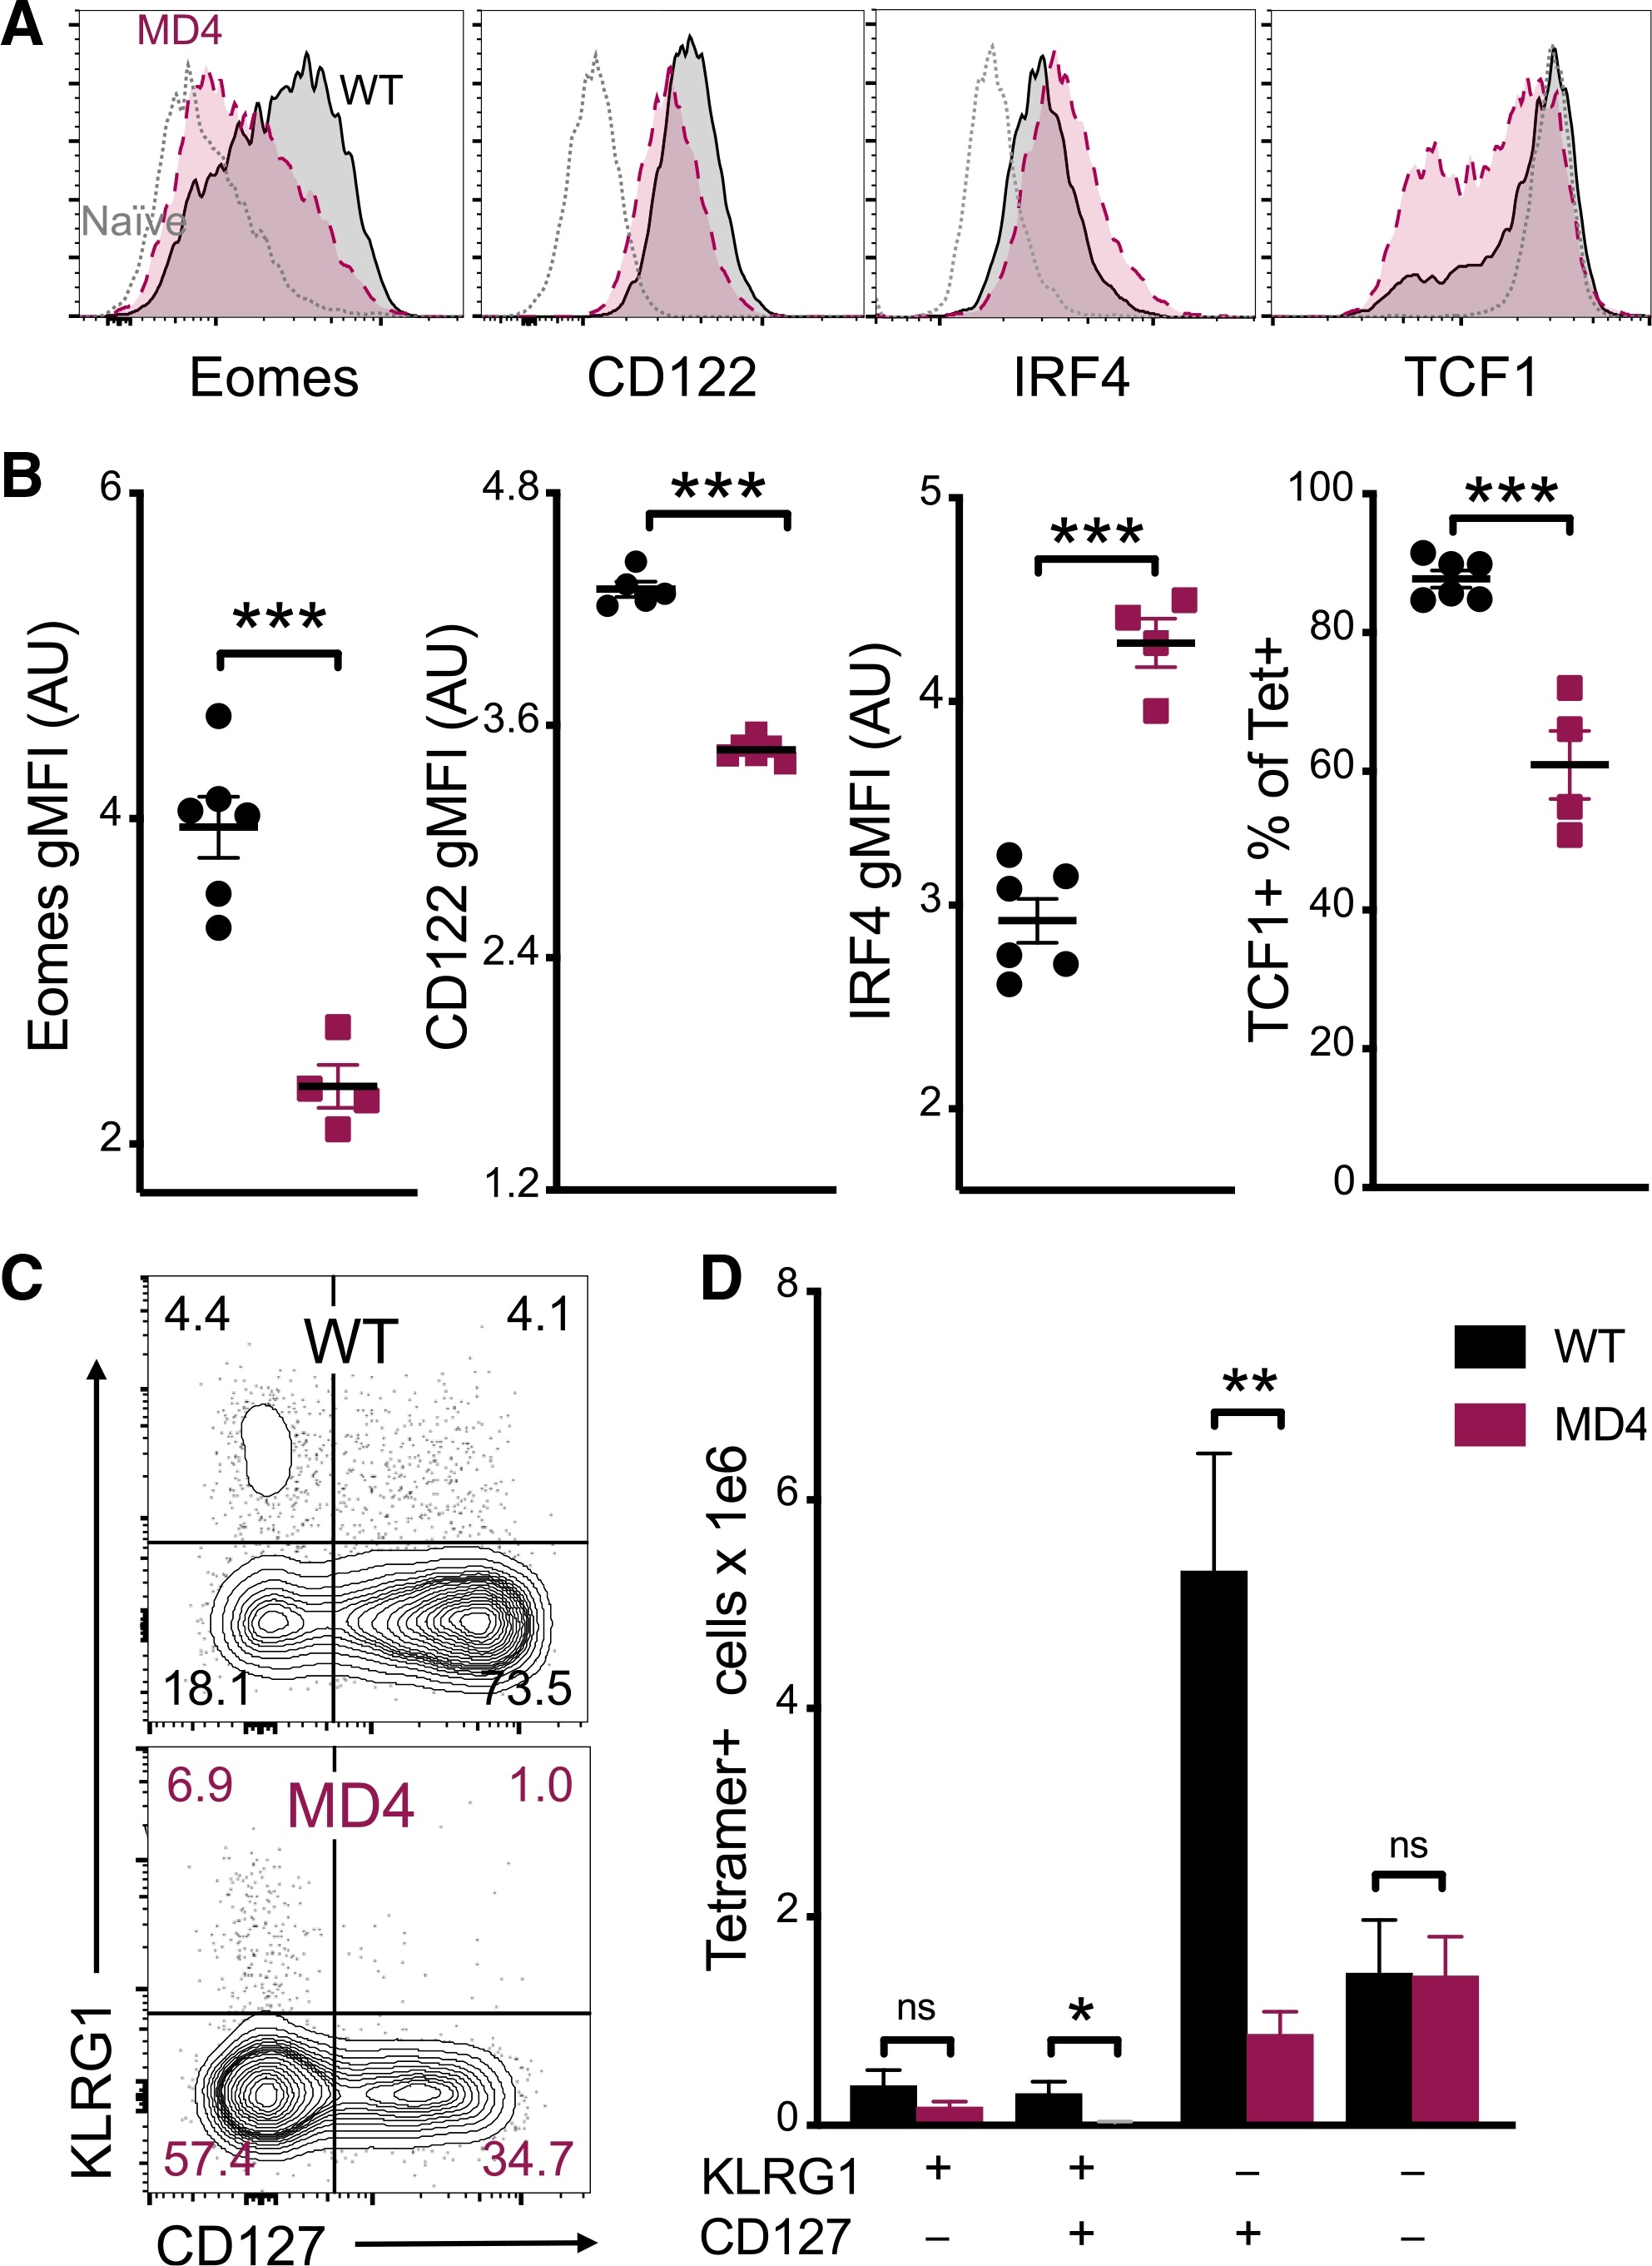
- Figure 4. B cells promote CD8 T cell memory programming following subunit vaccination (A) Representative histograms for Eomes, CD122, IRF4, and TCF1 staining of tetramer+ cells from WT (black) or MD4 (maroon) mice 7 days after combined-adjuvant vaccination or for CD44- naive control CD8 T cells (gray). (B) The gMFI of tetramer+ cells for Eomes, CD122, and IRF4, where the x axis intersects the y axis at the average gMFI value for CD44- naive controls, and the percentage of tetramer+ cells that stained positive for TCF1. (C and D) Representative KLRG1 versus CD127 staining (C) and numbers of tetramer+ splenocytes in the respective quadrants (D), 7 days after immunization. Data shown are means +- SEM; n : mice per group, representative of 3 experiments. Significance was defined by two-tailed, unpaired Student's t tests, where *p < 0.05, **p < 0.01, and ***p < 0.001.
- Submitted by
- Invitrogen Antibodies (provider)
- Main image
- Experimental details
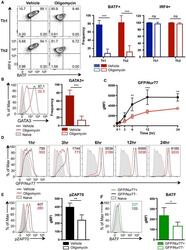
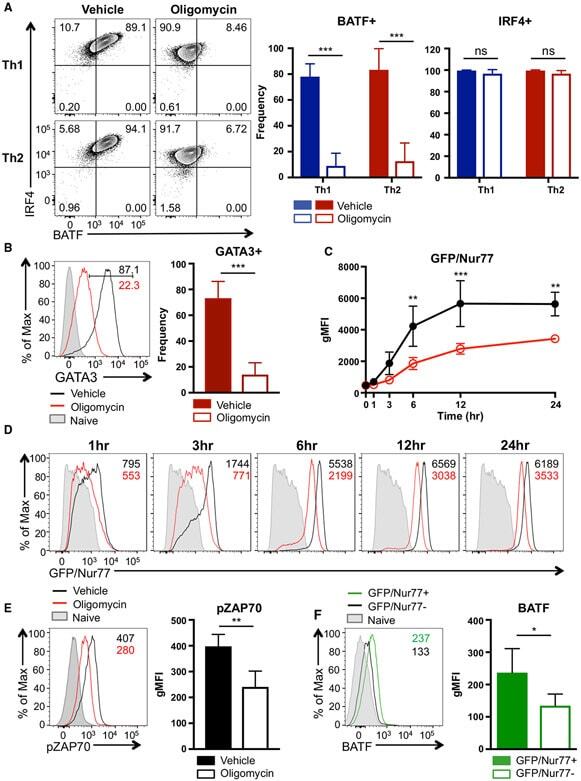
- Figure 4. ATP-Linked OXPHOS Controls BATF Induction by Regulating TCR Signaling (A and B) Naive CD4 T cells were differentiated under Th1 or Th2 polarizing conditions in the presence of vehicle or oligomycin for 24 h, and expression of (A) BATF, IRF4, and (B) GATA3 was determined by flow cytometry (4 to 5 independent experiments). (C and D) Naive CD4 T cells from Nur77/GFP spleens were activated under Th17 conditions in the presence of vehicle or oligomycin for indicated period of time. (C) Graph shows the expression of Nur77/GFP. (D) Representative plots are gated on live CD4 T cells (representative of 3 independent experiments). (E) Naive CD4 T cells were activated under Th17 conditions with vehicle or oligomycin. Representative histogram overlay shows the phosphorylation of ZAP70 at 24 h (representative of 5 independent experiments). (F) Naive CD4 T cells from Nur77/GFP reporter spleens were stimulated with Th17 cytokines for 6 h. BATF expression in GFP + and GFP - cells were determined by flow cytometry (3 independent experiments). Graphs show the average +- SD; (A and C) two-way ANOVA; (B, E and F) unpaired t test *p < 0.05, **p < 0.01, ***p < 0.001.
- Submitted by
- Invitrogen Antibodies (provider)
- Main image
- Experimental details
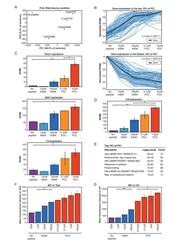
- Figure 2. RNA-Sequencing reveals graded expression of activation signature genes. ( A ) Principal component analysis (PCA) of the approximately 3,200 genes that changed between any two samples reveals that the primary axis of variation (PC1, shown along the x-axis) orders the five conditions by increasing TCR signal strength: No Peptide; low-dose, low-affinity (10 muM K99A); high-dose, low-affinity (100 muM K99A); low-dose, high-affinity (0.1 muM PCC); and high-dose, high-affinity (10 muM PCC). ( B ) After ordering the ~3200 genes used for PCA by their contribution to PC1, we extracted the top 10%--that is, the ~320 genes contributing most positively to a sample's PC1 value--and the bottom 10%--that is, the ~320 genes contributing most negatively to a sample's PC1 value. Each group displays a clear trend, with the top 10% increasing in expression as signal strength increases, and the bottom 10% decreasing in expression. Each blue line represents a gene, with reads per kilobase per million (RPKM) normalized from 0 to 1 across the five conditions. Significance was determined using permutation testing, where the mean difference between genes in the No Peptide sample as compared to 10 muM PCC was normally distributed over randomly generated groups of genes. This normal distribution was compared to the top 10% and bottom 10% genes to generate a p-value. ( C ) Genes in the top 10% of PC1, termed activation signature genes, include many genes previously identified as impor

- Submitted by
- Invitrogen Antibodies (provider)
- Main image
- Experimental details
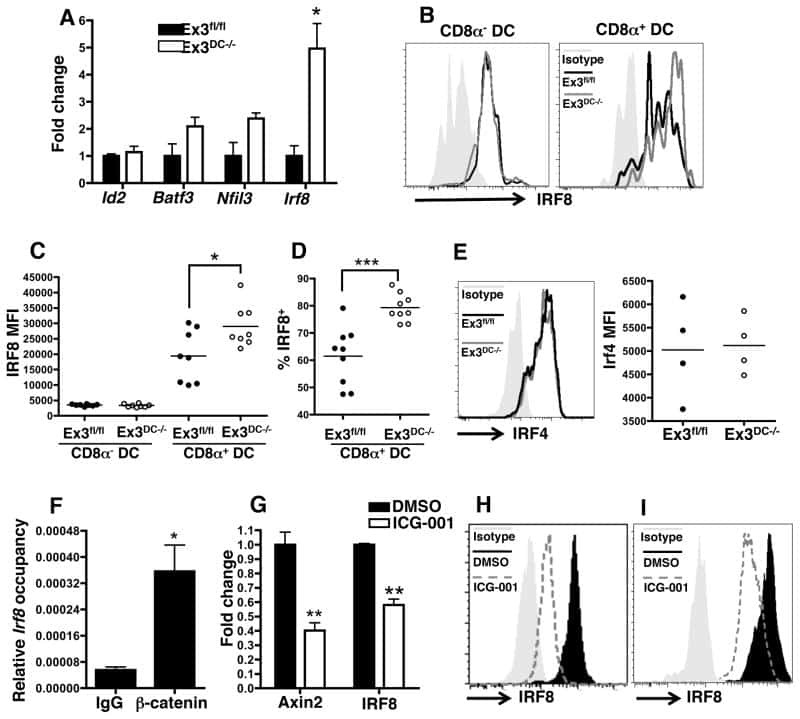
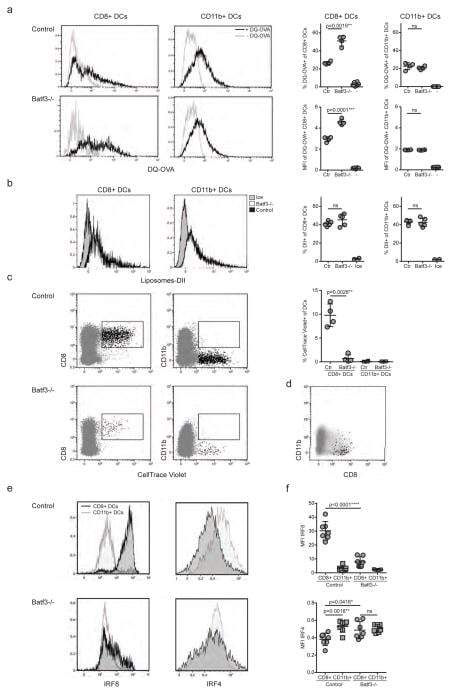
- Figure 4 IRF4-expressing CD8+ DCs in Batf3-/- mice are able to process antigen but lose capacity to take up dying cells (a) Splenocytes of Batf3-/- and control mice were incubated with DQ-OVA for 3 hours and subsequently analysed by flow cytometry for DQ-OVA processing. CD8+ and CD11b+ dendritic cell subsets were gated as shown in Figure 2 . Shown are representative histograms of green fluorescence (DQ-OVA) of treated versus untreated CD8+ and CD11b+ DCs in Batf3-/- and control splenocytes. The percentage and MFI of DQ-OVA+ CD8+ or CD11b+ DCs as well as of untreated samples (-) was compared. Each point represents a sample of one animal with indication of mean +/- SD of whole group (n=4). Shown is one of two independent experiments. (b) Splenocytes of Batf3-/- and control mice were incubated with DiI-labelled liposomes for 90 min and subsequently analysed by flow cytometry for liposome uptake. Shown are representative histograms of red fluorescence (DiI+) of CD8+ and CD11b+ DCs in Batf3-/- and control splenocytes incubated at 37degC or on ice. The percentage of DiI+ cells of CD8+ or CD11b+ DCs was compared. Each point represents a sample of one animal with indication of mean+/- SD of the whole group (n=5). (c-d) CellTrace Violet labelled, UV irradiated dying cells were injected into Batf3-/- and control mice. 3 hours later, splenic CD11b+ and CD8+ DCs were analysed for endocytosis of dying cells. (c) Shown are flow cytometry plots that were pre-gated on DCs as shown in Supplem
- Submitted by
- Invitrogen Antibodies (provider)
- Main image
- Experimental details
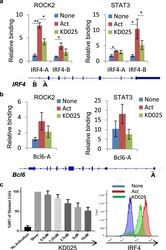
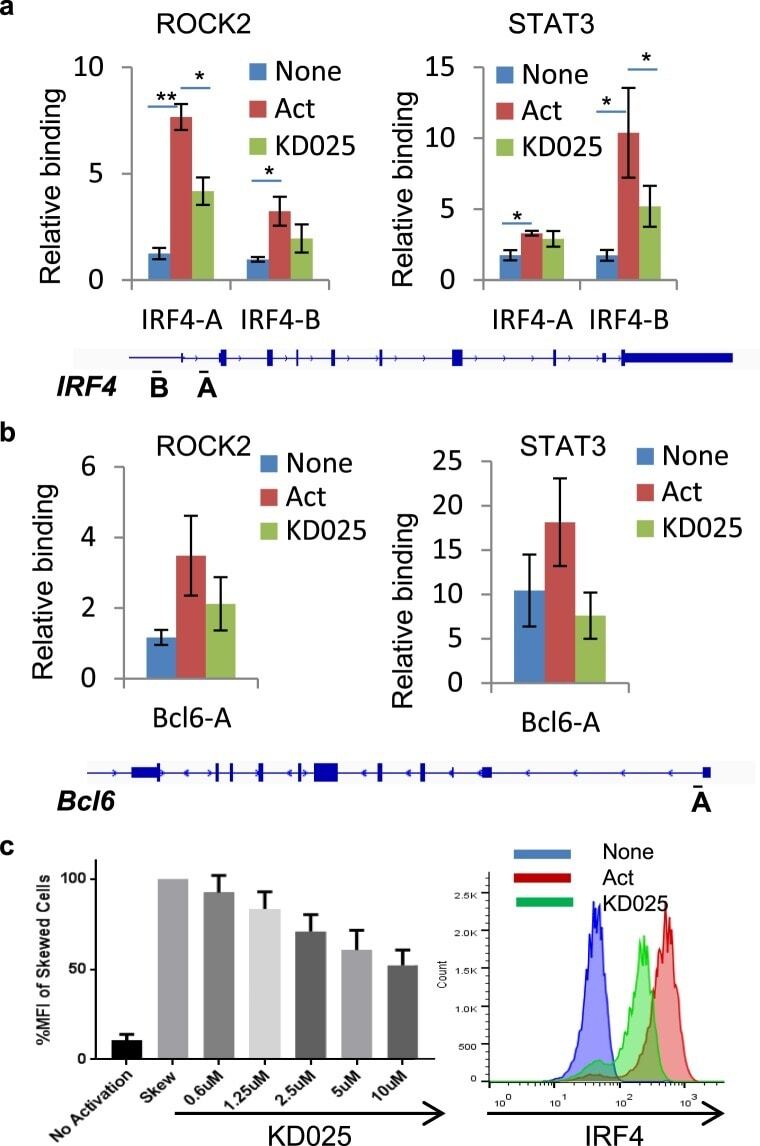
- Figure 3 Targeted ROCK2 inhibition decreased the binding of ROCK2 to the Irf4 and Bcl6 promoters at Th17-skewing conditions. Human peripheral blood CD4 + T cells were stimulated under Th17-skewing conditions for 48 hours in the absence or presence of KD025, chromatin was purified and proceeded to ChIP-qPCR analyses with anti-ROCK2 or anti-STAT3 antibodies ( a , b ), or Cells were stained with antibodies to IRF4 and analyzed by Flow Cytometry ( c , d ). ( c ) IRF4 expression measured by flow cytometry. Left, Mean Fluorescence Index (MFI) for IRF4 is plotted as percentage of MFI for skewed cells (as 100%). Right, Histogram of the flow cytometry analysis. The average of four different experiments is shown. *p < 0.05; **p < 0.01.
- Submitted by
- Invitrogen Antibodies (provider)
- Main image
- Experimental details
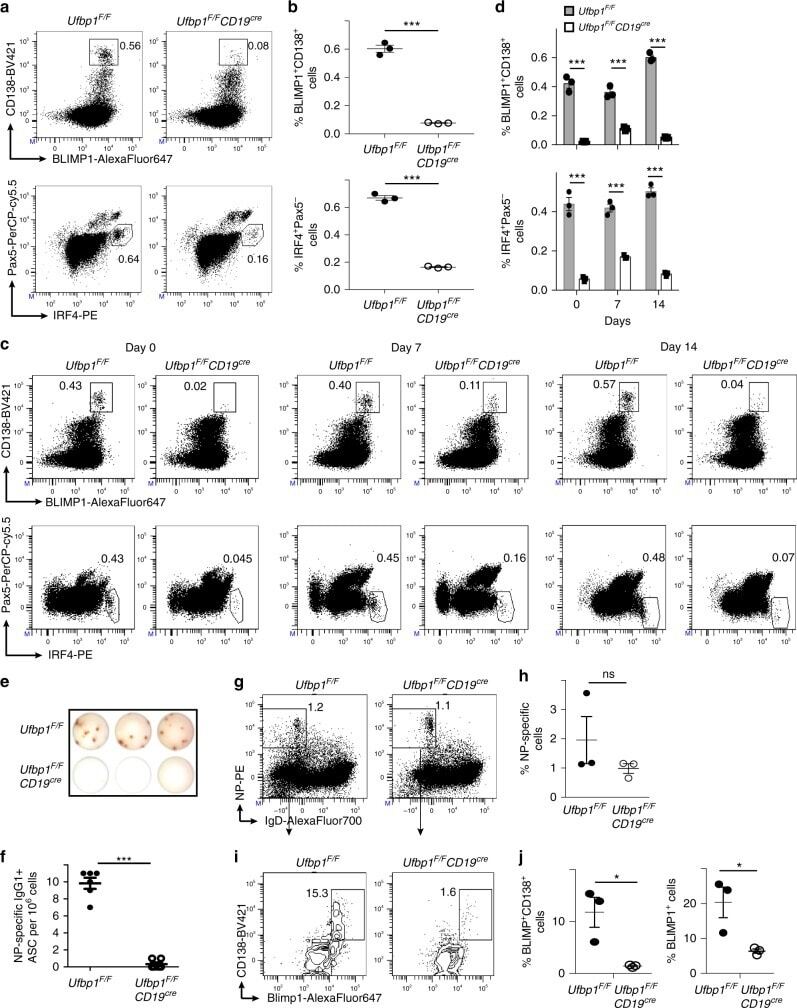
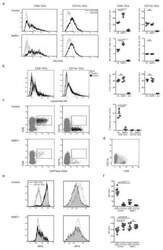
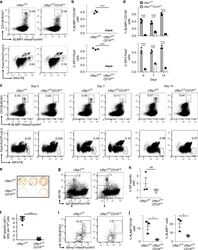
- Fig. 2 Decreased number of plasma cells in Ufbp1 F/F CD19 cre mice. a Bone marrow cells from indicated mice were stained with BLIMP1, CD138, IRF4, and Pax5, and analyzed by flow cytometry. Shown is the BLIMP1 versus CD138 (upper panel), and IRF4 versus Pax5 staining (lower panel) b Enumeration of frequencies of BLIMP1 + CD138 + and IRF4 + Pax5 - cells in a ( n = 3 mice/genotype). c Ufbp1 F/F and Ufbp1 F/F CD19 cre mice immunized with 4-hydroxy-3-nitrophenylacetyl conjugated to keyhole limpet hemocyanin (NP-KLH) as in Fig. 1c were analyzed for plasma cells (BLIMP1 + CD138 + and IRF4 + Pax5 - ) in bone marrow by flow cytometry at the indicated time points after immunization. d Enumeration of the frequencies of plasma cells (BLIMP1 + CD138 + and IRF4 + Pax5 - ) in c ( n = 3 mice/genotype). e Indicated mice were immunized as in Fig. 1c . Twenty-one days later, bone marrow cells were analyzed for the presence of NP-specific IgG1 + ASCs by ELISpot. Shown is a photograph of representative ELISpot wells. f Number (mean +- SEM) of NP-specific IgG1 + ELISpots in e ( n = 6 mice/genotype). g Ufbp1 F/F and Ufbp1 F/F CD19 cre mice were immunized with NP-KLH in Sigma Adjuvant System and on day 10, 7-AAD - CD4 - CD8 - Gr-1 - CD11b - splenic cells were analyzed for IgD and NP staining by flow cytometry. h Enumeration of the frequency of IgD - NP + cells in g ( n = 3 mice/genotype). i BLIMP1 and CD138 expression by IgD - NP + cells in g was an