Antibody data
- Antibody Data
- Antigen structure
- References [1]
- Comments [0]
- Validations
- Western blot [6]
- Immunocytochemistry [1]
- Immunohistochemistry [1]
- Other assay [4]
Submit
Validation data
Reference
Comment
Report error
- Product number
- PA5-41753 - Provider product page

- Provider
- Invitrogen Antibodies
- Product name
- Aconitase 1 Polyclonal Antibody
- Antibody type
- Polyclonal
- Antigen
- Synthetic peptide
- Description
- Peptide sequence: MSNPFAHLAE PLDPVQPGKK FFNLNKLEDS RYGRLPFSIR VLLEAAIRNC Sequence homology: Cow: 100%; Dog: 93%; Guinea Pig: 91%; Horse: 92%; Human: 100%; Mouse: 93%; Pig: 100%; Rabbit: 86%; Rat: 100%
- Reactivity
- Human, Mouse
- Host
- Rabbit
- Isotype
- IgG
- Vial size
- 100 µL
- Concentration
- 0.5 mg/mL
- Storage
- -20° C, Avoid Freeze/Thaw Cycles
Submitted references Aberrant Expression of ACO1 in Vasculatures Parallels Progression of Idiopathic Pulmonary Fibrosis.
Fukumoto J, Lin M, Banday MM, Patil SS, Krishnamurthy S, Breitzig M, Soundararajan R, Galam L, Narala VR, Johns C, Patel K, Dunning J, Lockey RF, Sharma NS, Kolliputi N
Frontiers in pharmacology 2022;13:890380
Frontiers in pharmacology 2022;13:890380
No comments: Submit comment
Supportive validation
- Submitted by
- Invitrogen Antibodies (provider)
- Main image
- Experimental details
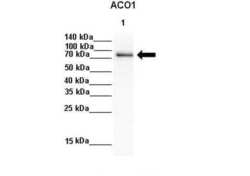
- Western blot analysis of HePG2 cell lysate using an anti-Aconitase 1 polyclonal antibody (Product # PA5-41753). Primary Antibody Dilution: 1:1000; Secondary Antibody: Goat anti rabbit-HRP; Secondary Antibody Dilution: 1:8000.
- Submitted by
- Invitrogen Antibodies (provider)
- Main image
- Experimental details
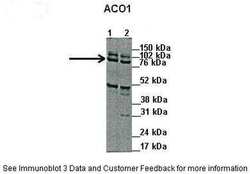
- Western blot analysis of human Capan1, HPAF cell lysate using an anti-Aconitase 1 polyclonal antibody (Product # PA5-41753). Primary Antibody Dilution: 1:1000; Secondary Antibody: Anti-Rabbit HRP; Secondary Antibody Dilution: 1:5000. LANE 1)45µg capan1 cell lysate; LANE 2) 45 µg HPAF cell lysate.
- Submitted by
- Invitrogen Antibodies (provider)
- Main image
- Experimental details
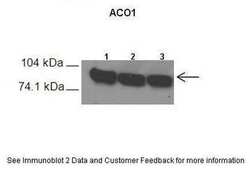
- Western blot analysis of mouse liver cells using an anti-Aconitase 1 polyclonal antibody (Product # PA5-41753). Primary Antibody Dilution: 1:500; Secondary Antibody: Anti-rabbit HRP; Secondary Antibody Dilution: 1:3000. LANE 1)60 µg mouse liver extract; LANE 2) 60 µg mouse liver extract; LANE 3) 60 µg mouse liver extract.
- Submitted by
- Invitrogen Antibodies (provider)
- Main image
- Experimental details
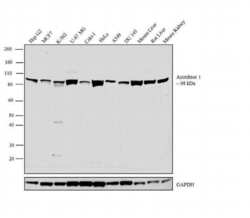
- Western blot analysis was performed on whole cell extracts (30 µg lysate) of Hep G2 (Lane 1), MCF7 (Lane 2), K-562 (Lane 3), U-87 MG (Lane 4), Caki-1 (Lane 5), HeLa (Lane 6), A549 (Lane 7), DU 145 (Lane 8), tissue extracts of Mouse Liver (Lane 9), Rat Liver (Lane 10) and Mouse Kidney (Lane 11). The blot was probed with Anti-Aconitase 1 Polyclonal Antibody (Product # PA5-41753, 1:1000 dilution) and detected by chemiluminescence using Goat anti-Rabbit IgG (H+L) Superclonal™ Secondary Antibody, HRP conjugate (Product # A27036, 0.25 µg/ml, 1:4000 dilution). A 98 kDa band corresponding to Aconitase 1 was observed across the cell lines and tissues tested.
- Submitted by
- Invitrogen Antibodies (provider)
- Main image
- Experimental details
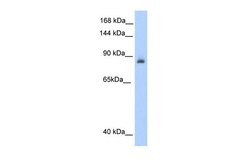
- Western blot analysis of human kidney cells using an anti-Aconitase 1 polyclonal antibody (Product # PA5-41753).
- Submitted by
- Invitrogen Antibodies (provider)
- Main image

- Experimental details
- Knockdown of Aconitase 1 was achieved by transfecting HeLa with Aconitase 1 specific siRNAs (Silencer® select Product # s671). Western blot analysis (Fig. a) was performed using triton buffer cell extracts from the Aconitase 1 knockdown cells (lane 3), non-specific scrambled siRNA transfected cells (lane 2) and untransfected cells (lane 1). The blot was probed with Aconitase 1 Polyclonal Antibody (Product # PA5-41753, 1:1000 dilution) and Goat anti-Rabbit IgG (H+L) Superclonal™ Secondary Antibody, HRP conjugate (Product # A27036, 0.25µg/ml, 1:4000 dilution). Densitometric analysis of this western blot is shown in histogram (Fig. b). Decrease in signal upon siRNA mediated knock down confirms that antibody is specific to Aconitase 1.
Supportive validation
- Submitted by
- Invitrogen Antibodies (provider)
- Main image

- Experimental details
- Immunocytochemistry (paraffin-embedded) analysis of human Capan1 cells using an anti-Aconitase 1 polyclonal antibody (Product # PA5-41753). Primary Antibody Dilution:1:300; Secondary Antibody: Anti-rabbit-AlexaFluor-488; Secondary Antibody Dilution: 1:200.
Supportive validation
- Submitted by
- Invitrogen Antibodies (provider)
- Main image
- Experimental details
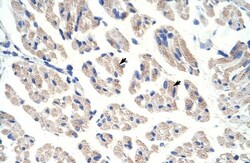
- Immunohistochemistry (paraffin-embedded) analysis of human muscle tissue using an anti-Aconitase 1 polyclonal antibody (Product # PA5-41753).
Supportive validation
- Submitted by
- Invitrogen Antibodies (provider)
- Main image

- Experimental details
- FIGURE 1 Various cell types in the lung express aconitase 1 in a different subcellular localization pattern (A-C) Paraffin-embedded lung sections from wild-type mice aged 7-9 weeks were immunohistochemically labeled for i) Aconitase 1 (ACO1: (A,B) or ii) E-cad and ACO1 (C) (D-F) Paraffin-embedded lung sections from patients with idiopathic pulmonary fibrosis (IPF) were subjected to immunohistochemical labeling for i) ACO1 (D) , ii) E-cad and ACO1 (E) or iii) E-cad, ACO1 and vWF (F) (G) Specificity of the ACO1 antibody used in this article (cat# PA5-41753, Thermo Fisher Scientific) was evaluated by western blot analysis using whole cell lysates from non-treated H441 cells and H441 cells transfected with either ACO1-overexpression or control plasmids. Equal amounts of protein (7.5 mug) were loaded per lane (H) The expressions of ACO1 in different cell types were examined by western blotting. PBEC (Human Pulmonary Bronchial Epithelial Cells); HMVEC (Human Lung Microvascular Endothelial Cells); T7 (mouse immortalized type II alveolar epithelial cell line); C22 (mouse immortalized club cell line); Fibroblast (primary mouse lung fibroblasts). Equal amounts of protein (7.5 mug) were loaded per lane. Data from one representative experiment of two or more independent experiments are shown.
- Submitted by
- Invitrogen Antibodies (provider)
- Main image
- Experimental details
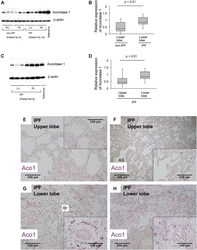
- FIGURE 2 The expression of aconitase 1 is significantly high in the lower lobes of IPF lungs compared to the upper lobes (A,C) Western blot analysis for Aconitase 1 (ACO1) was performed using whole lysates prepared from the native lungs of lung transplant recipients with various lung diseases. Each lane represents an individual sample from different sampling sites (please see Figure 3A and online supplement for sampling method). Equal amounts of protein (7.5 mug) were loaded per lane. A common reference sample from Patient No.3 was loaded at the last lane for each blot to enable the quantitative comparison between different blots. RU (right upper lobe); RL (right lower lobe); LU (left upper lobe); LL (left lower lobe) (B,D) Quantitative analysis of ACO1 expression based on the results of western blotting. (B) Lower lobe samples from Non-IPF ( n = 18) vs. lower lobe samples from IPF group ( n = 18). (D) Upper lobe samples from IPF ( n = 15) vs. lower lobe samples from IPF group ( n = 21) (E-H) Paraffin-embedded lung sections from patients with IPF were subjected to immunohistochemical labeling for ACO1. The insets at the corner of each photomicrograph are magnified views of each image. A p -value of 0.05 or lower was considered to be statistically significant. Data from one representative experiment of two or more independent experiments are shown.
- Submitted by
- Invitrogen Antibodies (provider)
- Main image
- Experimental details
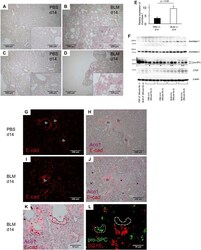
- FIGURE 5 Bleomycin-induced lung fibrosis in mice displays an abundance of aconitase 1-positive E-cadherin-positive cells distributed in alveolar and bronchiolar structures within fibrotic areas. Wild-type mice, aged 7-9 weeks, were intratracheally administered 1.5 U/kg of bleomycin (BLM) or PBS. On days 7 and 14, lung samples were harvested ( n = 3 each time point/group) (A-D) Immunohistochemical (IHC) labeling for ACO1 was performed on paraffin-embedded lung sections from BLM- and PBS-treated mice. The insets at the corner of each photomicrograph are magnified views of each image (E) The intensity of ACO1 expression was calculated using IHC images as described in the method section in the online supplement (3 mice for each PBS and BLM group; six or more randomly selected fields at 100X magnification). The results (means +- SE) are shown in bar graphs (F) Western blot analysis was performed using whole lysates of the lung tissues. Equal amounts of protein (7.5 mug) were loaded per lane. Each lane grouped within an identical mouse ID (Mouse No. 3, 4, 5, 6) represents an individual sample prepared from different lung lobes (G-K) Lung sections were immunohistochemically labeled for E-cad and ACO1. Single-channel images and multi-channel merged images are shown (L) Adjacent lung section to K was immunohistochemically labeled for pro-SPC and SOX9. Br: bronchiolar epithelium. A p -value of 0.05 or lower was considered to be statistically significant. Data from one representative ex
- Submitted by
- Invitrogen Antibodies (provider)
- Main image

- Experimental details
- FIGURE 6 Aging associated with the patchy distribution of aconitase 1-positive E-cadherin-negative cells in remodeled alveoli. (A) Western blot analysis was performed using whole tissue lysates prepared from lungs of wild-type mice at different ages [7-9-weeks-old (n = 3), 16-mth-old (n = 5) and 22-mth-old (n = 5)]. Equal amounts of protein (7.5 mug) were loaded per lane. (B-E) : Expression of ACO1, E-cadherin, pro-SPC (the sum of #1 and #2 in Figure 6A), and claudin-10 was normalized to beta-actin and the results (means +- SE) are shown in bar graphs (F-M) Paraffin-embedded lung sections from 22-mth-old wild-type mice were subjected to i) H&E-staining (J) or ii) immunohistochemical double labeling for E-cad and ACO1 (F-I and K-M) . Single-channel images (K,L) and multi-channel merged images (F-I,M) are shown. The lung section the photomicrographs of (K-M) are imaged from is adjacent to (J) (L, M) are magnified views of the boxed region in (K) * p < 0.05; ** p < 0.01. a p -value of 0.05 or lower was considered to be statistically significant. Data from one representative experiment of two or more independent experiments are shown.
 Explore
 Validate
 Learn
Learn Western blot