Explore
 Validate
 Learn
Learn Western blot
 Immunoprecipitation
Antibody data
- Antibody Data
- Antigen structure
- References [19]
- Comments [0]
- Validations
- Western blot [4]
- Immunocytochemistry [1]
- Other assay [32]
Submit
Validation data
Reference
Comment
Report error
- Product number
- 33-2100 - Provider product page

- Provider
- Invitrogen Antibodies
- Product name
- Lamin B2 Monoclonal Antibody (E-3)
- Antibody type
- Monoclonal
- Antigen
- Other
- Reactivity
- Human, Mouse, Rat, Chicken/Avian
- Host
- Mouse
- Isotype
- IgG
- Antibody clone number
- E-3
- Vial size
- 100 µg
- Concentration
- 0.5 mg/mL
- Storage
- -20°C
Submitted references A lamin A/C variant causing striated muscle disease provides insights into filament organization.
A small-molecule ICMT inhibitor delays senescence of Hutchinson-Gilford progeria syndrome cells.
SATB2-LEMD2 interaction links nuclear shape plasticity to regulation of cognition-related genes.
Chromatin compartment dynamics in a haploinsufficient model of cardiac laminopathy.
Detection of DNA Double Strand Breaks by γH2AX Does Not Result in 53bp1 Recruitment in Mouse Retinal Tissues.
Differential expression of nuclear lamin subtypes in the neural cells of the adult rat cerebral cortex.
MET receptor variant R970C favors calpain-dependent generation of a fragment promoting epithelial cell scattering.
Lamin B1 is required for mature neuron-specific gene expression during olfactory sensory neuron differentiation.
Intracellular mGluR5 plays a critical role in neuropathic pain.
High-resolution Antibody Array Analysis of Childhood Acute Leukemia Cells.
Reciprocal knock-in mice to investigate the functional redundancy of lamin B1 and lamin B2.
An absence of nuclear lamins in keratinocytes leads to ichthyosis, defective epidermal barrier function, and intrusion of nuclear membranes and endoplasmic reticulum into the nuclear chromatin.
Farnesylation of lamin B1 is important for retention of nuclear chromatin during neuronal migration.
Regulation of prelamin A but not lamin C by miR-9, a brain-specific microRNA.
Nuclear lamins are differentially expressed in retinal neurons of the adult rat retina.
A {gamma}-secretase-independent mechanism of signal transduction by the amyloid precursor protein.
Functional metabotropic glutamate receptors on nuclei from brain and primary cultured striatal neurons. Role of transporters in delivering ligand.
Activation of metabotropic glutamate receptor mGlu5 on nuclear membranes mediates intranuclear Ca2+ changes in heterologous cell types and neurons.
Binding of neuronal nitric-oxide synthase (nNOS) to carboxyl-terminal-binding protein (CtBP) changes the localization of CtBP from the nucleus to the cytosol: a novel function for targeting by the PDZ domain of nNOS.
Kronenberg-Tenga R, Tatli M, Eibauer M, Wu W, Shin JY, Bonne G, Worman HJ, Medalia O
Journal of cell science 2021 Mar 22;134(6)
Journal of cell science 2021 Mar 22;134(6)
A small-molecule ICMT inhibitor delays senescence of Hutchinson-Gilford progeria syndrome cells.
Chen X, Yao H, Kashif M, Revêchon G, Eriksson M, Hu J, Wang T, Liu Y, Tüksammel E, Strömblad S, Ahearn IM, Philips MR, Wiel C, Ibrahim MX, Bergo MO
eLife 2021 Feb 2;10
eLife 2021 Feb 2;10
SATB2-LEMD2 interaction links nuclear shape plasticity to regulation of cognition-related genes.
Feurle P, Abentung A, Cera I, Wahl N, Ablinger C, Bucher M, Stefan E, Sprenger S, Teis D, Fischer A, Laighneach A, Whitton L, Morris DW, Apostolova G, Dechant G
The EMBO journal 2021 Feb 1;40(3):e103701
The EMBO journal 2021 Feb 1;40(3):e103701
Chromatin compartment dynamics in a haploinsufficient model of cardiac laminopathy.
Bertero A, Fields PA, Smith AST, Leonard A, Beussman K, Sniadecki NJ, Kim DH, Tse HF, Pabon L, Shendure J, Noble WS, Murry CE
The Journal of cell biology 2019 Sep 2;218(9):2919-2944
The Journal of cell biology 2019 Sep 2;218(9):2919-2944
Detection of DNA Double Strand Breaks by γH2AX Does Not Result in 53bp1 Recruitment in Mouse Retinal Tissues.
Müller B, Ellinwood NM, Lorenz B, Stieger K
Frontiers in neuroscience 2018;12:286
Frontiers in neuroscience 2018;12:286
Differential expression of nuclear lamin subtypes in the neural cells of the adult rat cerebral cortex.
Takamori Y, Hirahara Y, Wakabayashi T, Mori T, Koike T, Kataoka Y, Tamura Y, Kurebayashi S, Kurokawa K, Yamada H
IBRO reports 2018 Dec;5:99-109
IBRO reports 2018 Dec;5:99-109
MET receptor variant R970C favors calpain-dependent generation of a fragment promoting epithelial cell scattering.
Montagne R, Baranzelli A, Muharram G, Catherine L, Lesaffre M, Vinchent A, Kherrouche Z, Werkmeister E, Cortot AB, Tulasne D
Oncotarget 2017 Feb 14;8(7):11268-11283
Oncotarget 2017 Feb 14;8(7):11268-11283
Lamin B1 is required for mature neuron-specific gene expression during olfactory sensory neuron differentiation.
Gigante CM, Dibattista M, Dong FN, Zheng X, Yue S, Young SG, Reisert J, Zheng Y, Zhao H
Nature communications 2017 Apr 20;8:15098
Nature communications 2017 Apr 20;8:15098
Intracellular mGluR5 plays a critical role in neuropathic pain.
Vincent K, Cornea VM, Jong YI, Laferrière A, Kumar N, Mickeviciute A, Fung JST, Bandegi P, Ribeiro-da-Silva A, O'Malley KL, Coderre TJ
Nature communications 2016 Feb 3;7:10604
Nature communications 2016 Feb 3;7:10604
High-resolution Antibody Array Analysis of Childhood Acute Leukemia Cells.
Kanderova V, Kuzilkova D, Stuchly J, Vaskova M, Brdicka T, Fiser K, Hrusak O, Lund-Johansen F, Kalina T
Molecular & cellular proteomics : MCP 2016 Apr;15(4):1246-61
Molecular & cellular proteomics : MCP 2016 Apr;15(4):1246-61
Reciprocal knock-in mice to investigate the functional redundancy of lamin B1 and lamin B2.
Lee JM, Tu Y, Tatar A, Wu D, Nobumori C, Jung HJ, Yoshinaga Y, Coffinier C, de Jong PJ, Fong LG, Young SG
Molecular biology of the cell 2014 May;25(10):1666-75
Molecular biology of the cell 2014 May;25(10):1666-75
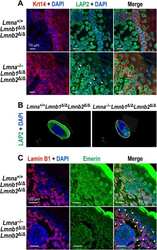
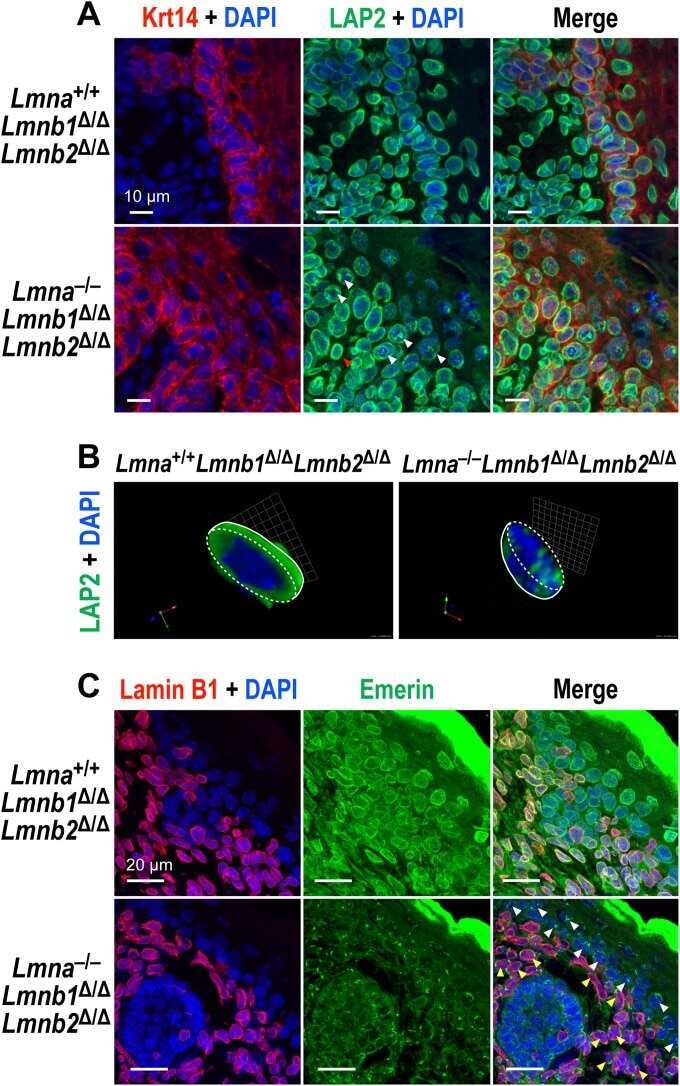
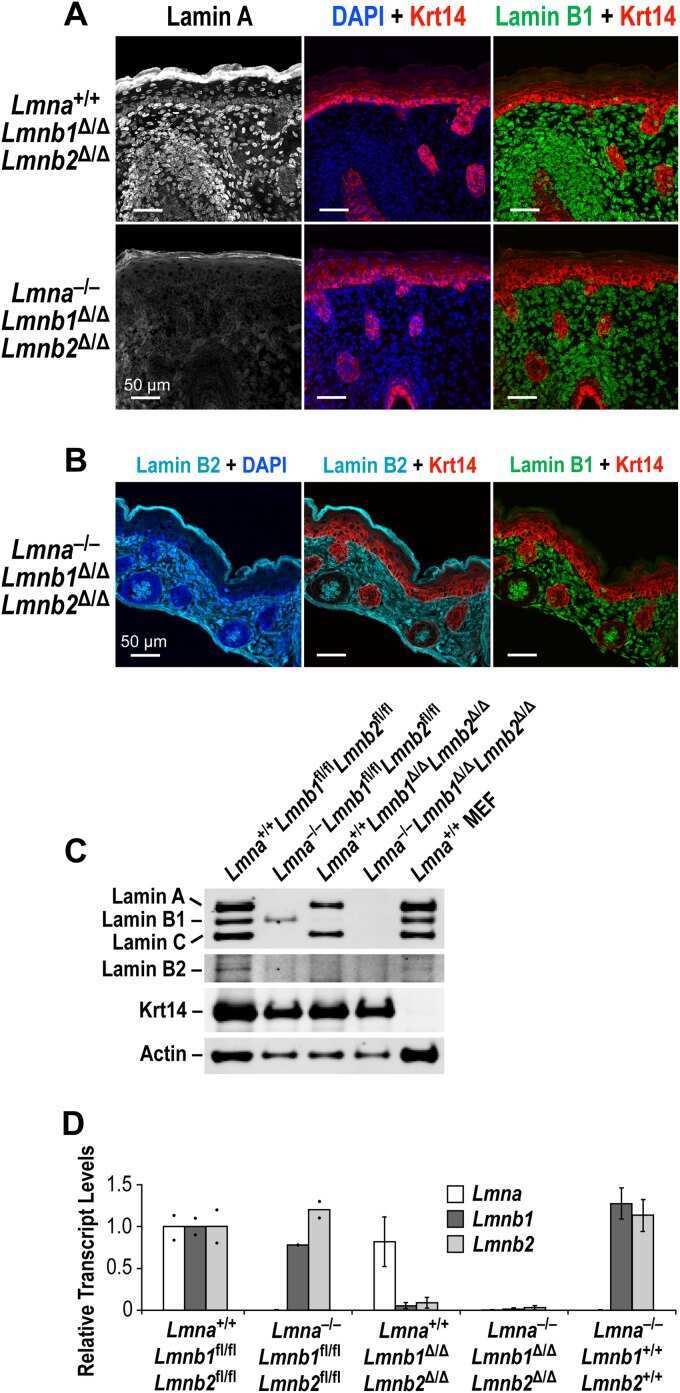
An absence of nuclear lamins in keratinocytes leads to ichthyosis, defective epidermal barrier function, and intrusion of nuclear membranes and endoplasmic reticulum into the nuclear chromatin.
Jung HJ, Tatar A, Tu Y, Nobumori C, Yang SH, Goulbourne CN, Herrmann H, Fong LG, Young SG
Molecular and cellular biology 2014 Dec;34(24):4534-44
Molecular and cellular biology 2014 Dec;34(24):4534-44
Farnesylation of lamin B1 is important for retention of nuclear chromatin during neuronal migration.
Jung HJ, Nobumori C, Goulbourne CN, Tu Y, Lee JM, Tatar A, Wu D, Yoshinaga Y, de Jong PJ, Coffinier C, Fong LG, Young SG
Proceedings of the National Academy of Sciences of the United States of America 2013 May 21;110(21):E1923-32
Proceedings of the National Academy of Sciences of the United States of America 2013 May 21;110(21):E1923-32
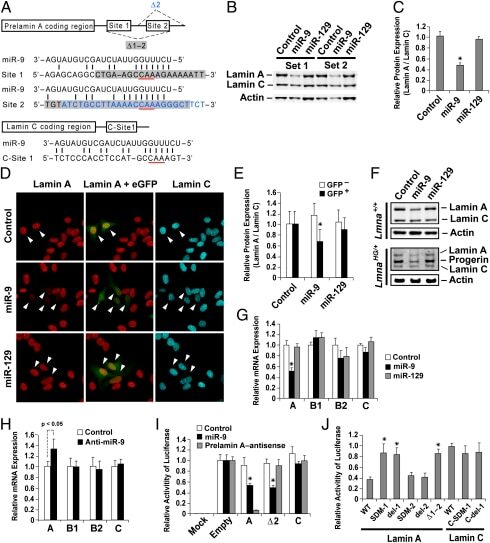
Regulation of prelamin A but not lamin C by miR-9, a brain-specific microRNA.
Jung HJ, Coffinier C, Choe Y, Beigneux AP, Davies BS, Yang SH, Barnes RH 2nd, Hong J, Sun T, Pleasure SJ, Young SG, Fong LG
Proceedings of the National Academy of Sciences of the United States of America 2012 Feb 14;109(7):E423-31
Proceedings of the National Academy of Sciences of the United States of America 2012 Feb 14;109(7):E423-31
Nuclear lamins are differentially expressed in retinal neurons of the adult rat retina.
Wakabayashi T, Mori T, Hirahara Y, Koike T, Kubota Y, Takamori Y, Yamada H
Histochemistry and cell biology 2011 Oct;136(4):427-36
Histochemistry and cell biology 2011 Oct;136(4):427-36
A {gamma}-secretase-independent mechanism of signal transduction by the amyloid precursor protein.
Hass MR, Yankner BA
The Journal of biological chemistry 2005 Nov 4;280(44):36895-904
The Journal of biological chemistry 2005 Nov 4;280(44):36895-904
Functional metabotropic glutamate receptors on nuclei from brain and primary cultured striatal neurons. Role of transporters in delivering ligand.
Jong YJ, Kumar V, Kingston AE, Romano C, O'Malley KL
The Journal of biological chemistry 2005 Aug 26;280(34):30469-80
The Journal of biological chemistry 2005 Aug 26;280(34):30469-80
Activation of metabotropic glutamate receptor mGlu5 on nuclear membranes mediates intranuclear Ca2+ changes in heterologous cell types and neurons.
O'Malley KL, Jong YJ, Gonchar Y, Burkhalter A, Romano C
The Journal of biological chemistry 2003 Jul 25;278(30):28210-9
The Journal of biological chemistry 2003 Jul 25;278(30):28210-9
Binding of neuronal nitric-oxide synthase (nNOS) to carboxyl-terminal-binding protein (CtBP) changes the localization of CtBP from the nucleus to the cytosol: a novel function for targeting by the PDZ domain of nNOS.
Riefler GM, Firestein BL
The Journal of biological chemistry 2001 Dec 21;276(51):48262-8
The Journal of biological chemistry 2001 Dec 21;276(51):48262-8
No comments: Submit comment
Supportive validation
- Submitted by
- Invitrogen Antibodies (provider)
- Main image
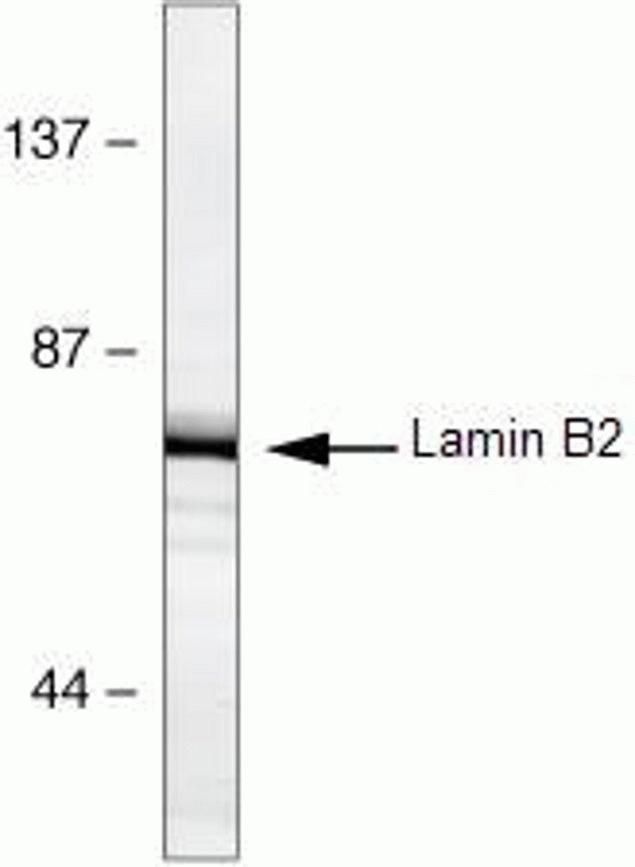
- Experimental details
- Western blot analysis of HeLa cell lysates using Lamin B2 Monoclonal Antibody, Mouse (clone E-3) (Product # 33-2100)
- Submitted by
- Invitrogen Antibodies (provider)
- Main image

- Experimental details
- Western blot analysis of HeLa cell lysates using Lamin B2 Monoclonal Antibody, Mouse (clone E-3) (Product # 33-2100)

- Submitted by
- Invitrogen Antibodies (provider)
- Main image
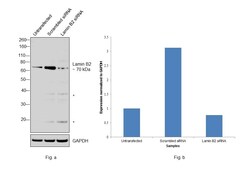
- Experimental details
- Knockdown of Lamin B2 was achieved by transfecting HCT 116 with Lamin B2 specific siRNAs (Silencer® select Product # s39477, s39478). Western blot analysis (Fig. a) was performed using modified whole cell extracts (1%SDS) from the Lamin B2 knockdown cells (Lane 3), non-specific scrambled siRNA transfected cells (Lane 2) and untransfected cells (Lane 1). The blot was probed with Lamin B2 Monoclonal Antibody (E-3) (Product # 33-2100, 0.5 µg/ml) and Goat anti-Mouse IgG (H+L), Superclonal™ Recombinant Secondary Antibody, HRP (Product # A28177, 0.25µg/ml, 1:4000 dilution). Densitometric analysis of this western blot is shown in histogram (Fig. b). Decrease in signal upon siRNA mediated knock down confirms that antibody is specific to Lamin B2..

- Submitted by
- Invitrogen Antibodies (provider)
- Main image
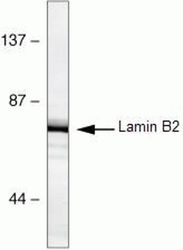
- Experimental details
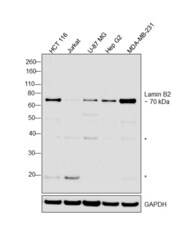
- Western blot was performed using Anti-Lamin B2 Monoclonal Antibody (E-3), (Product # 33-2100) and a 70 kDa band corresponding to Lamin B2 along with faint uncharacterized bands (*) at ~19, ~38 kDa were observed in the cell lines tested. Modified whole cell extracts (1%SDS) (40 µg lysate) of HCT 116 (Lane 1), Jurkat (Lane 2), U-87 MG (Lane 3), Hep G2 (Lane 4) and MDA-MB-231 (Lane 5) were electrophoresed using Novex® NuPAGE® 4-12 % Bis-Tris gel (Product # NP0321BOX). Resolved proteins were then transferred onto a nitrocellulose membrane (Product # IB23001) by iBlot® 2 Dry Blotting System (Product # IB21001). The blot was probed with the primary antibody (0.5 µg/ml) and detected by chemiluminescence with Goat anti-Mouse IgG (H+L), Superclonal™ Recombinant Secondary Antibody, HRP conjugate (Product # A28177, 1:4000 dilution) using the iBright FL 1000 (Product # A32752). Chemiluminescent detection was performed using Novex® ECL Chemiluminescent Substrate Reagent Kit (Product # WP20005)..

Supportive validation
- Submitted by
- Invitrogen Antibodies (provider)
- Main image
- Experimental details
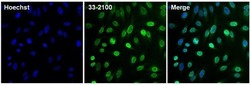
- Immunofluorescent analysis of Lamin B2 (green) in HeLa cells. The cells were fixed with 4% paraformaldehyde for 15 minutes, permeabilized with 0.1% Triton X-100 in PBS for 15 minutes, and blocked with 3% Blocker BSA (Product # 37525) in PBS for 30 minutes at room temperature. Cells were stained with a Lamin B2 monoclonal antibody (Product # 33-2100) at a concentration of 10 µg/mL for 1 hour at room temperature, and then incubated with a Goat anti-Mouse IgG (H+L) Superclonal Secondary Antibody, Alexa Fluor® 488 conjugate (Product # A28175) at a dilution of 1:1000 for 1 hour at room temperature (green). Nuclei (blue) were stained with Hoechst 33342 dye (Product # 62249). Images were taken on a Thermo Scientific ToxInsight at 20X magnification.

Supportive validation
- Submitted by
- Invitrogen Antibodies (provider)
- Main image
- Experimental details
- NULL
- Submitted by
- Invitrogen Antibodies (provider)
- Main image
- Experimental details
- NULL
- Submitted by
- Invitrogen Antibodies (provider)
- Main image

- Experimental details
- NULL
- Submitted by
- Invitrogen Antibodies (provider)
- Main image
- Experimental details
- NULL

- Submitted by
- Invitrogen Antibodies (provider)
- Main image
- Experimental details
- NULL
- Submitted by
- Invitrogen Antibodies (provider)
- Main image
- Experimental details
- NULL

- Submitted by
- Invitrogen Antibodies (provider)
- Main image

- Experimental details
- NULL
- Submitted by
- Invitrogen Antibodies (provider)
- Main image
- Experimental details
- NULL
- Submitted by
- Invitrogen Antibodies (provider)
- Main image
- Experimental details
- NULL

- Submitted by
- Invitrogen Antibodies (provider)
- Main image
- Experimental details
- NULL
- Submitted by
- Invitrogen Antibodies (provider)
- Main image
- Experimental details
- NULL
- Submitted by
- Invitrogen Antibodies (provider)
- Main image
- Experimental details
- NULL
- Submitted by
- Invitrogen Antibodies (provider)
- Main image
- Experimental details
- NULL

- Submitted by
- Invitrogen Antibodies (provider)
- Main image
- Experimental details
- NULL
- Submitted by
- Invitrogen Antibodies (provider)
- Main image
- Experimental details
- NULL
- Submitted by
- Invitrogen Antibodies (provider)
- Main image

- Experimental details
- NULL
- Submitted by
- Invitrogen Antibodies (provider)
- Main image

- Experimental details
- NULL
- Submitted by
- Invitrogen Antibodies (provider)
- Main image

- Experimental details
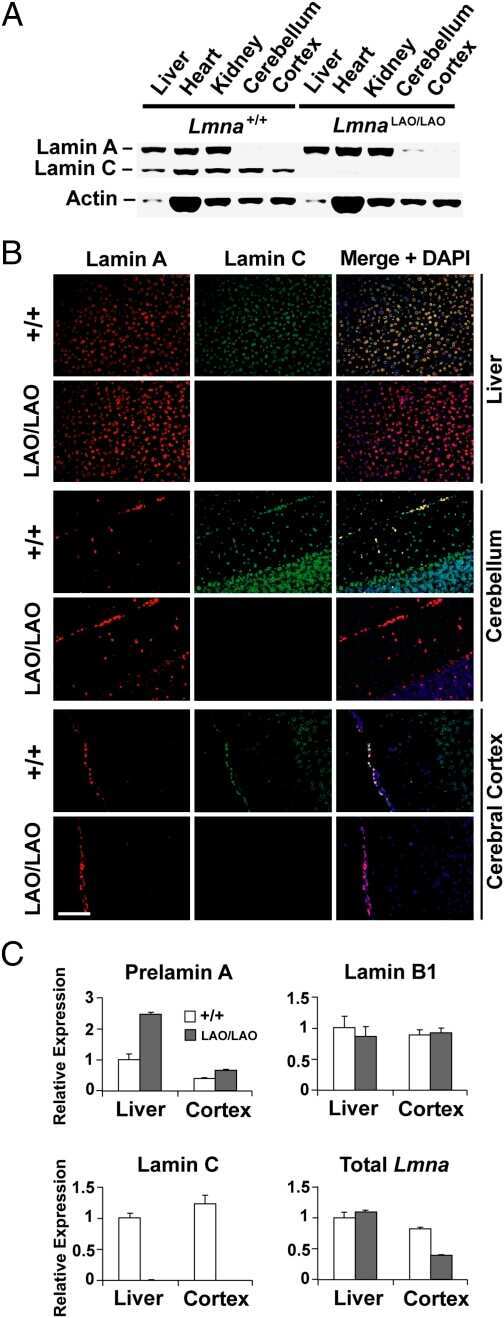
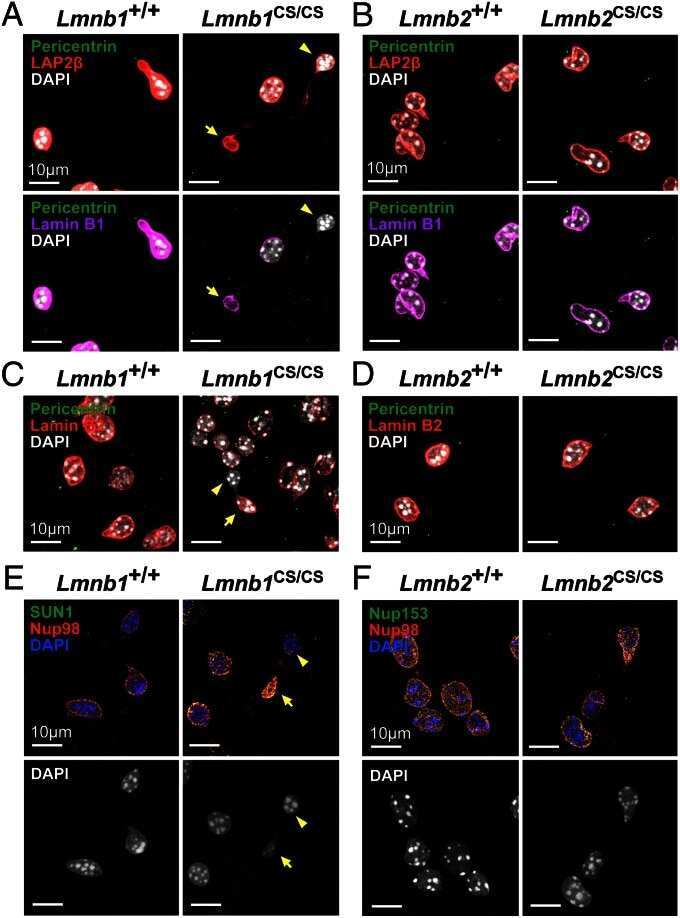
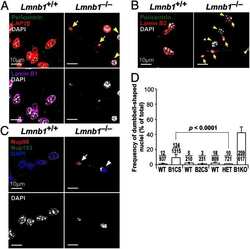
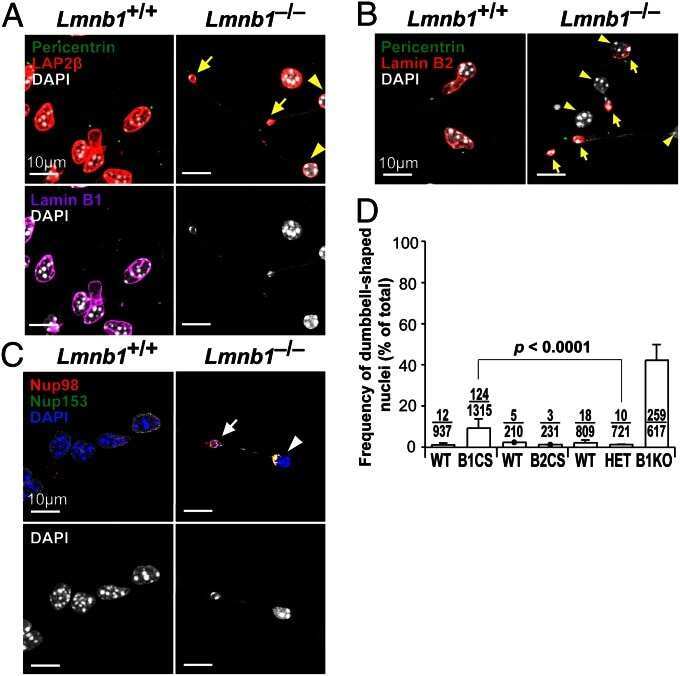
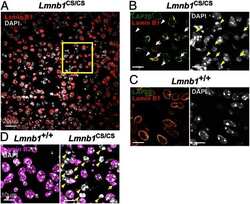
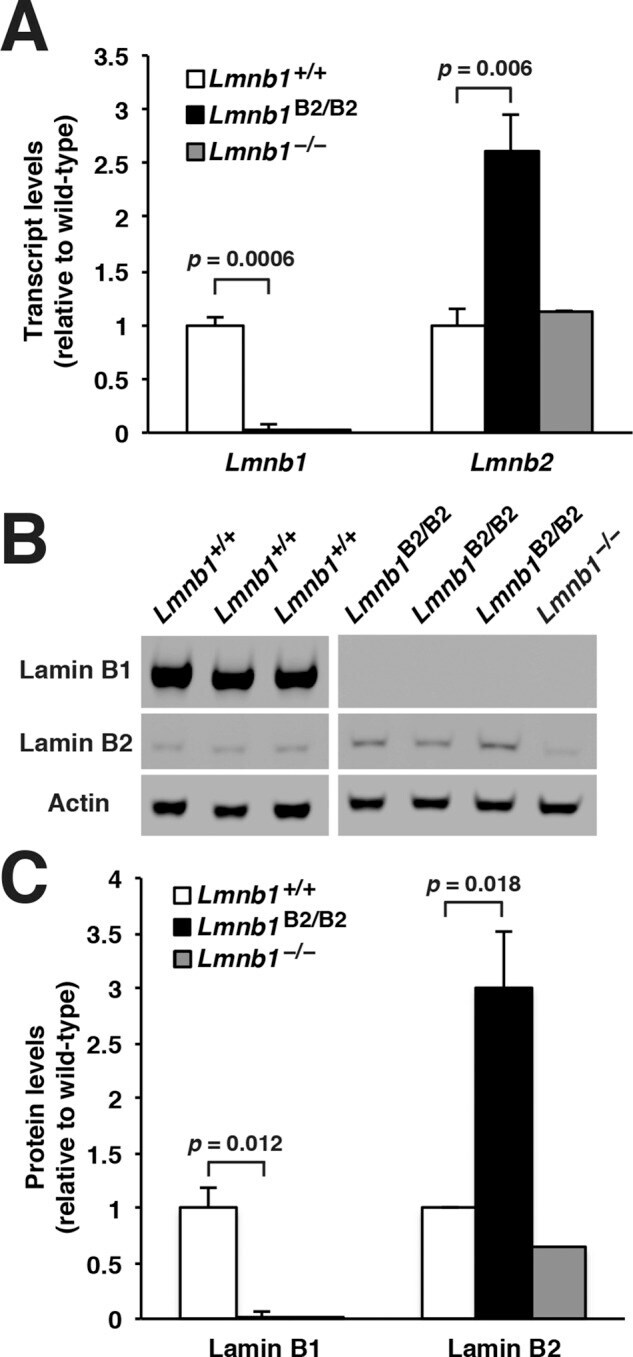
- FIGURE 2: Levels of lamin transcripts and proteins in the cerebral cortex of E18.5 Lmnb1 B2/B2 embryos. (A) Lamin transcript levels in the cerebral cortex of Lmnb1 +/+ , Lmnb1 B2/B2 , and Lmnb1 -/- embryos by quantitative RT-PCR. Transcript levels (mean +- SD) were normalized to cyclophilin A and compared with the levels in Lmnb1 +/+ mice (set at 1.0). Lmnb2 transcript levels in Lmnb1 B2/B2 embryos were higher than those in Lmnb1 +/+ embryos ( p = 0.006). Lmnb1 transcripts were undetectable in Lmnb1 B2/B2 embryos. (B) Western blot of protein extracts from cerebral cortex biopsies of E18.5 Lmnb1 +/+ , Lmnb1 B2/B2 , Lmnb1 -/- embryos (the same embryos analyzed in A). Actin was used as a loading control. (C) Quantification of lamin protein levels for the Western blot in B relative to actin (mean +- SD) and compared with levels in wild-type mice (set at 1.0). Lamin B2 protein levels in the cerebral cortex were higher in Lmnb1 B2/B2 embryos than in Lmnb1 +/+ embryos ( p = 0.018). Lamin B1 was undetectable in Lmnb1 B2/B2 embryos.
- Submitted by
- Invitrogen Antibodies (provider)
- Main image

- Experimental details
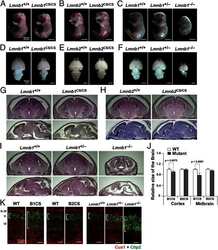
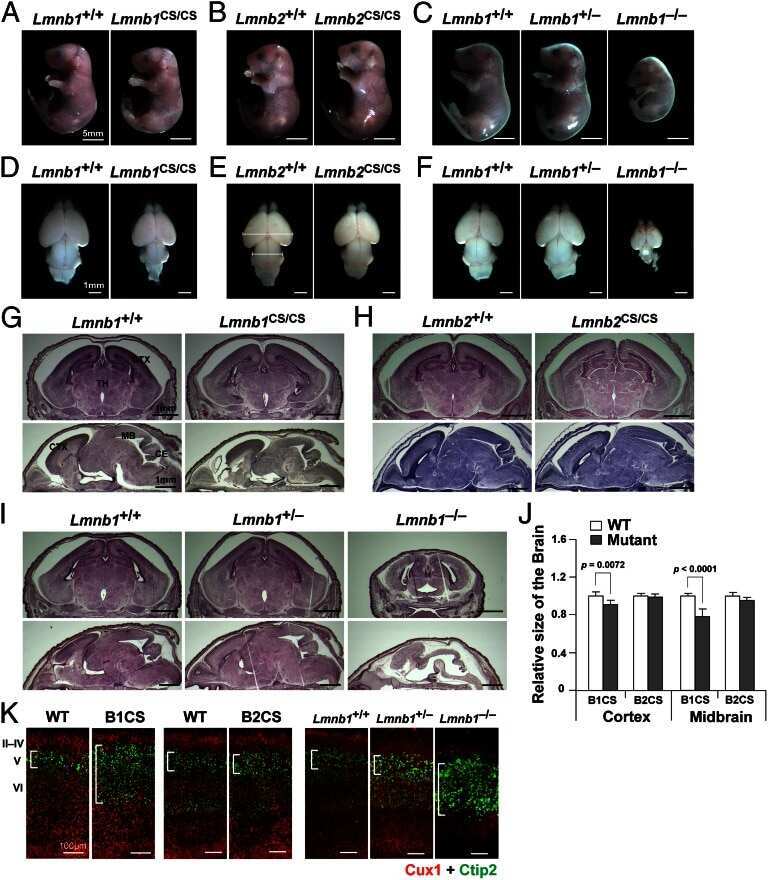
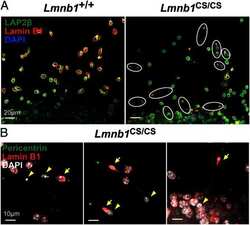
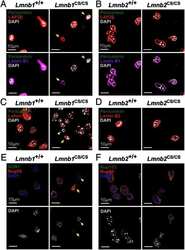
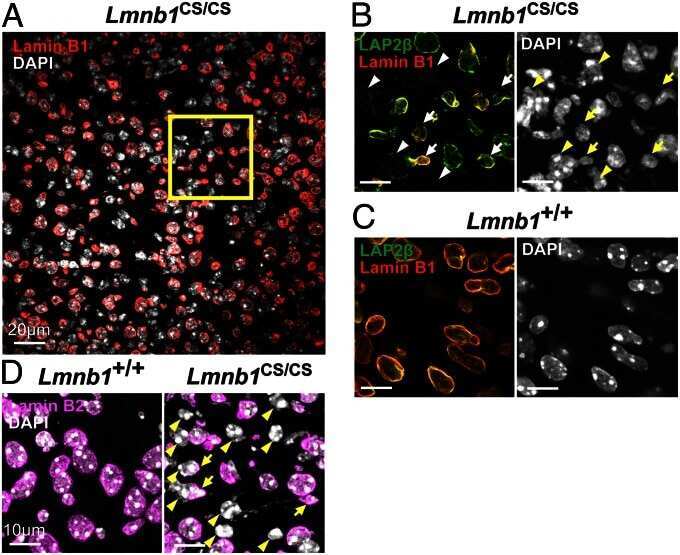
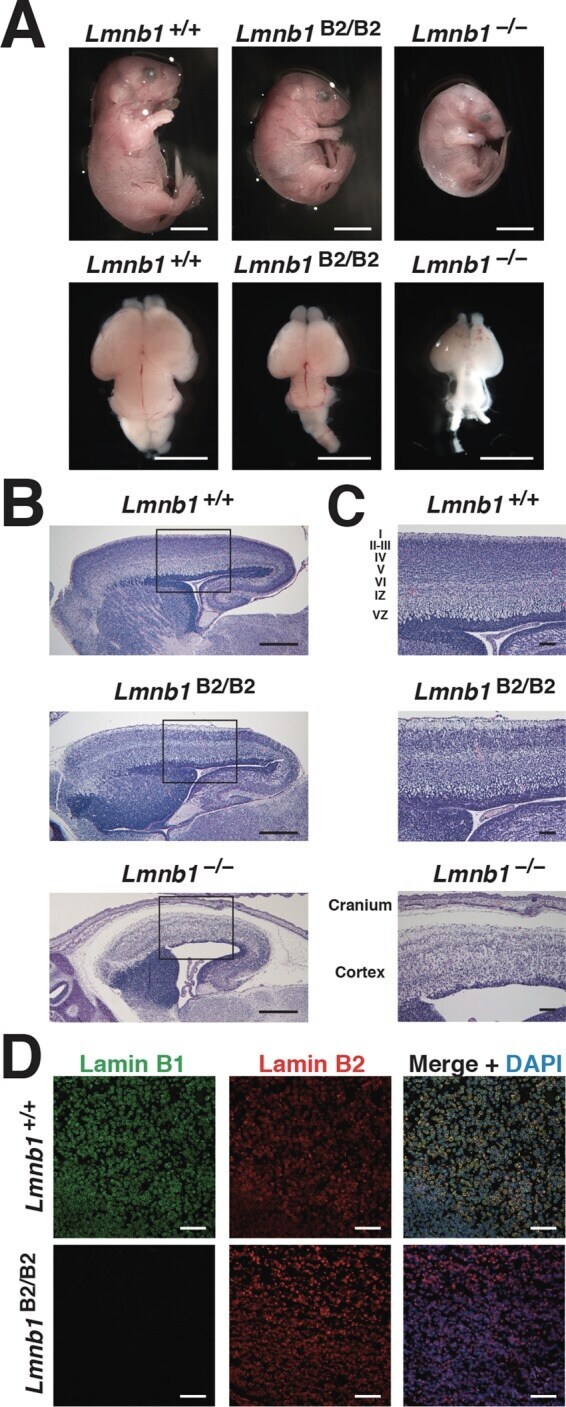
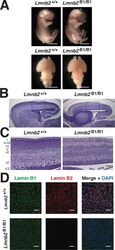
- FIGURE 3: Phenotypes of Lmnb1 B2/B2 mice. (A) Photographs of E18.5 Lmnb1 +/+ , Lmnb1 B2/B2 , and Lmnb1 -/- embryos and the brains from these mice. Scale bar, 2 mm. (B) Hematoxylin and eosin-stained sagittal sections of brains from E18.5 embryos. Scale bar, 500 mum. (C) Higher-magnification images of the boxed areas in B, showing abnormal layering of cortical neurons in Lmnb1 B2/B2 mice. Scale bar, 100 mum. (D) Immunofluorescence microscopy of the putamen in E18.5 Lmnb1 +/+ and Lmnb1 B2/B2 embryos with antibodies against lamin B1 (green) and lamin B2 (red). Merged images show DAPI (blue) staining. Scale bar, 50 mum.
- Submitted by
- Invitrogen Antibodies (provider)
- Main image
- Experimental details
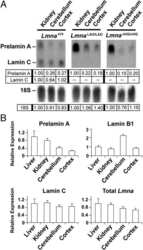
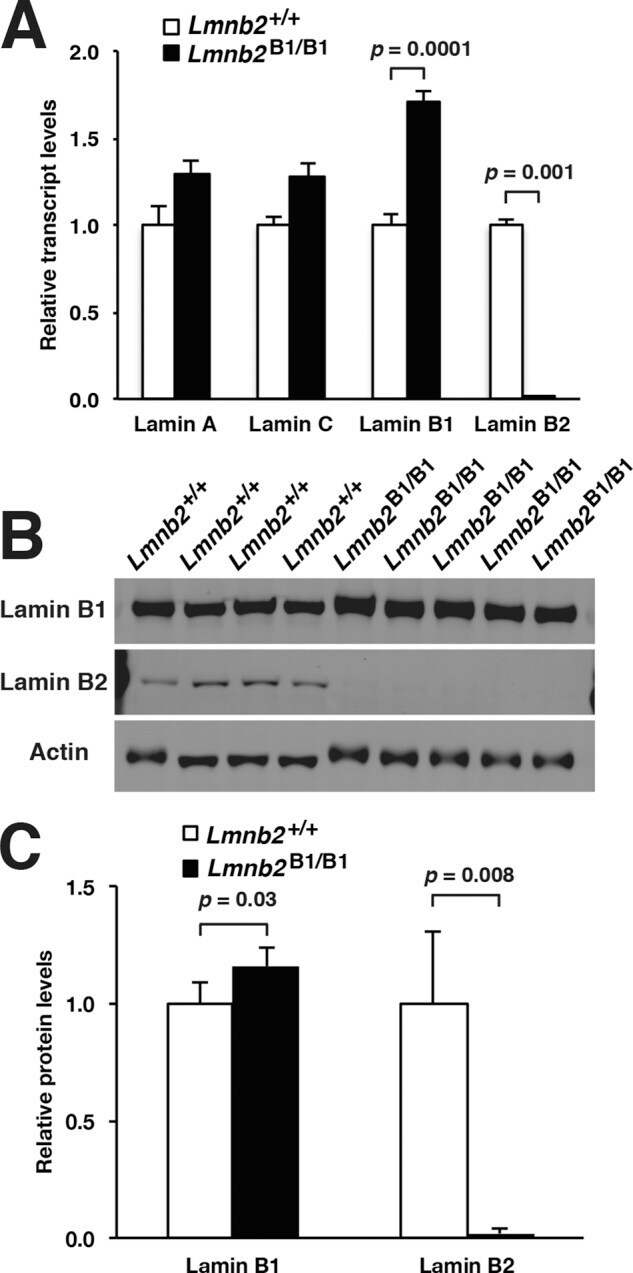
- FIGURE 5: Nuclear lamin expression in the cerebral cortex of E18.5 Lmnb2 B1 / B1 embryos. (A) Lamin transcript levels, as judged by quantitative RT-PCR, in the cerebral cortex of Lmnb2 +/+ and Lmnb2 B1/B1 embryos. Transcript levels (mean +- SD) were normalized to cyclophilin A and compared with the levels in Lmnb2 +/+ mice (set at 1.0). Lmnb1 transcript levels in Lmnb2 B1/B1 embryos were higher than those in Lmnb2 +/+ embryos ( p = 0.001); Lmnb2 transcripts were undetectable ( p = 0.001; Lmnb2 +/+ , n = 4; Lmnb2 B1/B1 , n = 5). (B) Western blot of protein extracts from the cerebral cortex of E18.5 Lmnb2 +/+ and Lmnb2 B1/B1 embryos (the same embryos studied in A). (C) Quantification of lamin B1 and lamin B2 protein levels in the Western blot shown in B relative to actin (mean +- SD) and compared with levels in wild-type controls (set at 1.0). Lamin B1 levels in Lmnb2 B1/B1 embryos were higher than those in Lmnb1 +/+ embryos ( p = 0.039); lamin B2 was undetectable in Lmnb2 B1/B1 embryos ( p = 0.008).
- Submitted by
- Invitrogen Antibodies (provider)
- Main image
- Experimental details
- FIGURE 6: Phenotypes of Lmnb2 B1/B1 mice. (A) Photographs of E18.5 Lmnb1 +/+ and Lmnb2 B1/B1 embryos and their brains. Scale bar, 2 mm. (B) Hematoxylin and eosin-stained sagittal sections of brains from E18.5 embryos. Scale bar, 500 mum. (C) Higher-magnification images of the boxed areas in B, demonstrating abnormalities in the layering of cortical neurons in Lmnb2 B1/B1 mice. Scale bar, 100 mum. (D) Immunofluorescence microscopy of the putamen in E18.5 Lmnb2 +/+ and Lmnb2 B1/B1 embryos with antibodies against lamin B1 (green) and lamin B2 (red). Merged images show DAPI (blue) staining. Scale bar, 50 mum.

- Submitted by
- Invitrogen Antibodies (provider)
- Main image

- Experimental details
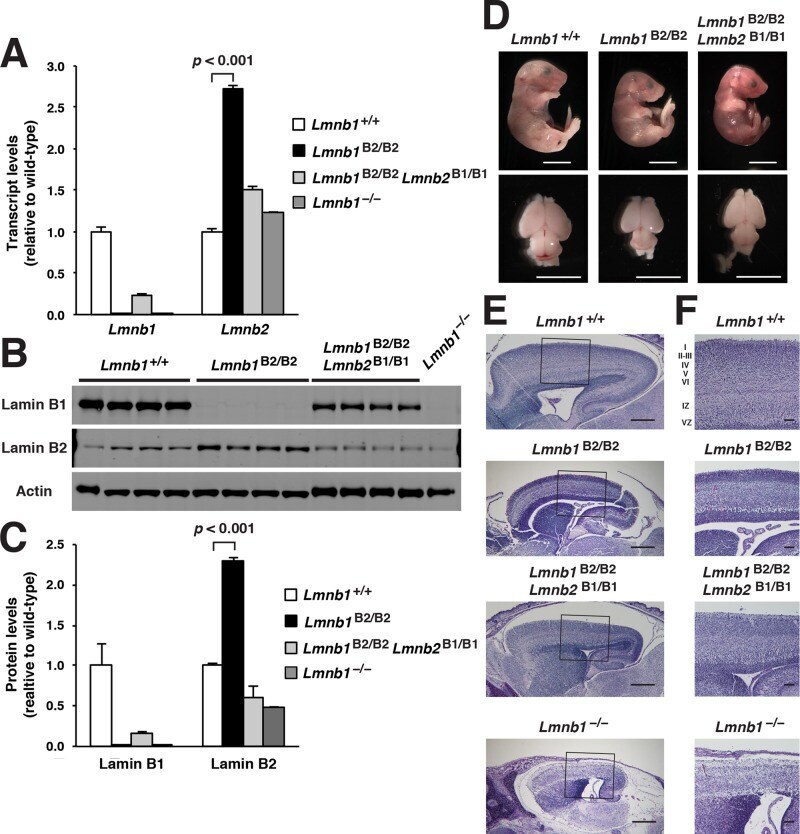
- FIGURE 7: Characterization of Lmnb1 B2/B2 Lmnb2 B1/B1 mice. (A) Levels of lamin transcripts in Lmnb1 +/+ , Lmnb1 B2/B2 , Lmnb1 B2/B2 Lmnb2 B1/B1 , and Lmnb1 -/- embryos. Quantitative RT-PCR analysis of Lmnb1 and Lmnb2 transcript levels in the cerebral cortex of E18.5 embryos. Transcript levels (mean +- SD) were normalized to cyclophilin A and compared with the levels in wild-type mice (set at 1.0). Lmnb1 transcript levels in Lmnb1 B2/B2 Lmnb2 B1/B1 mice ( n = 5) were 23.9% of those in wild-type mice ( n = 4); Lmnb2 transcript levels in Lmnb1 B2/B2 Lmnb2 B1/B1 mice were 51.1% higher than those in wild-type mice; Lmnb2 transcript levels in Lmnb1 B2/B2 mice ( n = 6) were 171% higher than those in wild-type mice. (B) Western blot of protein extracts from the cerebral cortex of E18.5 Lmnb1 B2/B2 , Lmnb1 B2/B2 Lmnb2 B1/B1 , and Lmnb1 -/- embryos and wild-type embryos. (C) Quantification of lamin B1 and lamin B2 protein levels in the Western blot shown in B relative to actin (mean +- SD) and compared with wild-type controls (set at 1.0). Lamin B1 was undetectable in Lmnb1 B2/B2 embryos. Lamin B1 levels in Lmnb1 B2/B2 Lmnb2 B1/B1 embryos were only 16.4% of those in wild-type mice. (D) Photographs of E18.5 wild-type, Lmnb1 B2/B2 , and Lmnb1 B2/B2 Lmnb2 B1/B1 embryos along with the brains from the same mice. Scale bar, 2 mm. (E) Hematoxylin and eosin-stained sagittal sections of brains from E18.5 embryos. Scale bar, 500 mum. (F) Higher-magnification images of the boxed areas in E. Scal
- Submitted by
- Invitrogen Antibodies (provider)
- Main image

- Experimental details
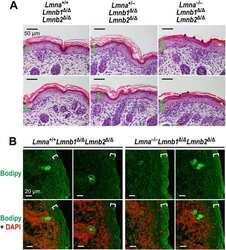
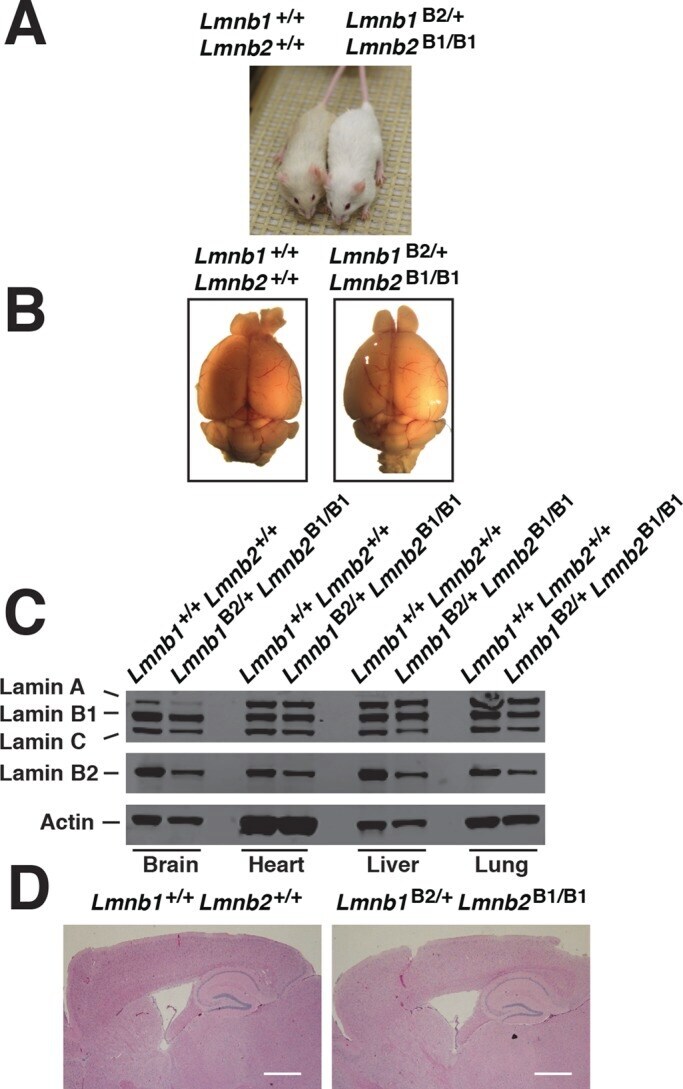
- FIGURE 8: Characterization of Lmnb1 B2/+ Lmnb2 B1/B1 mice. (A) Lmnb1 B2/+ Lmnb2 B1/B1 and wild-type mice at 10 mo of age. (B) Mouse brains from the same mice at 10 mo of age. (C) Western blots of nuclear lamins in tissue extracts from adult Lmnb1 B2/+ Lmnb2 B1/B1 and wild-type mice. (D) Hematoxylin and eosin-stained sagittal brain sections of adult mice. Scale bar, 1 mm.
- Submitted by
- Invitrogen Antibodies (provider)
- Main image
- Experimental details
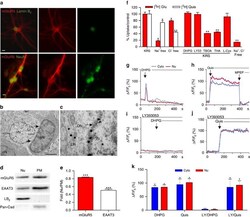
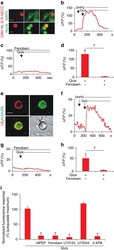
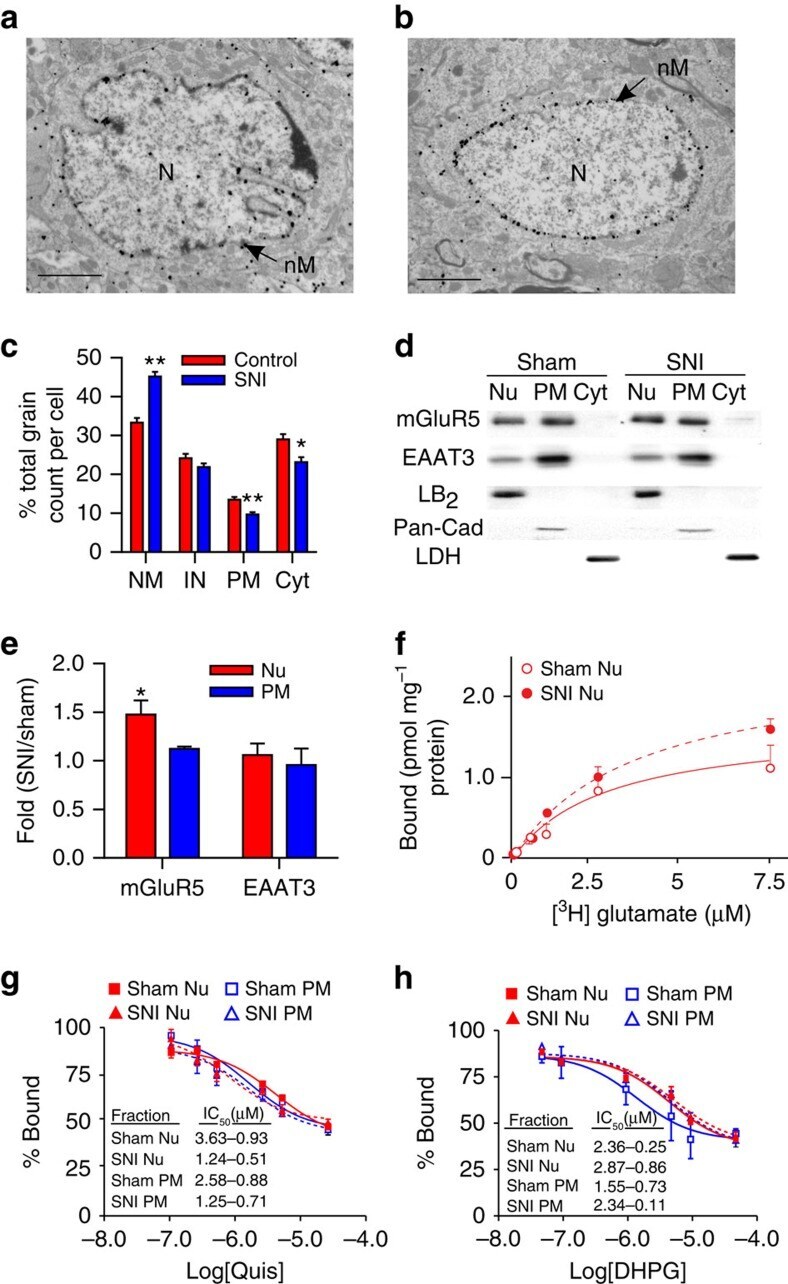
- Figure 1 Functional nuclear mGluR5 in SCDH neurons. Fluorescence-microscopy showing ( a ) mGluR5 (red), Lamin-B 2 (green-upper) or NeuN-IR (green-lower) in cultured rat SCDH neurons. Scale bar, 10 mum. ( b , c ) Electron-micrographs showing mGluR5-immunogold in L4-L6 SCDH. Scale bar, ( b ) 2 mum, ( c ) 0.5 mum. mGluR5 is detected in cytoplasm and neuronal nuclei (nN), and on nuclear (white arrows) and plasma (black arrows) membranes, but not glial nuclei (oN, oligodendrocyte nucleus) ( b ). mGluR5 is on inner (IN), and outer (ON), nuclear membranes (black arrows) and on endoplasmic reticular (ER) membranes ( c ). ( d ) Western blots of mGluR5, EAAT3, Lamin-B 2 (LB 2 ), and Pan-cadherin (Pan-Cad) in nuclear (Nu), or plasma membrane (PM) fractions of rat SCDH (L4-L6), quantified in e . Data shown represent the mean of three experiments, Student's t -test *** P

- Submitted by
- Invitrogen Antibodies (provider)
- Main image
- Experimental details
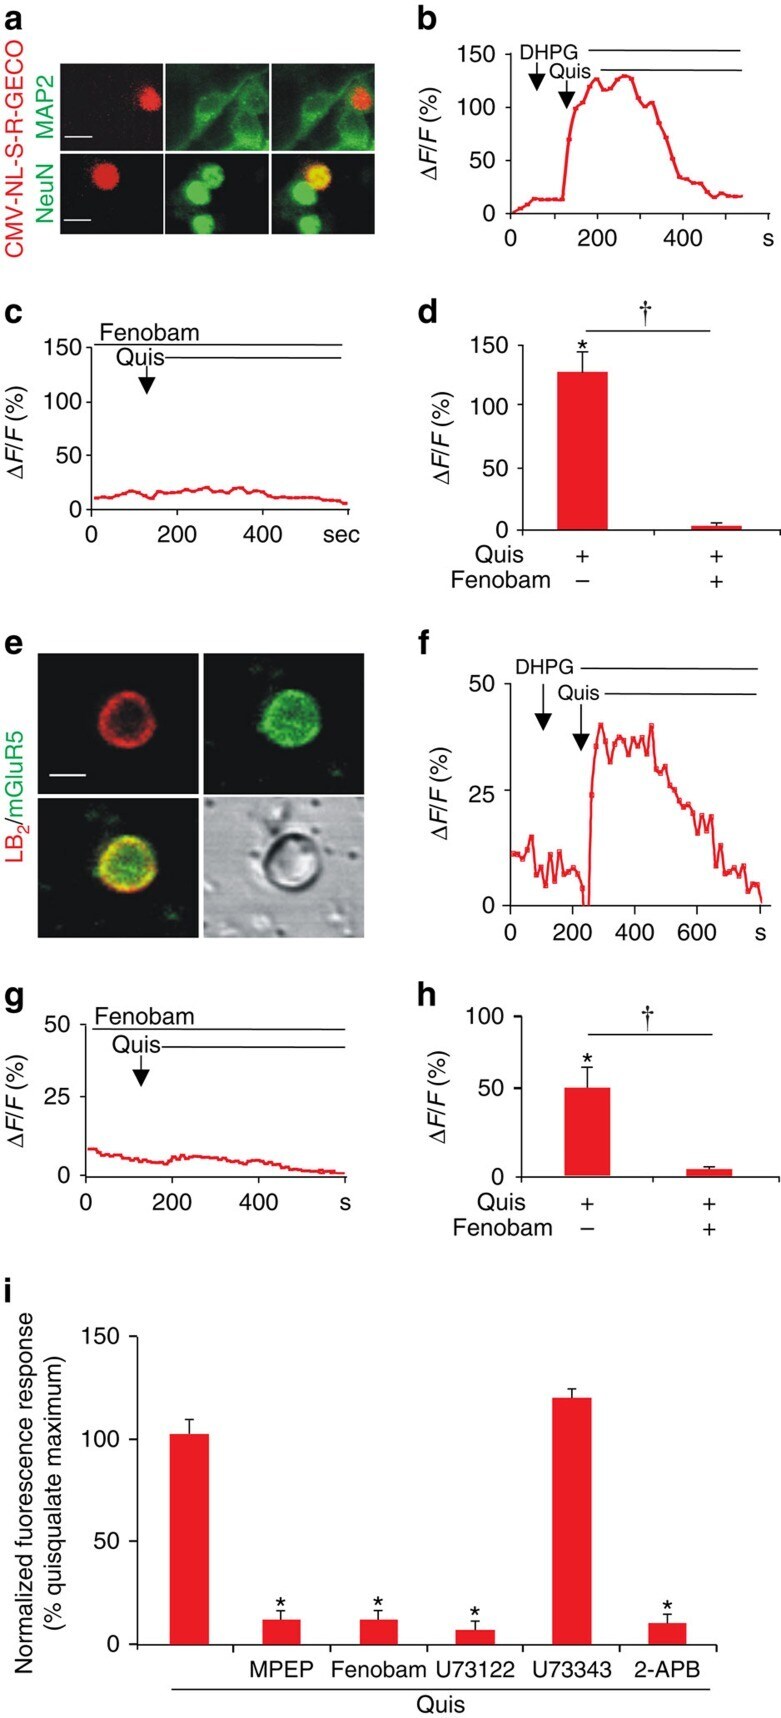
- Figure 2 mGluR5-mediated nuclear Ca 2+ changes in SCDH neurons or isolated nuclei. Cultured rat SCDH neurons were transfected with the nuclear-targeted red fluorescent, genetically encoded Ca 2+ indicator, CMV-NL-S-R-GECO, on DIV6 and then immunostained or imaged in real time on DIV9. ( a ) Images of SCDH neurons transfected with CMV-NL-S-R-GECO (red) expressed in neuronal cells (as indicated by MAP2 staining; green in the upper panel) and colocalized with the neuronal nuclear marker, NeuN (green in the lower panel) Scale bar, 10 mum. ( b ) Representative trace of nuclear Ca 2+ responses to agonist stimulation. DHPG application (100 muM) did not induce Ca 2+ changes whereas quisqualate (Quis, 10 muM) application resulted in sustained nuclear Ca 2+ rises. ( c ) Fenobam (10 muM) blocked Quis-induced nuclear Ca 2+ responses. ( d ) Compiled data from peak Delta F / F o (%) with N =22 identified nuclei ( b ) and N =50 nuclei ( c ) Student's t -test, * P
- Submitted by
- Invitrogen Antibodies (provider)
- Main image

- Experimental details
- Figure 3 Nerve injury increases SCDH nuclear mGluR5. Electron-micrographs showing increased nuclear mGluR5 in a SCDH neuron of spared-nerve injury (SNI) ( b ) versus sham rat ( a ). (N, nucleus; nM, nuclear membrane). Scale bar, ( a , b ) 2 mum. ( c ) Percentage of mGluR5-labelled grains on plasma (PM) or nuclear (NM) membranes, or within cytoplasm (Cyt) or the intranuclear (IN) compartment in SNI and control rats (103 somata were counted from three SNI rats and 86 somata were counted from two control rats, ANOVA * P
- Submitted by
- Invitrogen Antibodies (provider)
- Main image
- Experimental details
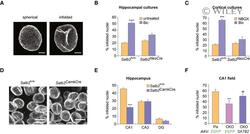
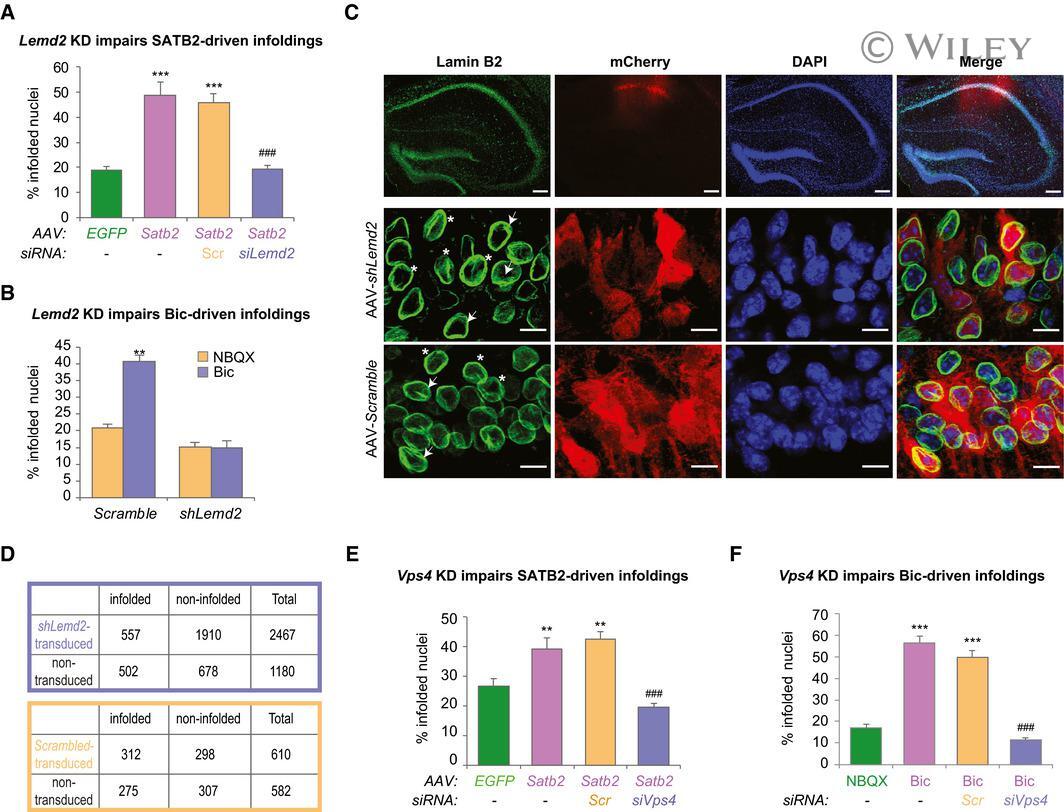
- 2 Figure SATB2 determines nuclear envelope structural plasticity in neurons Representative images of z -axis projected stacks of confocal images of hippocampal neuronal nuclei immunostained for Lamin B2. Examples of spherical and infolded nuclei are shown. Scale bars: 3 mum. Activity-induced formation of nuclear infoldings is abolished in SATB2-deficient hippocampal neurons. Bic-induced AP bursting for 1 h caused a significant increase in the percentage of infolded nuclei in DIV10 hippocampal cultures derived from Satb2 flx/flx mice but not from Satb2 flx/flx ::Nes-Cre mice ( Satb2 NesCre ) ( n = 6 independent primary cultures, two-way ANOVA, F 1,20 = 9.51, significant interaction P = 0.0058, simple main effects analysis, Satb2 flx/flx cultures, Bic-treated vs untreated P = 0.0000043, Satb2 NesCre cultures, Bic-treated vs untreated P > 0.05, adjustment for multiple comparisons: Bonferroni, number of analyzed nuclei: Satb2 flx/flx cultures, untreated--680, Satb2 flx/flx cultures, Bic-treated--711, Satb2 NesCre , untreated--755, Satb2 NesCre , Bic-treated--720). Data are presented as mean +- SEM, *** P < 0.001. Activity-induced formation of nuclear infoldings is impaired in SATB2-deficient cortical neurons. DIV14 cortical cultures form Satb2 flx/flx and Satb2 NesCre mice were silenced with NBQX for 1 h followed by stimulation with Bic for 1 h. The percentage of infolded nuclei following AP bursting was increased in control Satb2 flx/flx cultures but not in SATB2-deficient cultu

- Submitted by
- Invitrogen Antibodies (provider)
- Main image

- Experimental details
- 3 Figure SATB2 cooperates with LEMD2 and the AAA-ATPase VPS4 to regulate nuclear infolding formation Nuclear infolding triggered by SATB2 overexpression requires LEMD2. Analysis of the percentage of infolded nuclei in DIV10 hippocampal neurons upon Satb2 overexpression and Lemd2 knockdown. AAV-SATB2 - transduced neurons (both non-transfected and scrambled siRNA-transfected, Scr) exhibited higher percentage of infolded nuclei compared to AAV-EGFP - transduced neurons. In contrast, LEMD2-depleted AAV-SATB2 - transduced cultures showed similar percentage of infolded nuclei to AAV-EGFP - transduced neurons ( n = 3-4 independent primary cultures; one-way ANOVA F 3,11 = 30.982, P = 0.000011; Hochberg post hoc test, AAV-EGFP vs AAV-SATB2 P = 0.0001, AAV-EGFP vs AAV-SATB2 + S cr P = 0.0001, AAV-EGFP vs AAV-SATB2 + siLemd2 P = 0.9999, AAV-SATB2 + Scr vs AAV-SATB2 + siLemd2 P = 0.0001). Number of nuclei analyzed: 460 (AAV-EGFP), 466 (AAV-SATB2), 537 (AAV-SATB2 + Scr) , 597 (AAV-SATB2 + siLem2). Data are presented as mean +- SEM, *** P < 0.001 compared to AAV-EGFP; ### P < 0.001 compared to AAV-SATB2 + Scr . Activity-induced formation of nuclear infoldings is impaired in LEMD2-depleted cortical neurons. Bic-triggered AP bursting for 1 h caused a significant increase in the percentage of infolded nuclei in cortical neurons transduced with AAV-scrambled but not with AAV- shLemd2 virus ( n = 5 independent primary cultures, two-way ANOVA, F 1,16 = 8.35, significant interaction P = 0.0107, s
- Submitted by
- Invitrogen Antibodies (provider)
- Main image

- Experimental details
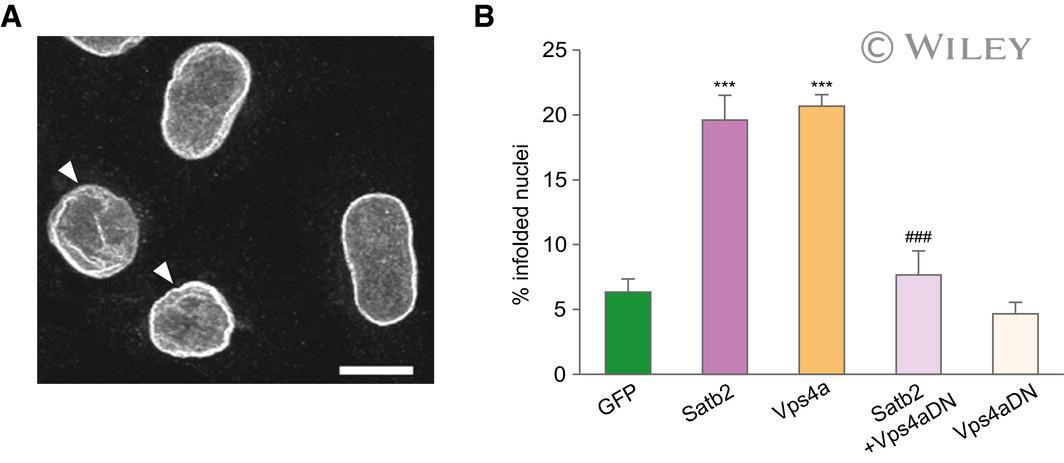
- EV3 Figure 5 ESCRT-III/VPS4 complex is required for SATB2-triggered nuclear infolding formation in HeLa cells Confocal image ( z -axis projection of confocal image stack) of HeLa cell nuclei immunostained for Lamin B2. Arrowheads indicate infolded nuclei. Scale bar: 10 mum. Percentage of infolded nuclei in HeLa cells after ectopic expression of Satb2 , Vps4a-GFP , a dominant-negative Vps4a mutant fused to GFP ( Vps4aDN-GFP ), and a combination of Satb2 and Vps4aDN-GFP . The number of infolded nuclei is significantly increased in both Satb 2- and Vps4a -transfected cells compared with GFP-transfected cells. Expression of the dominant-negative Vps4a mutant abolished the increase in the number of infolded nuclei induced by SATB2, n = 3-5 independent experiments, ANOVA followed by Tukey post hoc test, F 4,14 = 25.4, GFP vs Satb2 , P < 0.0001, GFP vs Vps4a , P < 0.0001, Satb2 vs Satb2 + Vps4aDN , P = 0.0006. Number of analyzed nuclei: 521 ( GFP ), 586 ( Satb2 ), 302 ( Vps4a ), 345 ( Satb2 / Vps4aDN ), 317 ( Vps4aDN ). Data are presented as mean +- SEM, *** P < 0.0001 compared to GFP ; ### P < 0.001 compared to Satb2 .
- Submitted by
- Invitrogen Antibodies (provider)
- Main image

- Experimental details
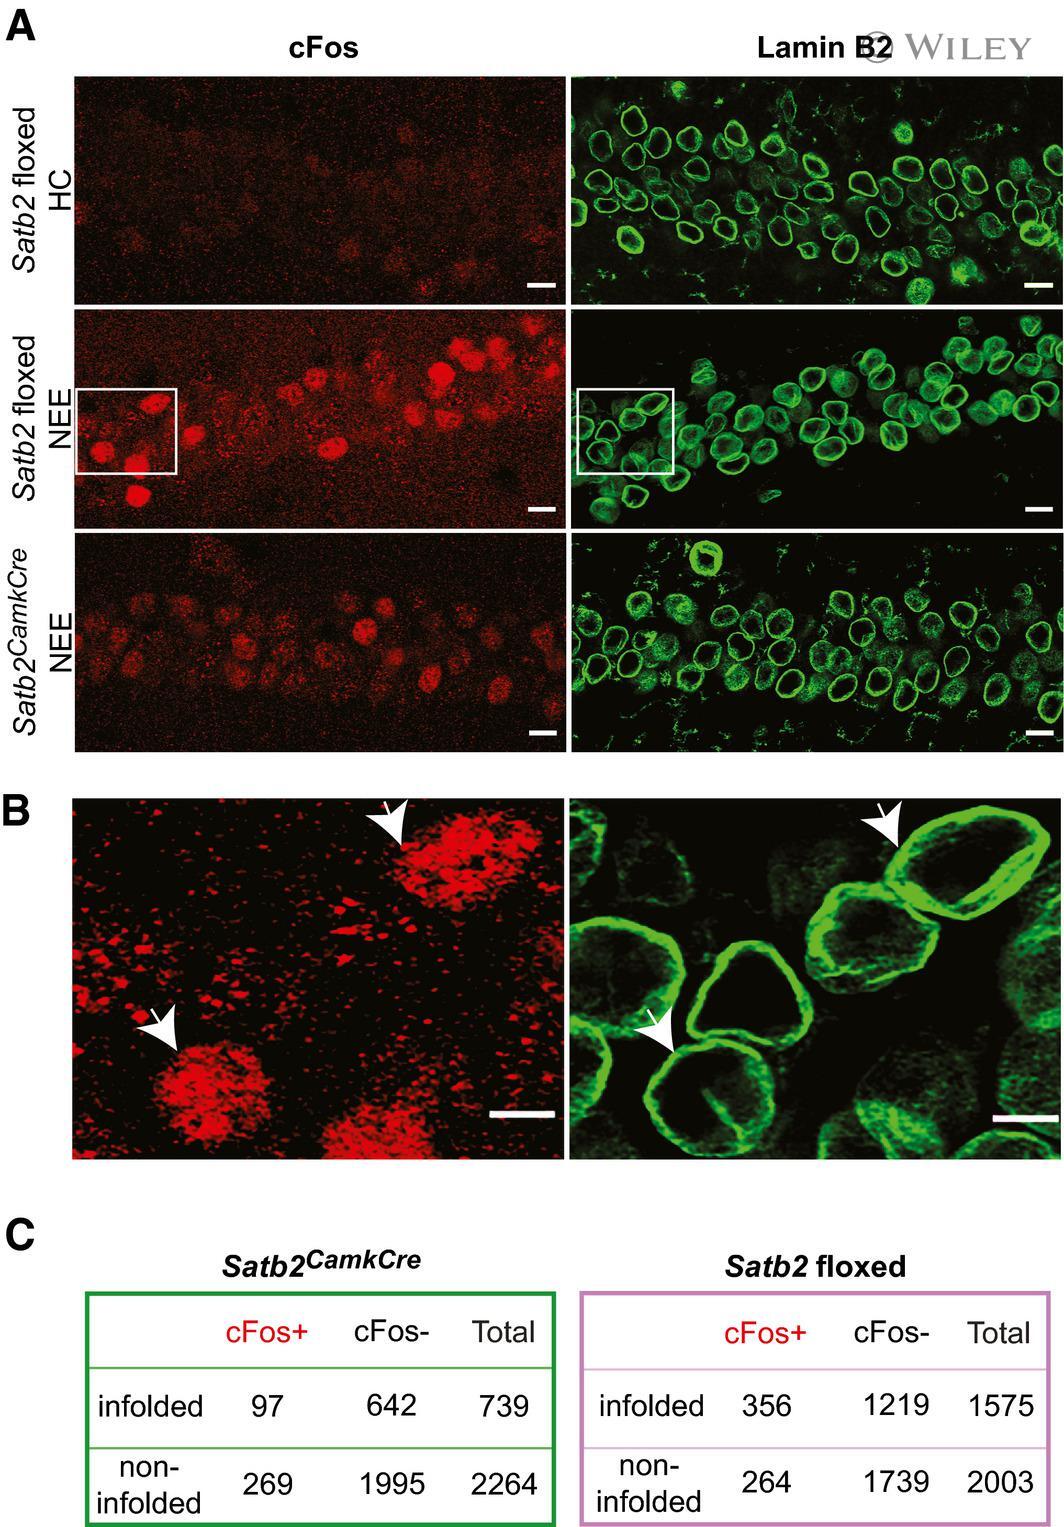
- 5 Figure NEE-activated cFos-positive neurons are more likely than non-active neurons to bear nuclear infoldings in Satb2 floxed but not in Satb2 CamCre mice Representative confocal images (Z-axis projection) of CA1 pyramidal neurons of: (top panel) Satb2 floxed mice ( n = 3) maintained in their home cages (HC), (middle panel) Satb2 floxed mice ( n = 4) subjected to NEE for 1.5 h, (bottom panel) Satb2 CamkCre mice ( n = 5) exposed to NE for 1.5 h. Brain sections were stained for cFos and Lamin B2. Scale bars: 10 mum. Higher magnification views of boxed areas in (A) (middle panel). Arrows show examples of infolded, cFos-positive nuclei of the CA1 field of Satb2 floxed mice subjected to NEE. Scale bars: 5 mum. 2 x 2 contingency tables showing the number of analyzed CA1 pyramidal neuron nuclei grouped by category: cFos + /cFos - , infolded/non-infolded in Satb2 CKO mice (left) and Satb2 floxed mice (right). In floxed animals exposed to novel environment, cFos-positive nuclei were more likely than cFos-negative nuclei to bear infoldings, chi-square test of independence, chi 2 (1, N = 3578) = 54.649, P < 0.00001. No significant relationship between cFos expression and nuclear infoldings was identified for the CA1 neurons of Satb2 CamkCre mice (chi 2 (1, N = 3003) = 0.80, P = 0.3693). Source data are available online for this figure.
- Submitted by
- Invitrogen Antibodies (provider)
- Main image
- Experimental details
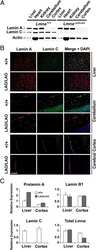
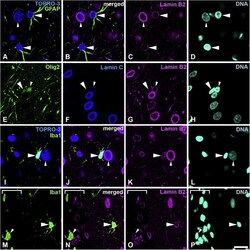
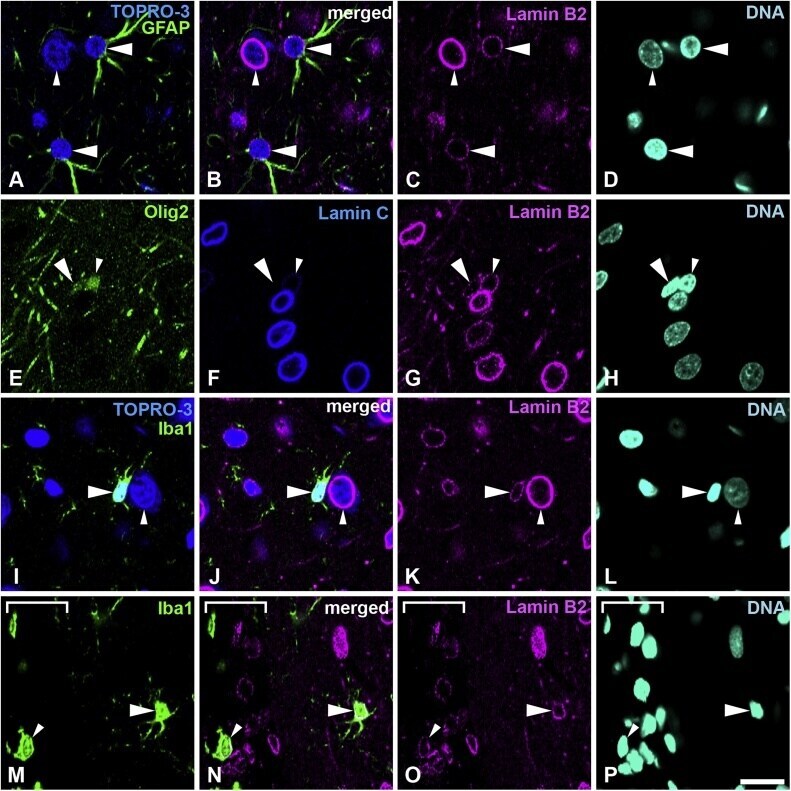
- Fig. 4 Distribution of lamin B2 in the cerebral cortex. Sections were stained with antibodies against lamin B2 (magenta) and several cell-type specific markers. A-D, Sections were stained with anti-GFAP antibody (green) and counterstained with TOPRO-3 for nucleic acid detection. Large arrowheads indicate astrocytes. Small arrowheads indicate neurons; also indicated by cytoplasm stained with TOPRO-3. E-H, Sections were stained with antibodies against Olig2 (green) and lamin C (blue). Large arrowheads indicate an oligodendrocyte progenitor cell, which is negative for lamin C. Small arrowheads indicate mature oligodendrocytes. I-L, Sections were stained with an anti-Iba-1 antibody (green) and were also counterstained with TOPRO-3 for nucleic acid detection. Large arrowheads indicate microglia. Small arrowheads indicate a neuron; these are also indicated with cytoplasm that is stained with TOPRO-3. M-P, Sections were stained with an anti-Iba-1 antibody (green). Large arrowheads indicate microglia. Small arrowheads indicate a macrophage in the meninges. The meninges were identified under bright field and shown with a white line bracket. Specimens were fixed using 4% formaldehyde combined with heat treatment. DNA was stained with Hoechst 33258 (cyan). Scale bar, 20 mum. Images of single optical sections (A-P) (For interpretation of the references to colour in this figure legend, the reader is referred to the web version of this article). Fig. 4
- Submitted by
- Invitrogen Antibodies (provider)
- Main image

- Experimental details
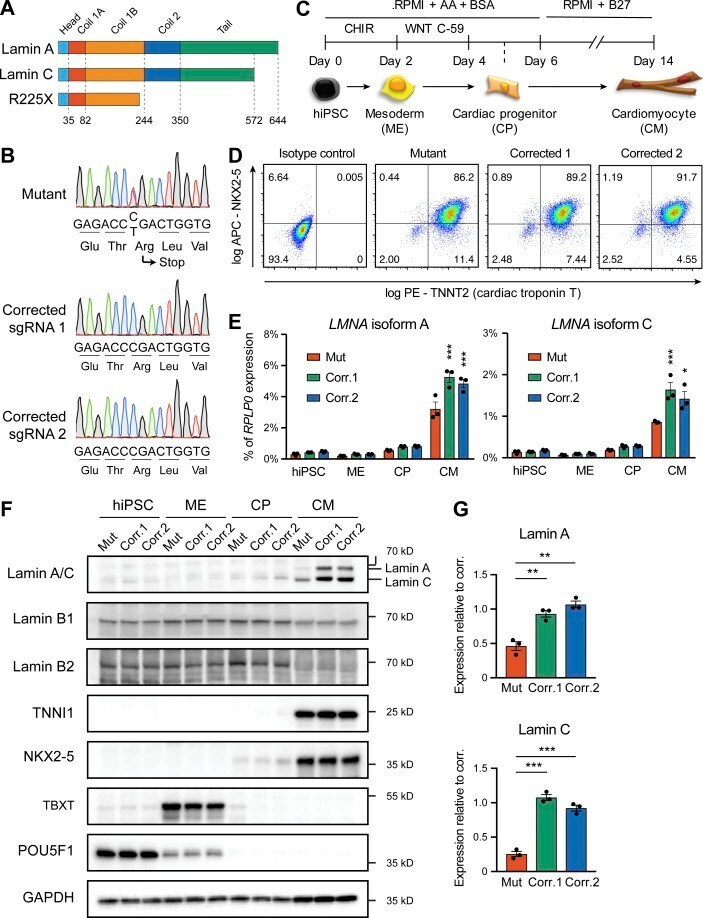
- Figure 1. Generation of lamin A/C haploinsufficient hiPSC-CMs. (A) Predicted effect of the LMNA R225X mutation on the two splicing products lamin A and C. (B) Sanger sequencing of LMNA exon 4 in hiPSCs with heterozygous R225X mutation (top), or in hiPSCs obtained after CRISPR/Cas9-based scarless correction of the mutation (bottom). (C) Schematic of the protocol for step-wise directed differentiation of hiPSC-CMs. CHIR, CHIR-99021; AA, ascorbic acid. (D) Quantification of cardiac differentiation efficiency by flow cytometry for TNNT2 and NKX2-5 on hiPSC-CMs at day 14 of differentiation. (E) RT-qPCR analyses at the indicated stages of hiPSC-CM differentiation (see panel C). Differences versus mutant were calculated by two-way ANOVA with post hoc Holm-Sidak binary comparisons (*, P < 0.05; ***, P < 0.001; n = 3 differentiations; average +- SEM). (F) Representative Western blot for A- and B-type lamins and differentiation markers during iPSC-CM differentiation. (G) Quantification of lamin A/C expression in hiPSC-CMs from Western blot densitometries. Differences versus mutant were calculated by one-way ANOVA with post hoc Holm-Sidak binary comparisons (**, P < 0.01; ***, P < 0.001; n = 3 differentiations; average +- SEM). Throughout the figure (and in all other figures), Mut or Mutant indicates LMNA R225X hiPSCs, and Corr.1/2 or Corrected 1/2 indicates the two isogenic corrected control LMNA R225R hiPSC lines.