Antibody data
- Antibody Data
- Antigen structure
- References [13]
- Comments [0]
- Validations
- Immunocytochemistry [5]
- Immunohistochemistry [2]
- Other assay [12]
Submit
Validation data
Reference
Comment
Report error
- Product number
- PA1-843 - Provider product page

- Provider
- Invitrogen Antibodies
- Product name
- NCoR2 Polyclonal Antibody
- Antibody type
- Polyclonal
- Antigen
- Other
- Description
- PA1-843 detects silencing mediator of retinoic acid and thyroid hormone receptor (SMRT) from human and mouse cells. PA1-843 has been successfully used in Western blot, ICC/IF and immunohistochemistry (paraffin) procedures. By Western blot, this antibody detects an ~250 kDa protein representing SMRT from HeLa cell nuclear extracts. The PA1-843 antigen is His-tagged fusion protein corresponding to amino acid residues 95-565 from human SMRT.
- Reactivity
- Human, Mouse
- Host
- Rabbit
- Isotype
- IgG
- Vial size
- 100 µg
- Concentration
- 1 mg/mL
- Storage
- -20° C, Avoid Freeze/Thaw Cycles
Submitted references CRISPR/Cas9 genome editing reveals an essential role for basigin in maintaining a nonkeratinized squamous epithelium in cornea.
TBL1XR1 Mutations Drive Extranodal Lymphoma by Inducing a Pro-tumorigenic Memory Fate.
ARNT2 Tunes Activity-Dependent Gene Expression through NCoR2-Mediated Repression and NPAS4-Mediated Activation.
Autoregulatory loop of nuclear corepressor 1 expression controls invasion, tumor growth, and metastasis.
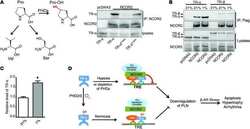
PHD2/3-dependent hydroxylation tunes cardiac response to β-adrenergic stress via phospholamban.
NCoR1 and SMRT play unique roles in thyroid hormone action in vivo.
Thyroid hormone signaling in vivo requires a balance between coactivators and corepressors.
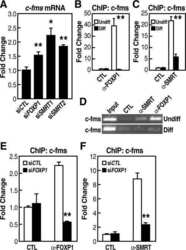
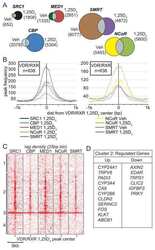
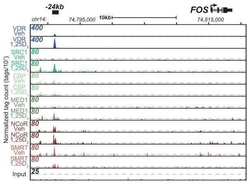
Corepressors (NCoR and SMRT) as well as coactivators are recruited to positively regulated 1α,25-dihydroxyvitamin D3-responsive genes.
A FOXO3-IRF7 gene regulatory circuit limits inflammatory sequelae of antiviral responses.
A downstream intergenic cluster of regulatory enhancers contributes to the induction of CYP24A1 expression by 1alpha,25-dihydroxyvitamin D3.
Cooperative regulation in development by SMRT and FOXP1.
Ataxin 1, a SCA1 neurodegenerative disorder protein, is functionally linked to the silencing mediator of retinoid and thyroid hormone receptors.
Arsenic trioxide is a potent inhibitor of the interaction of SMRT corepressor with Its transcription factor partners, including the PML-retinoic acid receptor alpha oncoprotein found in human acute promyelocytic leukemia.
Woodward AM, Feeley MN, Rinaldi J, Argüeso P
FASEB bioAdvances 2021 Nov;3(11):897-908
FASEB bioAdvances 2021 Nov;3(11):897-908
TBL1XR1 Mutations Drive Extranodal Lymphoma by Inducing a Pro-tumorigenic Memory Fate.
Venturutti L, Teater M, Zhai A, Chadburn A, Babiker L, Kim D, Béguelin W, Lee TC, Kim Y, Chin CR, Yewdell WT, Raught B, Phillip JM, Jiang Y, Staudt LM, Green MR, Chaudhuri J, Elemento O, Farinha P, Weng AP, Nissen MD, Steidl C, Morin RD, Scott DW, Privé GG, Melnick AM
Cell 2020 Jul 23;182(2):297-316.e27
Cell 2020 Jul 23;182(2):297-316.e27
ARNT2 Tunes Activity-Dependent Gene Expression through NCoR2-Mediated Repression and NPAS4-Mediated Activation.
Sharma N, Pollina EA, Nagy MA, Yap EL, DiBiase FA, Hrvatin S, Hu L, Lin C, Greenberg ME
Neuron 2019 Apr 17;102(2):390-406.e9
Neuron 2019 Apr 17;102(2):390-406.e9
Autoregulatory loop of nuclear corepressor 1 expression controls invasion, tumor growth, and metastasis.
Martínez-Iglesias OA, Alonso-Merino E, Gómez-Rey S, Velasco-Martín JP, Martín Orozco R, Luengo E, García Martín R, Ibáñez de Cáceres I, Fernández AF, Fraga MF, González-Peramato P, Varona C, Palacios J, Regadera J, Aranda A
Proceedings of the National Academy of Sciences of the United States of America 2016 Jan 19;113(3):E328-37
Proceedings of the National Academy of Sciences of the United States of America 2016 Jan 19;113(3):E328-37
PHD2/3-dependent hydroxylation tunes cardiac response to β-adrenergic stress via phospholamban.
Xie L, Pi X, Townley-Tilson WH, Li N, Wehrens XH, Entman ML, Taffet GE, Mishra A, Peng J, Schisler JC, Meissner G, Patterson C
The Journal of clinical investigation 2015 Jul 1;125(7):2759-71
The Journal of clinical investigation 2015 Jul 1;125(7):2759-71
NCoR1 and SMRT play unique roles in thyroid hormone action in vivo.
Shimizu H, Astapova I, Ye F, Bilban M, Cohen RN, Hollenberg AN
Molecular and cellular biology 2015 Feb;35(3):555-65
Molecular and cellular biology 2015 Feb;35(3):555-65
Thyroid hormone signaling in vivo requires a balance between coactivators and corepressors.
Vella KR, Ramadoss P, Costa-E-Sousa RH, Astapova I, Ye FD, Holtz KA, Harris JC, Hollenberg AN
Molecular and cellular biology 2014 May;34(9):1564-75
Molecular and cellular biology 2014 May;34(9):1564-75
Corepressors (NCoR and SMRT) as well as coactivators are recruited to positively regulated 1α,25-dihydroxyvitamin D3-responsive genes.
Meyer MB, Pike JW
The Journal of steroid biochemistry and molecular biology 2013 Jul;136:120-4
The Journal of steroid biochemistry and molecular biology 2013 Jul;136:120-4
A FOXO3-IRF7 gene regulatory circuit limits inflammatory sequelae of antiviral responses.
Litvak V, Ratushny AV, Lampano AE, Schmitz F, Huang AC, Raman A, Rust AG, Bergthaler A, Aitchison JD, Aderem A
Nature 2012 Oct 18;490(7420):421-5
Nature 2012 Oct 18;490(7420):421-5
A downstream intergenic cluster of regulatory enhancers contributes to the induction of CYP24A1 expression by 1alpha,25-dihydroxyvitamin D3.
Meyer MB, Goetsch PD, Pike JW
The Journal of biological chemistry 2010 May 14;285(20):15599-15610
The Journal of biological chemistry 2010 May 14;285(20):15599-15610
Cooperative regulation in development by SMRT and FOXP1.
Jepsen K, Gleiberman AS, Shi C, Simon DI, Rosenfeld MG
Genes & development 2008 Mar 15;22(6):740-5
Genes & development 2008 Mar 15;22(6):740-5
Ataxin 1, a SCA1 neurodegenerative disorder protein, is functionally linked to the silencing mediator of retinoid and thyroid hormone receptors.
Tsai CC, Kao HY, Mitzutani A, Banayo E, Rajan H, McKeown M, Evans RM
Proceedings of the National Academy of Sciences of the United States of America 2004 Mar 23;101(12):4047-52
Proceedings of the National Academy of Sciences of the United States of America 2004 Mar 23;101(12):4047-52
Arsenic trioxide is a potent inhibitor of the interaction of SMRT corepressor with Its transcription factor partners, including the PML-retinoic acid receptor alpha oncoprotein found in human acute promyelocytic leukemia.
Hong SH, Yang Z, Privalsky ML
Molecular and cellular biology 2001 Nov;21(21):7172-82
Molecular and cellular biology 2001 Nov;21(21):7172-82
No comments: Submit comment
Supportive validation
- Submitted by
- Invitrogen Antibodies (provider)
- Main image

- Experimental details
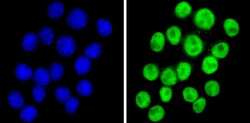
- Immunofluorescent analysis of NCoR2 (green) showing staining in the nucleus of Hela cells (right) compared to a negative control without primary antibody (left). Formalin-fixed cells were permeabilized with 0.1% Triton X-100 in TBS for 5-10 minutes and blocked with 3% BSA-PBS for 30 minutes at room temperature. Cells were probed with a NCoR2 polyclonal antibody (Product # PA1-843) in 3% BSA-PBS at a dilution of 1:150 and incubated overnight at 4 ºC in a humidified chamber. Cells were washed with PBST and incubated with a DyLight-conjugated secondary antibody in PBS at room temperature in the dark. F-actin (red) was stained with a fluorescent red phalloidin and nuclei (blue) were stained with Hoechst or DAPI. Images were taken at a magnification of 100x.
- Submitted by
- Invitrogen Antibodies (provider)
- Main image
- Experimental details
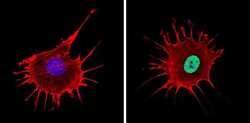
- Immunofluorescent analysis of NCoR2 (green) showing staining in the nucleus of Neuro-2a cells (right) compared to a negative control without primary antibody (left). Formalin-fixed cells were permeabilized with 0.1% Triton X-100 in TBS for 5-10 minutes and blocked with 3% BSA-PBS for 30 minutes at room temperature. Cells were probed with a NCoR2 polyclonal antibody (Product # PA1-843) in 3% BSA-PBS at a dilution of 1:150 and incubated overnight at 4 ºC in a humidified chamber. Cells were washed with PBST and incubated with a DyLight-conjugated secondary antibody in PBS at room temperature in the dark. F-actin (red) was stained with a fluorescent red phalloidin and nuclei (blue) were stained with Hoechst or DAPI. Images were taken at a magnification of 100x.
- Submitted by
- Invitrogen Antibodies (provider)
- Main image
- Experimental details
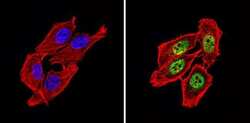
- Immunofluorescent analysis of NCoR2 (green) showing staining in the nucleus of NIH-3T3 cells (right) compared to a negative control without primary antibody (left). Formalin-fixed cells were permeabilized with 0.1% Triton X-100 in TBS for 5-10 minutes and blocked with 3% BSA-PBS for 30 minutes at room temperature. Cells were probed with a NCoR2 polyclonal antibody (Product # PA1-843) in 3% BSA-PBS at a dilution of 1:100 and incubated overnight at 4 ºC in a humidified chamber. Cells were washed with PBST and incubated with a DyLight-conjugated secondary antibody in PBS at room temperature in the dark. F-actin (red) was stained with a fluorescent red phalloidin and nuclei (blue) were stained with Hoechst or DAPI. Images were taken at a magnification of 60x.
- Submitted by
- Invitrogen Antibodies (provider)
- Main image
- Experimental details
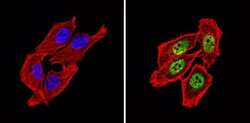
- Immunofluorescent analysis of NCoR2 (green) showing staining in the nucleus of U251 cells (right) compared to a negative control without primary antibody (left). Formalin-fixed cells were permeabilized with 0.1% Triton X-100 in TBS for 5-10 minutes and blocked with 3% BSA-PBS for 30 minutes at room temperature. Cells were probed with a NCoR2 polyclonal antibody (Product # PA1-843) in 3% BSA-PBS at a dilution of 1:100 and incubated overnight at 4 ºC in a humidified chamber. Cells were washed with PBST and incubated with a DyLight-conjugated secondary antibody in PBS at room temperature in the dark. F-actin (red) was stained with a fluorescent red phalloidin and nuclei (blue) were stained with Hoechst or DAPI. Images were taken at a magnification of 60x.
- Submitted by
- Invitrogen Antibodies (provider)
- Main image
- Experimental details
- Immunofluorescent analysis of NCoR2 (green) showing staining in the nucleus of U251 cells (right) compared to a negative control without primary antibody (left). Formalin-fixed cells were permeabilized with 0.1% Triton X-100 in TBS for 5-10 minutes and blocked with 3% BSA-PBS for 30 minutes at room temperature. Cells were probed with a NCoR2 polyclonal antibody (Product # PA1-843) in 3% BSA-PBS at a dilution of 1:100 and incubated overnight at 4 ºC in a humidified chamber. Cells were washed with PBST and incubated with a DyLight-conjugated secondary antibody in PBS at room temperature in the dark. F-actin (red) was stained with a fluorescent red phalloidin and nuclei (blue) were stained with Hoechst or DAPI. Images were taken at a magnification of 60x.
Supportive validation
- Submitted by
- Invitrogen Antibodies (provider)
- Main image
- Experimental details
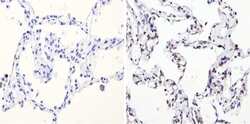
- Immunohistochemistry analysis of NCoR2 showing positive staining in the nucleus of paraffin-treated Human lung tissue (right) compared with a negative control in the absence of primary antibody (left). To expose target proteins, antigen retrieval method was performed using 10mM sodium citrate (pH 6.0) microwaved for 8-15 min. Following antigen retrieval, tissues were blocked in 3% H2O2-methanol for 15 min at room temperature, washed with ddH2O and PBS, and then probed with a NCoR2 polyclonal antibody (Product # PA1-843) diluted by 3% BSA-PBS at a dilution of 1:500 overnight at 4°C in a humidified chamber. Tissues were washed extensively PBST and detection was performed using an HRP-conjugated secondary antibody followed by colorimetric detection using a DAB kit. Tissues were counterstained with hematoxylin and dehydrated with ethanol and xylene to prep for mounting.
- Submitted by
- Invitrogen Antibodies (provider)
- Main image
- Experimental details
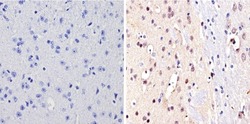
- Immunohistochemistry analysis of NCoR2 showing positive staining in the nucleus of paraffin-treated Mouse brain tissue (right) compared with a negative control in the absence of primary antibody (left). To expose target proteins, antigen retrieval method was performed using 10mM sodium citrate (pH 6.0) microwaved for 8-15 min. Following antigen retrieval, tissues were blocked in 3% H2O2-methanol for 15 min at room temperature, washed with ddH2O and PBS, and then probed with a NCoR2 polyclonal antibody (Product # PA1-843) diluted by 3% BSA-PBS at a dilution of 1:500 overnight at 4°C in a humidified chamber. Tissues were washed extensively PBST and detection was performed using an HRP-conjugated secondary antibody followed by colorimetric detection using a DAB kit. Tissues were counterstained with hematoxylin and dehydrated with ethanol and xylene to prep for mounting.
Supportive validation
- Submitted by
- Invitrogen Antibodies (provider)
- Main image
- Experimental details
- NULL
- Submitted by
- Invitrogen Antibodies (provider)
- Main image

- Experimental details
- NULL
- Submitted by
- Invitrogen Antibodies (provider)
- Main image
- Experimental details
- NULL
- Submitted by
- Invitrogen Antibodies (provider)
- Main image
- Experimental details
- NULL
- Submitted by
- Invitrogen Antibodies (provider)
- Main image
- Experimental details
- NULL
- Submitted by
- Invitrogen Antibodies (provider)
- Main image
- Experimental details
- NULL
- Submitted by
- Invitrogen Antibodies (provider)
- Main image
- Experimental details
- NULL
- Submitted by
- Invitrogen Antibodies (provider)
- Main image
- Experimental details
- NULL
- Submitted by
- Invitrogen Antibodies (provider)
- Main image
- Experimental details
- NULL
- Submitted by
- Invitrogen Antibodies (provider)
- Main image
- Experimental details
- NULL
- Submitted by
- Invitrogen Antibodies (provider)
- Main image

- Experimental details
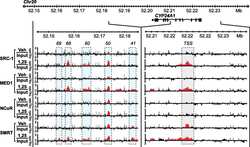
- Figure 2 FOXO3 keeps the Irf7 gene in check a , ChIP-Seq analysis demonstrates FOXO3 binding profile at Irf7 gene promoter in wild type BMMs. Data are representative of two experiments. b , ChIP of FOXO3 from unstimulated wild-type macrophages shows binding of FOXO3 to the promoters of the target genes. FOXO3 recruitment was not observed at control regions lacking FOXO binding sites (-). Data was normalized to IgG (negative control) and represent the average of three independent experiments +- standard error. c , ChIP analysis of histone acetylation, ubiquitination and methylation at Irf7 gene promoter in WT and Foxo3 - macrophages. Data represent the average of three independent experiments (+- standard error). d , ChIP-Seq analysis demonstrates increased histone H4 acetylation levels in Foxo3 - cells. Data are representative of two experiments. e , FOXO3, NCOR2 and HDAC3 are present in the ternary complex at Irf7 promoter, as shown by ChIP-ReChIP assays in unstimulated BMMs. Data was compared to IgG and represent the average of three independent experiments +- standard error. f , ChIP analysis of NCOR2 and HDAC3 binding at Irf7 gene promoter in WT and Foxo3 - macrophages. Data represent the average of three independent experiments (+- standard error). g , ChIP assay demonstrates increased recruitment of IRF7 at Irf7 gene promoter in Foxo3 - macrophages relative. Data was normalized to IgG and represent the average of three independent experiments +- standard
- Submitted by
- Invitrogen Antibodies (provider)
- Main image
- Experimental details
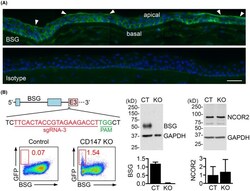
- FIGURE 1 CRISPR/Cas9 genome editing efficiently blocks basigin biosynthesis in human corneal epithelial cells. (A) Immunofluorescence micrographs of healthy human corneal epithelial tissue stained with anti-basigin antibody or isotype control. The arrowheads indicate apical localization of basigin. DAPI was used for nuclear staining (blue). (B) Schematic representation of the first three intron-exon organization of the BSG gene and location of the sgRNA-3 target site. The target sequence of sgRNA-3 is shown in red and the PAM is shown in green. Subpopulations of GFP + BSG - cells were separated by cell sorting. Lysates derived from basigin knockout single cell clones (KO) and noninfected controls (CT) were analyzed by immunoblotting using antibodies against the indicated proteins (n= 3-5 independent clones). Representative blots are shown on top, and quantification of band intensity relative to GAPDH is shown below. Data are expressed as mean +- SD.
 Explore
 Validate
 Learn
Learn Western blot
 Immunocytochemistry