Antibody data
- Antibody Data
- Antigen structure
- References [10]
- Comments [0]
- Validations
- Western blot [2]
- Immunohistochemistry [5]
- Flow cytometry [1]
- Other assay [7]
Submit
Validation data
Reference
Comment
Report error
- Product number
- 33-1800 - Provider product page

- Provider
- Invitrogen Antibodies
- Product name
- CDK1 Monoclonal Antibody (A17)
- Antibody type
- Monoclonal
- Antigen
- Recombinant full-length protein
- Reactivity
- Human, Mouse, Rat, Chicken/Avian, Xenopus
- Host
- Mouse
- Isotype
- IgG
- Antibody clone number
- A17
- Vial size
- 200 µg
- Concentration
- 0.5 mg/mL
- Storage
- -20°C
Submitted references Pancreatic tumor eradication via selective Pin1 inhibition in cancer-associated fibroblasts and T lymphocytes engagement.
CCNE1 amplification is synthetic lethal with PKMYT1 kinase inhibition.
Ablation of CRBN induces loss of type I collagen and SCH in mouse skin by fibroblast senescence via the p38 MAPK pathway.
Metabolite and thymocyte development defects in ADA-SCID mice receiving enzyme replacement therapy.
PADI3 plays an antitumor role via the Hsp90/CKS1 pathway in colon cancer.
Paxillin and embryonic PolyAdenylation Binding Protein (ePABP) engage to regulate androgen-dependent Xenopus laevis oocyte maturation - A model of kinase-dependent regulation of protein expression.
Enhanced expression of mitochondrial superoxide dismutase leads to prolonged in vivo cell cycle progression and up-regulation of mitochondrial thioredoxin.
Abnormal expression of differentiation related proteins and proteoglycan core proteins in the urothelium of patients with interstitial cystitis.
CDC2/CDK1 expression in esophageal adenocarcinoma and precursor lesions serves as a diagnostic and cancer progression marker and potential novel drug target.
Alpha(v)beta3 integrin expression up-regulates cdc2, which modulates cell migration.
Liu J, Wang Y, Mu C, Li M, Li K, Li S, Wu W, Du L, Zhang X, Li C, Peng W, Shen J, Liu Y, Yang D, Zhang K, Ning Q, Fu X, Zeng Y, Ni Y, Zhou Z, Liu Y, Hu Y, Zheng X, Wen T, Li Z, Liu Y
Nature communications 2022 Jul 25;13(1):4308
Nature communications 2022 Jul 25;13(1):4308
CCNE1 amplification is synthetic lethal with PKMYT1 kinase inhibition.
Gallo D, Young JTF, Fourtounis J, Martino G, Álvarez-Quilón A, Bernier C, Duffy NM, Papp R, Roulston A, Stocco R, Szychowski J, Veloso A, Alam H, Baruah PS, Fortin AB, Bowlan J, Chaudhary N, Desjardins J, Dietrich E, Fournier S, Fugère-Desjardins C, Goullet de Rugy T, Leclaire ME, Liu B, Bhaskaran V, Mamane Y, Melo H, Nicolas O, Singhania A, Szilard RK, Tkáč J, Yin SY, Morris SJ, Zinda M, Marshall CG, Durocher D
Nature 2022 Apr;604(7907):749-756
Nature 2022 Apr;604(7907):749-756
Ablation of CRBN induces loss of type I collagen and SCH in mouse skin by fibroblast senescence via the p38 MAPK pathway.
Jeon S, Yoon YS, Kim HK, Han J, Lee KM, Seol JE, Cho SK, Park CS
Aging 2021 Mar 3;13(5):6406-6419
Aging 2021 Mar 3;13(5):6406-6419
Metabolite and thymocyte development defects in ADA-SCID mice receiving enzyme replacement therapy.
Moretti FA, Giardino G, Attenborough TCH, Gkazi AS, Margetts BK, la Marca G, Fairbanks L, Crompton T, Gaspar HB
Scientific reports 2021 Dec 1;11(1):23221
Scientific reports 2021 Dec 1;11(1):23221
PADI3 plays an antitumor role via the Hsp90/CKS1 pathway in colon cancer.
Chai Z, Wang L, Zheng Y, Liang N, Wang X, Zheng Y, Zhang Z, Zhao C, Zhu T, Liu C
Cancer cell international 2019;19:277
Cancer cell international 2019;19:277
Paxillin and embryonic PolyAdenylation Binding Protein (ePABP) engage to regulate androgen-dependent Xenopus laevis oocyte maturation - A model of kinase-dependent regulation of protein expression.
Miedlich SU, Taya M, Young MR, Hammes SR
Molecular and cellular endocrinology 2017 Jun 15;448:87-97
Molecular and cellular endocrinology 2017 Jun 15;448:87-97
Enhanced expression of mitochondrial superoxide dismutase leads to prolonged in vivo cell cycle progression and up-regulation of mitochondrial thioredoxin.
Kim A, Joseph S, Khan A, Epstein CJ, Sobel R, Huang TT
Free radical biology & medicine 2010 Jun 1;48(11):1501-12
Free radical biology & medicine 2010 Jun 1;48(11):1501-12
Abnormal expression of differentiation related proteins and proteoglycan core proteins in the urothelium of patients with interstitial cystitis.
Hauser PJ, Dozmorov MG, Bane BL, Slobodov G, Culkin DJ, Hurst RE
The Journal of urology 2008 Feb;179(2):764-9
The Journal of urology 2008 Feb;179(2):764-9
CDC2/CDK1 expression in esophageal adenocarcinoma and precursor lesions serves as a diagnostic and cancer progression marker and potential novel drug target.
Hansel DE, Dhara S, Huang RC, Ashfaq R, Deasel M, Shimada Y, Bernstein HS, Harmon J, Brock M, Forastiere A, Washington MK, Maitra A, Montgomery E
The American journal of surgical pathology 2005 Mar;29(3):390-9
The American journal of surgical pathology 2005 Mar;29(3):390-9
Alpha(v)beta3 integrin expression up-regulates cdc2, which modulates cell migration.
Manes T, Zheng DQ, Tognin S, Woodard AS, Marchisio PC, Languino LR
The Journal of cell biology 2003 May 26;161(4):817-26
The Journal of cell biology 2003 May 26;161(4):817-26
No comments: Submit comment
Supportive validation
- Submitted by
- Invitrogen Antibodies (provider)
- Main image
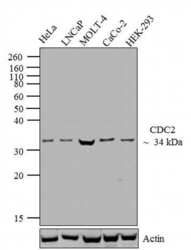
- Experimental details
- Western blot analysis was performed on whole cell extracts (30 µg lysate) of HeLa (Lane 1), LNCaP (Lane 2), MOLT-4 (lane 3), CaCo-2 (lane 5) and HEK-293 (lane 6). The blots were probed with Anti-CDC2 Mouse Monoclonal Antibody (Product # 33-1800, 0.5-2 µg/mL) and detected by chemiluminescence using Goat anti-Mouse IgG (H+L) Secondary Antibody, HRP conjugate (Product # 62-6520, 1:4000 dilution). A 34 kDa band corresponding to CDC2 was observed across cell lines tested. Known quantity of protein samples were electrophoresed using Novex® NuPAGE® 12 % Bis-Tris gel (Product # NP0342BOX), XCell SureLock™ Electrophoresis System (Product # EI0002) and Novex® Sharp Pre-Stained Protein Standard (Product # LC5800). Resolved proteins were then transferred onto a nitrocellulose membrane with iBlot® 2 Dry Blotting System (Product # IB21001). The membrane was probed with the relevant primary and secondary Antibody following blocking with 5 % skimmed milk. Chemiluminescent detection was performed using Pierce™ ECL Western Blotting Substrate (Product # 32106).
- Submitted by
- Invitrogen Antibodies (provider)
- Main image

- Experimental details
- Knockdown of CDK1 was achieved by transfecting HeLa cells with CDK1 specific validated siRNA (Silencer® select Product # s464). Western blot analysis Fig (a) was performed using whole cell lysates from the CDK1 knock down cells (lane 3), non-specific scrambled siRNA transfected cells (lane 2) and untransfected cells (lane 1). The blots were probed with Anti-CDC2 Mouse Monoclonal Antibody (Product # 33-1800, 0.5-2 µg/mL) and Goat anti-Mouse IgG (H+L) Secondary Antibody, HRP conjugate (Product # 62-6520, 1:4000 dilution). Densitometric analysis of this western blot is shown in histogram (Fig b). Loss of signal upon siRNA mediated knock down confirms that antibody is specific to CDK1.
Supportive validation
- Submitted by
- Invitrogen Antibodies (provider)
- Main image
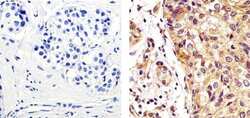
- Experimental details
- Immunohistochemistry analysis of CDC2/CDK1 showing staining in the cytoplasm and membrane of paraffin-embedded human breast carcinoma tissue (right) compared to a negative control without primary antibody (left). To expose target proteins, antigen retrieval was performed using 10 mM sodium citrate (pH 6.0), microwaved for 8-15 min. Following antigen retrieval, tissues were blocked in 3% H2O2-methanol for 15 min at room temperature, washed with ddH2O and PBS, and then probed with a CDC2/CDK1 mouse monoclonal Antibody (Product # 33-1800) diluted in 3% BSA-PBS at a dilution of 1:20 overnight at 4°C in a humidified chamber. Tissues were washed extensively in PBST and detection was performed using an HRP-conjugated secondary antibody followed by colorimetric detection using a DAB kit. Tissues were counterstained with hematoxylin and dehydrated with ethanol and xylene to prep for mounting.
- Submitted by
- Invitrogen Antibodies (provider)
- Main image
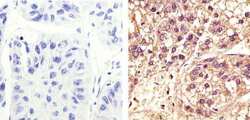
- Experimental details
- Immunohistochemistry analysis of CDC2/CDK1 showing staining in the cytoplasm and nucleus of paraffin-embedded human-hepatocarcinoma tissue (right) compared to a negative control without primary antibody (left). To expose target proteins, antigen retrieval was performed using 10mM sodium citrate (pH 6.0), microwaved for 8-15 min. Following antigen retrieval, tissues were blocked in 3% H2O2-methanol for 15 min at room temperature, washed with ddH2O and PBS, and then probed with a CDC2/CDK1 mouse monoclonal Antibody (Product # 33-1800) diluted in 3% BSA-PBS at a dilution of 1:20 overnight at 4ºC in a humidified chamber. Tissues were washed extensively in PBST and detection was performed using an HRP-conjugated secondary antibody followed by colorimetric detection using a DAB kit. Tissues were counterstained with hematoxylin and dehydrated with ethanol and xylene to prep for mounting.
- Submitted by
- Invitrogen Antibodies (provider)
- Main image
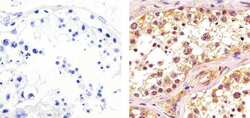
- Experimental details
- Immunohistochemistry analysis of CDC2/CDK1 showing staining in the cytoplasm and nucleus of paraffin-embedded human testis tissue (right) compared to a negative control without primary antibody (left). To expose target proteins, antigen retrieval was performed using 10mM sodium citrate (pH 6.0), microwaved for 8-15 min. Following antigen retrieval, tissues were blocked in 3% H2O2-methanol for 15 min at room temperature, washed with ddH2O and PBS, and then probed with a CDC2/CDK1 mouse monoclonal Antibody (Product # 33-1800) diluted in 3% BSA-PBS at a dilution of 1:20 overnight at 4ºC in a humidified chamber. Tissues were washed extensively in PBST and detection was performed using an HRP-conjugated secondary antibody followed by colorimetric detection using a DAB kit. Tissues were counterstained with hematoxylin and dehydrated with ethanol and xylene to prep for mounting.
- Submitted by
- Invitrogen Antibodies (provider)
- Main image
- Experimental details
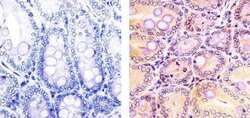
- Immunohistochemistry analysis of CDC2/CDK1 showing staining in the cytoplasm and nucleus of paraffin-embedded mouse colon tissue(right) compared to a negative control without primary antibody (left). To expose target proteins, antigen retrieval was performed using 10mM sodium citrate (pH 6.0), microwaved for 8-15 min. Following antigen retrieval, tissues were blocked in 3% H2O2-methanol for 15 min at room temperature, washed with ddH2O and PBS, and then probed with a CDC2/CDK1 mouse monoclonal Antibody (Product # 33-1800) diluted in 3% BSA-PBS at a dilution of 1:20 overnight at 4ºC in a humidified chamber. Tissues were washed extensively in PBST and detection was performed using an HRP-conjugated secondary antibody followed by colorimetric detection using a DAB kit. Tissues were counterstained with hematoxylin and dehydrated with ethanol and xylene to prep for mounting.
- Submitted by
- Invitrogen Antibodies (provider)
- Main image
- Experimental details
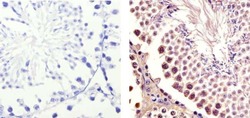
- Immunohistochemistry analysis of CDC2/CDK1 showing staining in the cytoplasm and nucleus of paraffin-embedded mouse testis tissue(right) compared to a negative control without primary antibody (left). To expose target proteins, antigen retrieval was performed using 10mM sodium citrate (pH 6.0), microwaved for 8-15 min. Following antigen retrieval, tissues were blocked in 3% H2O2-methanol for 15 min at room temperature, washed with ddH2O and PBS, and then probed with a CDC2/CDK1 mouse monoclonal Antibody (Product # 33-1800) diluted in 3% BSA-PBS at a dilution of 1:20 overnight at 4ºC in a humidified chamber. Tissues were washed extensively in PBST and detection was performed using an HRP-conjugated secondary antibody followed by colorimetric detection using a DAB kit. Tissues were counterstained with hematoxylin and dehydrated with ethanol and xylene to prep for mounting.
Supportive validation
- Submitted by
- Invitrogen Antibodies (provider)
- Main image
- Experimental details
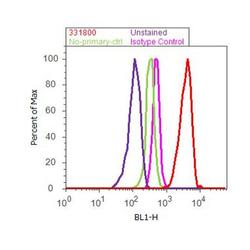
- Flow cytometry analysis of CDC2/CDK1 was done on MCF7 cells were fixed with 70% ethanol for 10 minutes, permeabilized with 0.25% Triton™ X-100 for 20 minutes, and blocked with 5% BSA for 30 minutes at room temperature. Cells were labeled with CDC2/CDK1 Mouse Monoclonal Antibody (331800, red histogram) or with mouse isotype control (pink histogram) at 3-5 ug/million cells in 2.5% BSA. After incubation at room temperature for 2 hours, the cells were labeled with Alexa Fluor® 488 Rabbit Anti-Mouse Secondary Antibody (A11059) at a dilution of 1:400 for 30 minutes at room temperature. The representative 10,000 cells were acquired and analyzed for each sample using an Attune® Acoustic Focusing Cytometer. The purple histogram represents unstained control cells and the green histogram represents no-primary-antibody control.
Supportive validation
- Submitted by
- Invitrogen Antibodies (provider)
- Main image
- Experimental details
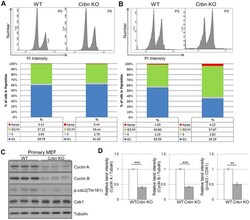
- Figure 4 CRBN deficient fibroblast exhibits G2/M cell cycle arrest. ( A , B ) PI staining and cell cycle distribution analysis of WT and CRBN KO Primary MEFs in P0 and P3. Cells were stained with PI and analyzed for cell cycle distribution using flow cytometry. Representative images of flow cytometry plots are shown. The graph indicates the distribution of each cell cycle phase with different colors, G0/G1(blue), S(gray), and G2/M(green) phases. ( C ) Western blots analysis using extracts of MEF cells in the early passage were immunoblotted with the anti-Cyclin A, anti-Cyclin B, anti-Cdk1, anti-p-cdc2, and anti-Tubulin antibodies. Tubulin was used to confirm equal protein loading. ( D ) Relative band intensities as determined by densitometric analysis of the blots in ( C ). The results shown are representative of five independent experiments. * P < 0.05; ** P < 0.01; *** P < 0.005; n.s., not significant.
- Submitted by
- Invitrogen Antibodies (provider)
- Main image
- Experimental details
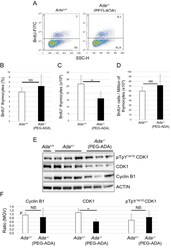
- Figure 7 Ado accumulation does not interfere with thymocytes proliferation. ( A ) FACS plots of proliferating thymocytes (BrdU + ) from control ( Ada + / + ) and 3-week-PEG-ADA-treated Ada -/- mice. Bar graphs representing percentages ( B ), absolute ( C ) and relative ( D ) numbers of BrdU + thymocytes shown in (A) (n = 6, 6). ( E ) Western blot analysis of protein lysates of thymocytes shown in (A). Anti-ACTIN stain was used as protein loading control. Full-length blots are presented in Supplementary Fig. 12 . ( F ) ImageJ quantification of protein bands from Western blot film shown in (E). MGV = mean gray value. * P < 0.05, ** P < 0.01 and *** P < 0.001. NS = statistically not significant.
- Submitted by
- Invitrogen Antibodies (provider)
- Main image

- Experimental details
- Extended Data Fig. 7 Increased Cyclin B and CDK1 abundance and activity render cell sensitive to RP-6306. a , Whole cell lysates of FT282-hTERT TP53 R175H WT and CCNE1 -high (C3) cells were immunoblotted with antibodies against cyclin B, CDK1 and Tubulin. Top is representative immunoblot images and bottom are quantitation. Data are shown as mean +- s.d. (n = 3). b , Correlation of CCNE1 and CCNB1 mRNA expression in TCGA pan-cancer tissues (n = 10,304). c , Approach for cytoplasmic cyclin B quantitation by QIBC. The nuclear mask edge was expanded by 2 and 12 pixels to create a doughnut mask used to estimate cytoplasmic signal intensity. d , Representative micrographs of FT282-hTERT TP53 R175H CCNE1- high cells transfected with the indicated siRNAs and stained with DAPI (cyan) and cyclin B antibodies (magenta). The channels are merged in the bottom panels. e , Representative QIBC micrographs of FT282-hTERT TP53 R175H parental (WT) and CCNE1- high cells stained with cyclin B antibodies (magenta) and either DAPI (cyan) or EdU (yellow) channels merged. f,g , QIBC analysis of cyclin B cytoplasmic intensity, EdU incorporation and DNA content (DAPI) of CCNE1 -high FT282-hTERT TP53 R175H cells nucleofected with Cas9 ribonucleoproteins assembled with the indicated sgRNAs. The quantitation of cells with cytoplasmic cyclin B in late S ( f ) or G2/M ( g ) are shown. Data are shown as mean +- s.d. (n = 3) h , CCNE1 -high cells have increased CDK1 activity. Top, cellular extracts of the ind
- Submitted by
- Invitrogen Antibodies (provider)
- Main image
- Experimental details
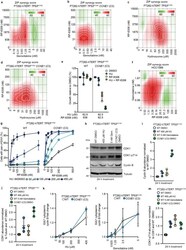
- Extended Data Fig. 8 HU and gemcitabine synergize with RP-6306. a-d,f , ZIP synergy scores at various dose combinations of RP-6306 and gemcitabine ( a , b , f ) or hydroxyurea (HU) ( c , d ) in FT282-hTERT TP53 R175H parental (WT) ( a , c ), CCNE1- high ( b , d ) and HCC1569 ( f ) cells. Score >=10 (red color) represents synergy,
- Submitted by
- Invitrogen Antibodies (provider)
- Main image
- Experimental details
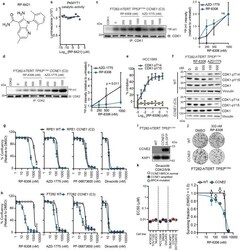
- Extended Data Fig. 2 Development of RP-6306 and comparison of PKMYT1i, WEEi and CDK2i. a , Chemical structure of RP-6421, an analog of RP-6306 b , Dose-response of RP-6421 on PKMYT1 catalytic activity as measured with ADP-Glo kinase assay. c, d , Cell culture of FT282-hTERT TP53 R175H CCNE1 -high cells were treated with the indicated doses of RP-6306 and AZD-1775 for 24 h. Left, cellular extracts were prepared and immunoprecipitated (IP) with agarose-coupled CDK1 ( c ) or CDK2 ( d ) antibodies. Immunoprecipitates were subjected to in vitro kinase assays using [gamma 32 P]-ATP and recombinant histone H1 as a substrate. Reactions were resolved by SDS-PAGE and gels were imaged using a phosphor screen. A sample of each immunoprecipitate was immunoblotted (IB) with CDK1 or CDK2 antibodies. CDK1i (RO-3306) or CDK2i (PF-06873600) was added to indicated in vitro reactions. Right, quantitation 32 P-H1 band intensity. Data are shown as mean +- s.d. (n = 3) and P value was determined by one-sided sum-of-squares f -test. e , HCC1569 cells were treated with the indicated doses of RP-6306 for 2 h and subjected to the AlphaLISA assay using CDK1-pT14, CDK1-pY15 and total CDK1 antibodies. Data are shown as mean +- s.d. (n = 3). f , FT282-hTERT TP53 R175H parental and CCNE1- high cells were treated with the indicated doses of RP-6306 and AZD-1775 for 4 h. Whole cell lysates were prepared and immunoblotted with antibodies against CDK1-pT14, CDK1-pY15, CDK1 and vinculin as a loading contol. Repr
- Submitted by
- Invitrogen Antibodies (provider)
- Main image
- Experimental details
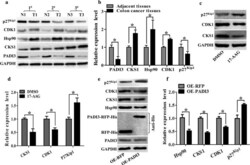
- Fig. 4 Both 17-AAG and PADI3 can suppress CKS1 expression in HCT116 cells. a Expression profile of PADI3, CKS1, Hsp90, CDK1 and p27 kip1 were detected using western blot in colon cancer tissues and their corresponding adjacent tissues at the translational level, GAPDH was used to normalize the relative expression of them; b statistical analysis of western blot results in A; c 5 muM 17-AAG was used to treat HCT116 cells for 24 h, and western blot was used to measure the expression level of CKS1, CDK1 and p27 kip1 ; d Statistic analysis of c ; e Overexpression of PADI3 was performed in HCT116 cells, and western blot was used to detect the expression level of Hsp90, CKS1, CDK1 and p27 kip1 , overexpression of RFP as the control group; f statistical analysis of western blot results in e . GAPDH was selected as the internal control, *indicates p < 0.05 for three independent experiments analyzed by Student's t test
- Submitted by
- Invitrogen Antibodies (provider)
- Main image
- Experimental details
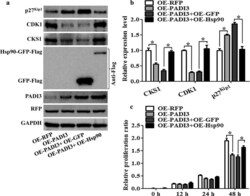
- Fig. 6 Function of Hsp90 on PADI3 regulated CKS1 expression. RFP stable expressing HCT116 cells as the negative control, PADI3 stable expressing HCT116 cells as the positive control, Hsp90 overexpression plasmid was transfected into the PADI3 stable expressing HCT116 cells to study the function of Hsp90 on PADI3 regulated CKS1 expression, GFP overexpression plasmid was transfected into the PADI3 stable expressing HCT116 cells as the negative control group. a Western blot was used to measure the expression level of CKS1, CDK1 and p27kip1 after Hsp90 transfected into PADI3 stable expressing HCT116 cells; b qRT-PCR was used to verify the results of a . c CCK8 analysis was used to study the function of Hsp90 in the regulating of cell proliferation in PADI3 stable expressing HCT116 cells. GAPDH was selected as the internal control, *indicates p < 0.05 for three independent experiments analyzed by Student's t test
 Explore
 Validate
 Learn
Learn Western blot
 ELISA
ELISA