Explore
 Validate
 Learn
Learn Flow cytometry
Antibody data
- Antibody Data
- Antigen structure
- References [4]
- Comments [0]
- Validations
- Flow cytometry [1]
- Other assay [2]
Submit
Validation data
Reference
Comment
Report error
- Product number
- 12-6502-82 - Provider product page

- Provider
- Invitrogen Antibodies
- Product name
- TOX Monoclonal Antibody (TXRX10), PE, eBioscience™
- Antibody type
- Monoclonal
- Antigen
- Other
- Description
- Description: This TXRX10 monoclonal antibody reacts with human and mouse TOX, which is also known as Thymocyte selection-associated HMG box protein. This DNA-binding nuclear factor is expressed in thymocytes, T lymphocytes, NK cells, and lymphoid tissue-inducer (LTi) cells. TOX expression in thymocytes is upregulated during beta-selection and positive selection. Studies using Tox knockout mice have demonstrated a critical role for TOX in CD4+ T cell development as a regulator of the CD4loCD8lo to CD4+CD8lo transition. Moreover, TOX has been shown to be involved in the development of NK and LTi cells. While its regulation remains unclear, TOX expression has been shown to be induced by calcineurin-mediated TCR signaling in thymocytes during positive selection.
- Conjugate
- Yellow dye
- Antibody clone number
- TXRX10
- Concentration
- 0.2 mg/mL
Submitted references Cancer-associated mutations in VAV1 trigger variegated signaling outputs and T-cell lymphomagenesis.
Uptake of oxidized lipids by the scavenger receptor CD36 promotes lipid peroxidation and dysfunction in CD8(+) T cells in tumors.
Single-cell transcriptome analysis reveals TOX as a promoting factor for T cell exhaustion and a predictor for anti-PD-1 responses in human cancer.
Landscape of Exhausted Virus-Specific CD8 T Cells in Chronic LCMV Infection.
Robles-Valero J, Fernández-Nevado L, Lorenzo-Martín LF, Cuadrado M, Fernández-Pisonero I, Rodríguez-Fdez S, Astorga-Simón EN, Abad A, Caloto R, Bustelo XR
The EMBO journal 2021 Nov 15;40(22):e108125
The EMBO journal 2021 Nov 15;40(22):e108125
Uptake of oxidized lipids by the scavenger receptor CD36 promotes lipid peroxidation and dysfunction in CD8(+) T cells in tumors.
Xu S, Chaudhary O, Rodríguez-Morales P, Sun X, Chen D, Zappasodi R, Xu Z, Pinto AFM, Williams A, Schulze I, Farsakoglu Y, Varanasi SK, Low JS, Tang W, Wang H, McDonald B, Tripple V, Downes M, Evans RM, Abumrad NA, Merghoub T, Wolchok JD, Shokhirev MN, Ho PC, Witztum JL, Emu B, Cui G, Kaech SM
Immunity 2021 Jul 13;54(7):1561-1577.e7
Immunity 2021 Jul 13;54(7):1561-1577.e7
Single-cell transcriptome analysis reveals TOX as a promoting factor for T cell exhaustion and a predictor for anti-PD-1 responses in human cancer.
Kim K, Park S, Park SY, Kim G, Park SM, Cho JW, Kim DH, Park YM, Koh YW, Kim HR, Ha SJ, Lee I
Genome medicine 2020 Feb 28;12(1):22
Genome medicine 2020 Feb 28;12(1):22
Landscape of Exhausted Virus-Specific CD8 T Cells in Chronic LCMV Infection.
Sandu I, Cerletti D, Oetiker N, Borsa M, Wagen F, Spadafora I, Welten SPM, Stolz U, Oxenius A, Claassen M
Cell reports 2020 Aug 25;32(8):108078
Cell reports 2020 Aug 25;32(8):108078
No comments: Submit comment
Supportive validation
- Submitted by
- Invitrogen Antibodies (provider)
- Main image
- Experimental details
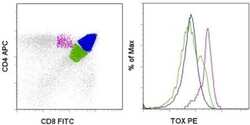
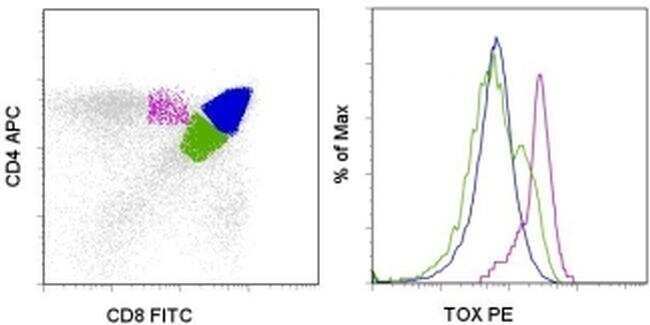
- C57Bl/6 thymocytes were stained with Anti-Mouse CD4 APC (Product # 17-0041-82) and Anti-Mouse CD8a FITC (Product # 11-0081-82), followed by intracellular staining with 0.5 µg of Anti-Human/Mouse TOX PE using the Foxp3 Staining Buffer Set and protocol (Product # 00-5521-00). The histogram (right) demonstrates TOX staining of CD4+CD8+ (blue histogram), CD4loCD8lo (green histogram), and CD4+CD8lo (purple) thymocytes. Cell populations were gated as indicated on the dot plot (left). Cells in the lymphocyte gate were used for analysis.
- Conjugate
- Yellow dye
Supportive validation
- Submitted by
- Invitrogen Antibodies (provider)
- Main image
- Experimental details
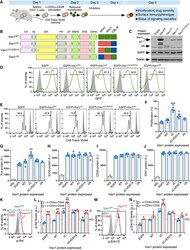
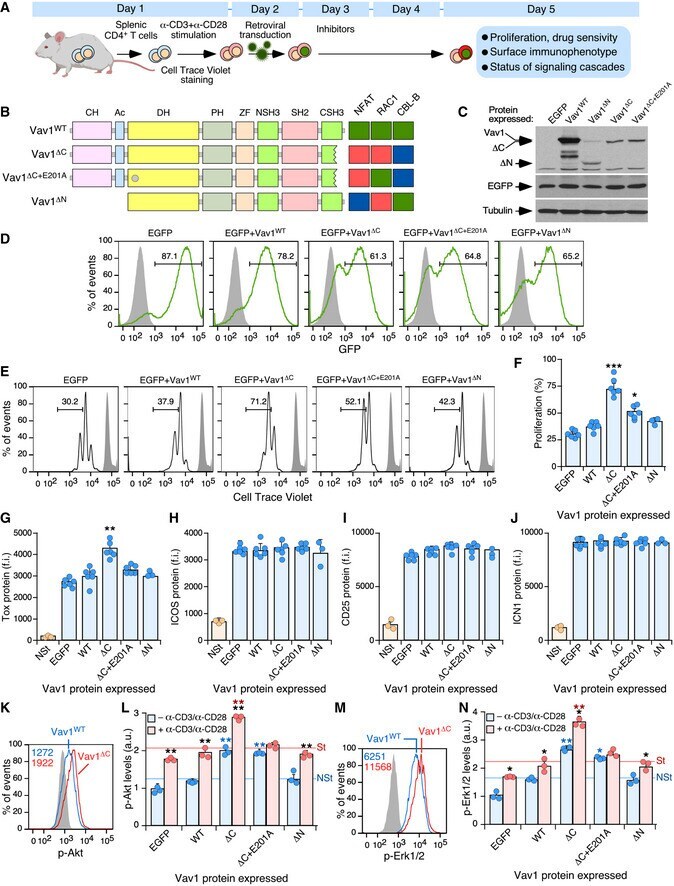
- Figure 6 Vav1 DeltaC -mediated proliferation requires engagement of several downstream pathways A Schematic representation of the experiments used in this figure. See details in main text and Materials and Methods. B Depiction of the Vav1 mutants used in these experiments. The E201A mutation is shown as a gray circle. The activity of each mutant is represented on the right. Green box, WT activity; red box, gain of function; blue box, loss of function. C Representative immunoblot showing the abundance of the ectopic Vav1 proteins, EGFP, and the endogenous tubulin alpha (loading control) in CD4 + T cells transduced with retrovirus particles used in these experiments (top). D Representative FACS plots showing EGFP epifluorescence in CD4 + T cells transduced with retroviruses encoding the indicated proteins (top). Numbers indicate the relative percentage (%) of the EGFP + cell population in each case. Gray shaded histograms represent the fluorescence obtained from CD4 + T cells nontransduced with retrovirus particles. Similar results were obtained in CD4 + T cells transduced with virus encoding EGFP ( n = 6), Vav1 WT ( n = 6), Vav1 DeltaC ( n = 6), Vav1 DeltaC+E201A ( n = 6), and Vav1 DeltaN ( n = 3). E, F Representative FACS plots (E) and quantification (F) of the proliferation of EGFP + CD4 + T cells expressing the indicated proteins using the Cell Trace Violet method. In (E), the gray shaded histograms represent the fluorescence obtained from nonstimulated CD4 + T cells before
- Conjugate
- Yellow dye
- Submitted by
- Invitrogen Antibodies (provider)
- Main image
- Experimental details
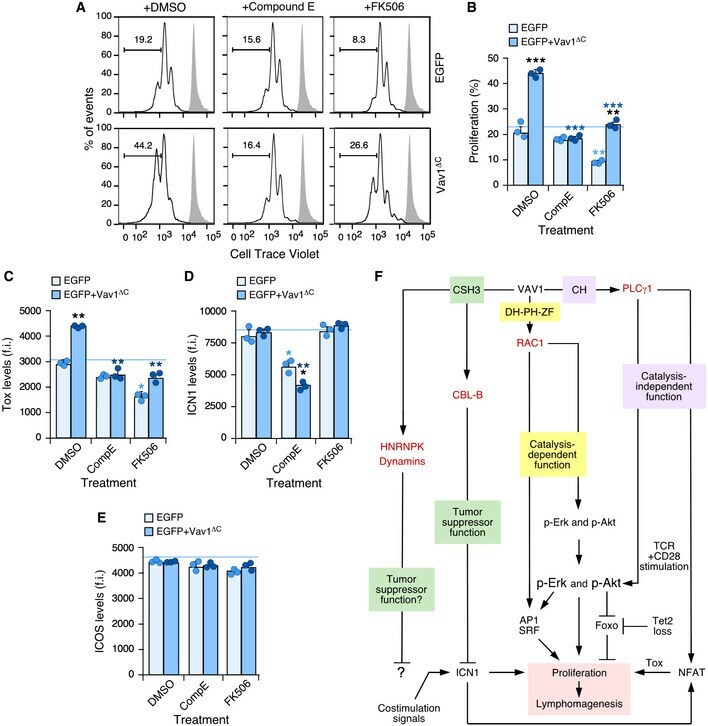
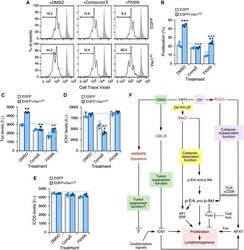
- Figure 7 Vav1 DeltaC -driven CD4 + T-cell proliferation requires ICN1 and proper calcineurin signaling A, B Representative FACS plots (A) and quantification (B) of the EGFP + CD4 + T-cell proliferation in the different experimental groups (right) and indicated experimental conditions (top) using the Cell Trace Violet detection method. In A, gray shaded histograms represent the fluorescence obtained from nonstimulated CD4 + T cells before stimulation and retroviral transduction. n = 3 independent experiments. C-E Flow cytometry determination of intracellular Tox (C), intracellular ICN1 (D), and surface ICOS (E) levels in EGFP + CD4 + T cells expressing the indicated Vav1 proteins. f.i., mean fluorescence intensity relative to the isotype-matched control antibody. n = 3 independent experiments. F Summary of the Vav1-regulated signaling pathways that contribute to promote the proliferation of primary CD4 + T cells that have been unveiled in this work. The other downstream effectors and pathways of Vav1 are indicated. The main primary effectors as shown in red. Data information: In panels (B, C, D, and E), values are shown as means +- SEM from three independent experiments. P -values are given relative to nontreated (light blue asterisks) and treated (dark blue asterisks) EGFP + cells. We also include P -values for the values exhibited by each experimental group relative to those obtained in nontreated condition (black asterisks). * P
- Conjugate
- Yellow dye