Explore
 Validate
 Learn
Learn Western blot
 Immunoprecipitation
Antibody data
- Antibody Data
- Antigen structure
- References [6]
- Comments [0]
- Validations
- Western blot [3]
- Other assay [2]
Submit
Validation data
Reference
Comment
Report error
- Product number
- 14-6502-82 - Provider product page

- Provider
- Invitrogen Antibodies
- Product name
- TOX Monoclonal Antibody (TXRX10), eBioscience™
- Antibody type
- Monoclonal
- Antigen
- Other
- Description
- Description: This TXRX10 monoclonal antibody reacts with human and mouse TOX, which is also known as Thymocyte selection-associated HMG box protein. This DNA-binding nuclear factor is expressed in thymocytes, T lymphocytes, NK cells, and lymphoid tissue-inducer (LTi) cells. TOX expression in thymocytes is upregulated during beta-selection and positive selection. Studies using Tox knockout mice have demonstrated a critical role for TOX in CD4^+ T cell development as a regulator of the CD4^loCD8^lo to CD4^+CD8^lo transition. Moreover, TOX has been shown to be involved in the development of NK and LTi cells. While its regulation remains unclear, TOX expression has been shown to be induced by calcineurin-mediated TCR signaling in thymocytes during positive selection. Applications Reported: This TXRX10 antibody has been reported for use in immunoprecipitation and immunoblotting (WB). Applications Tested: This TXRX10 antibody has been tested by immunoblotting of reduced cell lysate prepared from mouse thymocytes at less than or equal to 5 µg/mL. It is recommended that the antibody be carefully titrated for optimal performance in the assay of interest. Purity: Greater than 90%, as determined by SDS-PAGE. Aggregation: Less than 10%, as determined by HPLC. Filtration: 0.2 µm post-manufacturing filtered.
- Reactivity
- Human, Mouse
- Host
- Rat
- Isotype
- IgG
- Antibody clone number
- TXRX10
- Vial size
- 100 µg
- Concentration
- 0.5 mg/mL
- Storage
- 4° C
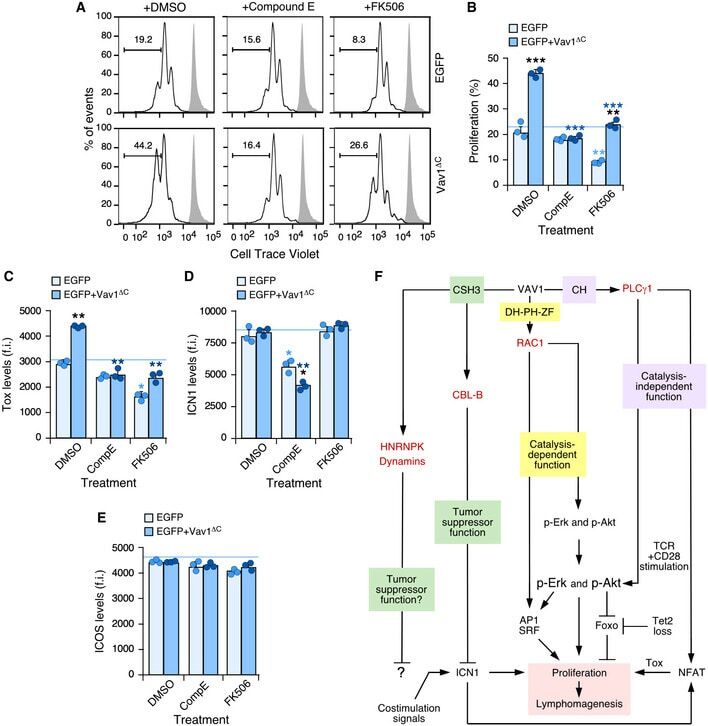
Submitted references Cancer-associated mutations in VAV1 trigger variegated signaling outputs and T-cell lymphomagenesis.
T cell exhaustion and a failure in antigen presentation drive resistance to the graft-versus-leukemia effect.
Shared dependence on the DNA-binding factor TOX for the development of lymphoid tissue-inducer cell and NK cell lineages.
Development of all CD4 T lineages requires nuclear factor TOX.
TOX provides a link between calcineurin activation and CD8 lineage commitment.
TOX: an HMG box protein implicated in the regulation of thymocyte selection.
Robles-Valero J, Fernández-Nevado L, Lorenzo-Martín LF, Cuadrado M, Fernández-Pisonero I, Rodríguez-Fdez S, Astorga-Simón EN, Abad A, Caloto R, Bustelo XR
The EMBO journal 2021 Nov 15;40(22):e108125
The EMBO journal 2021 Nov 15;40(22):e108125
T cell exhaustion and a failure in antigen presentation drive resistance to the graft-versus-leukemia effect.
Zhou M, Sacirbegovic F, Zhao K, Rosenberger S, Shlomchik WD
Nature communications 2020 Aug 24;11(1):4227
Nature communications 2020 Aug 24;11(1):4227
Shared dependence on the DNA-binding factor TOX for the development of lymphoid tissue-inducer cell and NK cell lineages.
Aliahmad P, de la Torre B, Kaye J
Nature immunology 2010 Oct;11(10):945-52
Nature immunology 2010 Oct;11(10):945-52
Development of all CD4 T lineages requires nuclear factor TOX.
Aliahmad P, Kaye J
The Journal of experimental medicine 2008 Jan 21;205(1):245-56
The Journal of experimental medicine 2008 Jan 21;205(1):245-56
TOX provides a link between calcineurin activation and CD8 lineage commitment.
Aliahmad P, O'Flaherty E, Han P, Goularte OD, Wilkinson B, Satake M, Molkentin JD, Kaye J
The Journal of experimental medicine 2004 Apr 19;199(8):1089-99
The Journal of experimental medicine 2004 Apr 19;199(8):1089-99
TOX: an HMG box protein implicated in the regulation of thymocyte selection.
Wilkinson B, Chen JY, Han P, Rufner KM, Goularte OD, Kaye J
Nature immunology 2002 Mar;3(3):272-80
Nature immunology 2002 Mar;3(3):272-80
No comments: Submit comment
Supportive validation
- Submitted by
- Invitrogen Antibodies (provider)
- Main image

- Experimental details
- Cell lysates prepared from reduced mouse thymocytes were immunoblotted with 1 µg/mL of Anti-Human/Mouse TOX antibody. Bands were visualized using Anti-Rat IgG HRP.

- Submitted by
- Invitrogen Antibodies (provider)
- Main image

- Experimental details
- Cell lysates prepared from reduced mouse thymocytes were immunoblotted with 1 µg/mL of Anti-Human/Mouse TOX antibody. Bands were visualized using Anti-Rat IgG HRP.

- Submitted by
- Invitrogen Antibodies (provider)
- Main image

- Experimental details
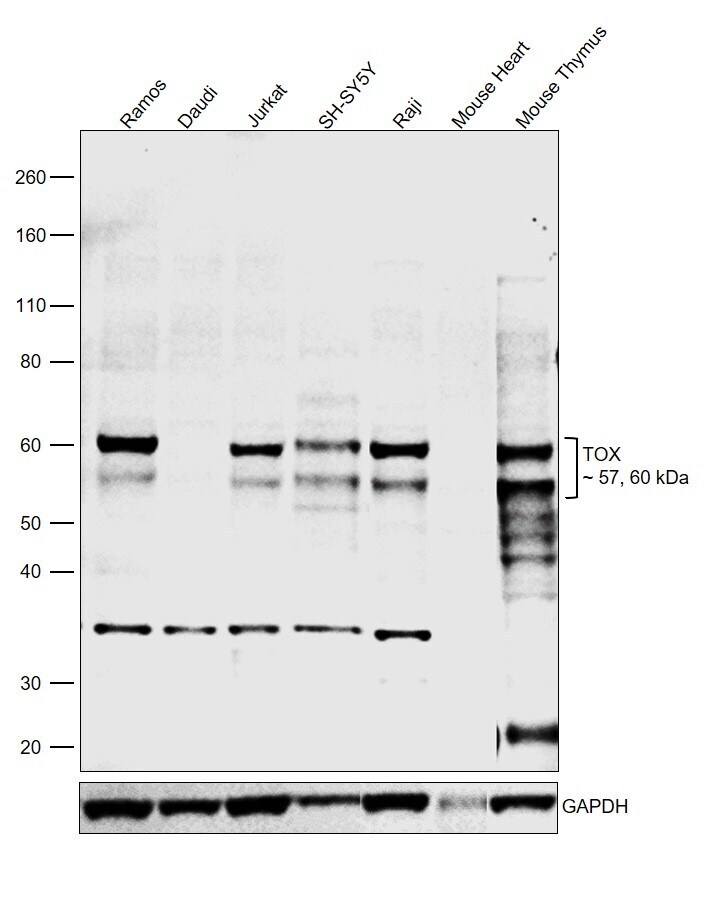
- Western Blot was performed using Anti-TOX Monoclonal Antibody (TXRX10), eBioscience™ (Product # 14-6502-80, 14-6502-82) and 57, 60 kDa bands corresponding to Thymocyte selection-associated high mobility group box protein TOX were observed. Nuclear enriched extracts (40 µg lysate) of Ramos (Lane 1), Daudi (Lane 2), Jurkat (Lane 3), SH-SY5Y (Lane 4), Raji (Lane 5) and tissue extracts (40 µg lysate) of Mouse Heart (Lane 6), Mouse Thymus (Lane 7) were electrophoresed using NuPAGE™ 4-12% Bis-Tris Protein Gel (Product # NP0322BOX). Resolved proteins were then transferred onto a nitrocellulose membrane (Product # IB23001) by iBlot® 2 Dry Blotting System (Product # IB21001). The blot was probed with the primary antibody (5 µg/mL) and detected by chemiluminescence with F(ab2-Rabbit anti-Rat IgG (H+L Secondary Antibody, HRP (Product # PA1-29927, 1:10000) using the iBright FL 1000 (Product # A32752). Chemiluminescent detection was performed using SuperSignal™ West Atto Ultimate Sensitivity Substrate (Product # A38556). Relative expression was observed between Ramos and Daudi as expected (https://doi.org/10.1371/journal.pone.0229743).
Supportive validation
- Submitted by
- Invitrogen Antibodies (provider)
- Main image

- Experimental details
- Figure 1. Generation of Tox -/- mice. (A) Schematic of gene-targeting strategy to delete genomic region surrounding exon 1 of the Tox gene. The location of loxP sites (triangles), exon 1 (black box), transcription start sites (ATG; large arrows), and genomic PCR primers (small arrows) is shown. Location and direction of selectable marker gene cassettes encoding thymidine kinase (HSVTk) and neomycin resistance (PGKneo) are also depicted. Restriction enzymes sites in Tox are indicated. H, HindIII; Nh, NheI; N, NcoI; B, BglII. (B) Genomic PCR for Tox in total thymocytes from Tox +/+ (+/+), Tox +/- (+/-), and Tox -/- (-/-) mice using combinations of primers shown in A demonstrates expected genomic structure of the targeted locus. (C and D) Loss of Tox mRNA demonstrated by RT-PCR (C) and TOX protein analyzed by immunoblotting (D) in total thymocytes from gene-targeted mice. Expression of the Actb gene and beta-actin protein was used for controls. In this and all subsequent figures, protein masses are based on relative mobility in SDS-PAGE.

- Submitted by
- Invitrogen Antibodies (provider)
- Main image

- Experimental details
- Figure 7 Vav1 DeltaC -driven CD4 + T-cell proliferation requires ICN1 and proper calcineurin signaling A, B Representative FACS plots (A) and quantification (B) of the EGFP + CD4 + T-cell proliferation in the different experimental groups (right) and indicated experimental conditions (top) using the Cell Trace Violet detection method. In A, gray shaded histograms represent the fluorescence obtained from nonstimulated CD4 + T cells before stimulation and retroviral transduction. n = 3 independent experiments. C-E Flow cytometry determination of intracellular Tox (C), intracellular ICN1 (D), and surface ICOS (E) levels in EGFP + CD4 + T cells expressing the indicated Vav1 proteins. f.i., mean fluorescence intensity relative to the isotype-matched control antibody. n = 3 independent experiments. F Summary of the Vav1-regulated signaling pathways that contribute to promote the proliferation of primary CD4 + T cells that have been unveiled in this work. The other downstream effectors and pathways of Vav1 are indicated. The main primary effectors as shown in red. Data information: In panels (B, C, D, and E), values are shown as means +- SEM from three independent experiments. P -values are given relative to nontreated (light blue asterisks) and treated (dark blue asterisks) EGFP + cells. We also include P -values for the values exhibited by each experimental group relative to those obtained in nontreated condition (black asterisks). * P