Antibody data
- Antibody Data
- Antigen structure
- References [3]
- Comments [0]
- Validations
- Western blot [2]
- Immunohistochemistry [1]
- Other assay [3]
Submit
Validation data
Reference
Comment
Report error
- Product number
- PA5-49715 - Provider product page

- Provider
- Invitrogen Antibodies
- Product name
- KGF Polyclonal Antibody
- Antibody type
- Polyclonal
- Antigen
- Synthetic peptide
- Description
- The antibody detects endogenous level of total FGF7 protein.
- Reactivity
- Human, Mouse, Rat
- Host
- Rabbit
- Isotype
- IgG
- Vial size
- 100 µL
- Concentration
- 0.4 mg/mL
- Storage
- -20° C, Avoid Freeze/Thaw Cycles
Submitted references FGF7-induced E11 facilitates cell-cell communication through connexin43.
Efficient Surface Immobilization of Chemically Modified Hyaluronans for Enhanced Bioactivity and Survival of In Vitro-Cultured Embryonic Salivary Gland Mesenchymal Cells.
microRNA-155 inhibition restores Fibroblast Growth Factor 7 expression in diabetic skin and decreases wound inflammation.
Liu X, Bai M, Sun Y, Hu X, Wang C, Xie J, Ye L
International journal of biological sciences 2021;17(14):3862-3874
International journal of biological sciences 2021;17(14):3862-3874
Efficient Surface Immobilization of Chemically Modified Hyaluronans for Enhanced Bioactivity and Survival of In Vitro-Cultured Embryonic Salivary Gland Mesenchymal Cells.
Lee SW, Kim J, Cong X, Yu GY, Ryu JH, Park K
Polymers 2021 Apr 9;13(8)
Polymers 2021 Apr 9;13(8)
microRNA-155 inhibition restores Fibroblast Growth Factor 7 expression in diabetic skin and decreases wound inflammation.
Moura J, Sørensen A, Leal EC, Svendsen R, Carvalho L, Willemoes RJ, Jørgensen PT, Jenssen H, Wengel J, Dalgaard LT, Carvalho E
Scientific reports 2019 Apr 9;9(1):5836
Scientific reports 2019 Apr 9;9(1):5836
No comments: Submit comment
Supportive validation
- Submitted by
- Invitrogen Antibodies (provider)
- Main image

- Experimental details
- Western blot analysis of FGF7 was performed by loading Lane1: Human gastric cancer tissue lysate (40µg), Lane2: Human esophagus cancer tissue lysate (40µg) on to a 10% SDS-PAGE gel. Proteins were transferred to a membrane and the membrane was probed with a FGF7 antibody (Product # PA5-49715) at a 1/1250 dilution for 1 second, followed by Donkey anti Rabbit IgG - H&L (HRP) at 1/5000 dilution.
- Submitted by
- Invitrogen Antibodies (provider)
- Main image

- Experimental details
- Western blot analysis of FGF7 was performed by loading Lane1: Human gastric cancer tissue lysate (40µg), Lane2: Human esophagus cancer tissue lysate (40µg) on to a 10% SDS-PAGE gel. Proteins were transferred to a membrane and the membrane was probed with a FGF7 antibody (Product # PA5-49715) at a 1/1250 dilution for 1 second, followed by Donkey anti Rabbit IgG - H&L (HRP) at 1/5000 dilution.
Supportive validation
- Submitted by
- Invitrogen Antibodies (provider)
- Main image

- Experimental details
- Immunohistochemical analysis of KGF in paraffin-embedded Human esophagus cancer tissue using (left) KGF Polyclonal Antibody (Product # PA5-49715) at a 1:15 dilution and (right) is treated with the synthetic peptide.
Supportive validation
- Submitted by
- Invitrogen Antibodies (provider)
- Main image

- Experimental details
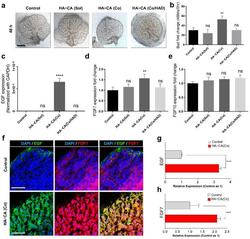
- Figure 4 ( a ) Bright-field images of E13 eSMGs cultured for 48 h in control, solubilized HA-CA (HA-CA (Sol) ), HA-CA-coated surfaces (HA-CA (Co) ), and hyaluronidase-treated HA-CA-coated surfaces (HA-CA (Co/HAD) ). Scale bar = 200 um ( n = 4). ( b ) Bud number fold changes (48 h/0 h) of eSMGs cultured in each group ( n = 4). ( c - e ) mRNA expression level of ( c ) EGF, ( d ) FGF7, and ( e ) FGF10 in eSMGs cultured for 48 h under each condition ( n = 3). ( f ) Immunofluorescence images of mesenchymal EGF (green) and FGF7 (red) expression in eSMGs cultured for 48 h on control and HA-CA-coated surface. DAPI (blue). Scale bar = 50 um ( n = 3). Quantification of mesenchymal ( g ) EGF and ( h ) FGF7 expression based on the immunofluorescence images. Control (gray) and HA-CA (Co) (red) ( n = 4). Data are expressed as average +- SEM ( Figure 4 b-h). ** p < 0.01, **** p < 0.001, ns = non-significant ( p > 0.05) by unpaired t -test ( Figure 4 g,h) and one-way ANOVA with Dunnett''s test ( Figure 4 b-e).
- Submitted by
- Invitrogen Antibodies (provider)
- Main image

- Experimental details
- Figure 1 The high expression of Fgf7 of osteoblasts and the distribution of FGF7 in bone tissue. (A) RNA sequencing results showing the whole fibroblast growth factor family members and receptor members of primary osteoblasts. The data were presented as log (FPKM + 1) and showed the higher mRNA expression of Fgf7 among other FGF ligand members. FPKM: Fragments per Kilobase of transcript per Million fragments mapped. The results were based on three independent samples (n = 3). (B) IHC showing the distribution of FGF7 in the femur of 4 weeks wild-type C57 mice. Fast green is used to counterstain the background. Boxed areas further showing that FGF7 is partly generated by osteoblasts on the surface of trabecular bone within the secondary ossification center (boxed area 1) and subchondral bone (boxed area 2).
- Submitted by
- Invitrogen Antibodies (provider)
- Main image

- Experimental details
- Figure 7 Topical administration of miR-155 inhibitor restores FGF7 expression. ( A ) Representative images of FGF7 protein expression assessed by fluorescence microscopy on mouse wound skin tissue of non-diabetic (n = 4) and diabetic mice treated with Neg. Ctrl. oligo (control, n = 3), 2.5 nmol of miR-155 inhibitor (n = 3) or 2.5 nmol of Seed miR-155 inhibitor (n = 3), collected at day 10 post-wounding. Seed miR-155 inhibitor: LNA-oligonucleotides binding to seed region of miR-155. Blue - DAPI, Green - FGF7. ( B ) Quantification of FGF7 expression. Data are presented as mean +- SD of the percentage of non-diabetic condition. Data were analyzed using one-way ANOVA with Dunnet's post hoc correction; **p < 0.01, ***p < 0.001 vs non-diabetic.
 Explore
 Validate
 Learn
Learn Western blot
 ELISA
ELISA