 Explore
 Validate
 Learn
Learn Western blot
Antibody data
- Antibody Data
- Antigen structure
- References [14]
- Comments [0]
- Validations
- Western blot [5]
- Immunocytochemistry [2]
- Immunohistochemistry [3]
- Flow cytometry [2]
- Other assay [14]
Submit
Validation data
Reference
Comment
Report error
- Product number
- 42-6600 - Provider product page

- Provider
- Invitrogen Antibodies
- Product name
- PAX6 Polyclonal Antibody
- Antibody type
- Polyclonal
- Antigen
- Other
- Description
- 42-6600 has been successfully used in flow cytometry and immunofluorescence analysis of Pax6 in human neural stem cells derived from pluripotent stem cells and reacts with human samples.
- Reactivity
- Human, Mouse, Rat
- Host
- Rabbit
- Isotype
- IgG
- Vial size
- 100 µg
- Concentration
- 0.25 mg/mL
- Storage
- -20°C
Submitted references Nuclear Transporter IPO13 Is Central to Efficient Neuronal Differentiation.
Identification of cis-regulatory modules for adeno-associated virus-based cell-type-specific targeting in the retina and brain.
Multiplexed genome regulation in vivo with hyper-efficient Cas12a.
Aberrant Expression of Circulating MicroRNA Leads to the Dysregulation of Alpha-Synuclein and Other Pathogenic Genes in Parkinson's Disease.
Maternal Immune Activation Alters Fetal Brain Development and Enhances Proliferation of Neural Precursor Cells in Rats.
Computational fluid dynamic analysis of physical forces playing a role in brain organoid cultures in two different multiplex platforms.
Defining multistep cell fate decision pathways during pancreatic development at single-cell resolution.
Comparison of in vitro Neuronal Differentiation Capacity Between Mouse Epiblast Stem Cells Derived From Nuclear Transfer and Naturally Fertilized Embryos.
MicroRNA-365 modulates astrocyte conversion into neuron in adult rat brain after stroke by targeting Pax6.
In Vitro Generation of Vascular Wall-Resident Multipotent Stem Cells of Mesenchymal Nature from Murine Induced Pluripotent Stem Cells.
Development and Dynamic Regulation of Mitochondrial Network in Human Midbrain Dopaminergic Neurons Differentiated from iPSCs.
Norrin/Frizzled4 signalling in the preneoplastic niche blocks medulloblastoma initiation.
Mfn2 is Required for Mitochondrial Development and Synapse Formation in Human Induced Pluripotent Stem Cells/hiPSC Derived Cortical Neurons.
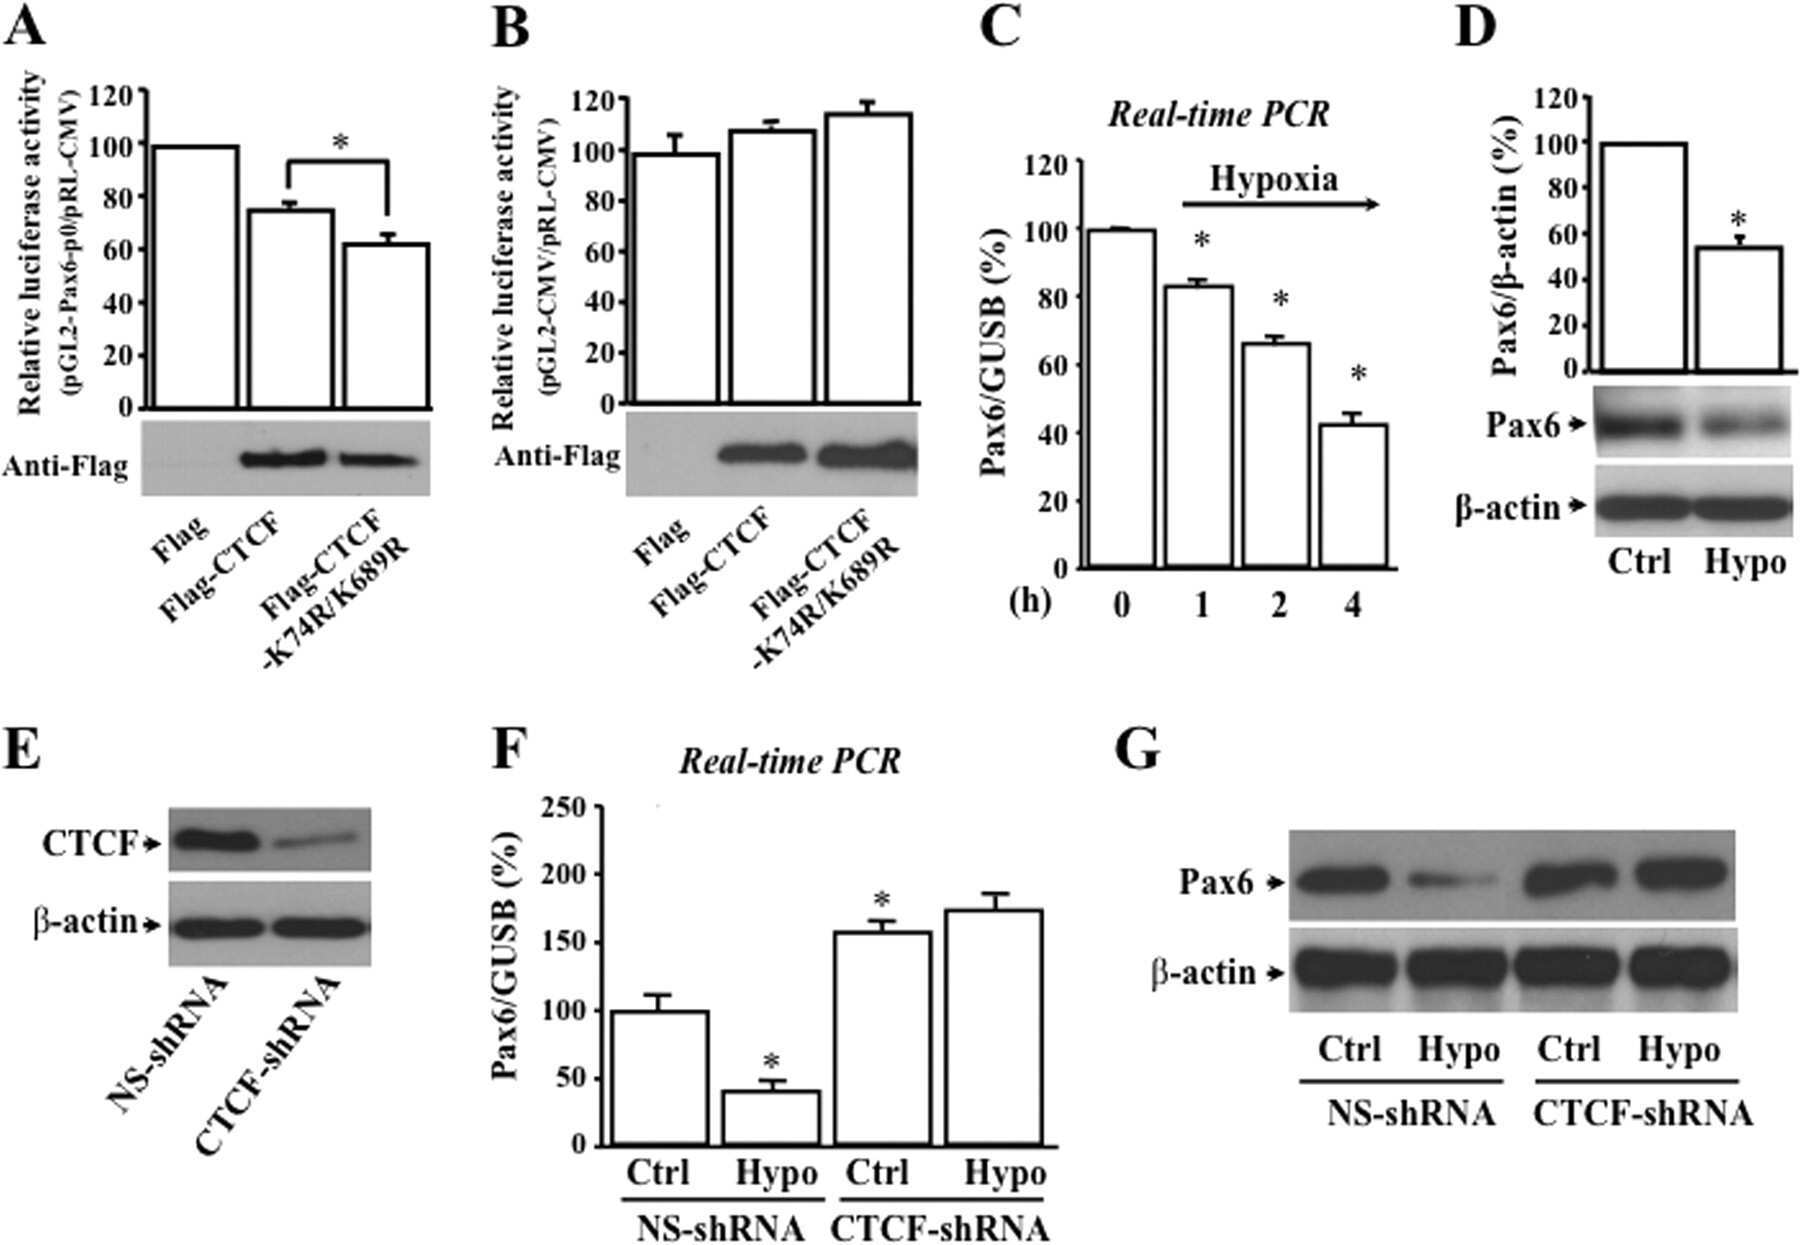
De-SUMOylation of CCCTC binding factor (CTCF) in hypoxic stress-induced human corneal epithelial cells.
Gajewska KA, Haynes JM, Jans DA
Cells 2022 Jun 12;11(12)
Cells 2022 Jun 12;11(12)
Identification of cis-regulatory modules for adeno-associated virus-based cell-type-specific targeting in the retina and brain.
Lin CH, Sun Y, Chan CSY, Wu MR, Gu L, Davis AE, Gu B, Zhang W, Tanasa B, Zhong LR, Emerson MM, Chen L, Ding JB, Wang S
The Journal of biological chemistry 2022 Apr;298(4):101674
The Journal of biological chemistry 2022 Apr;298(4):101674
Multiplexed genome regulation in vivo with hyper-efficient Cas12a.
Guo LY, Bian J, Davis AE, Liu P, Kempton HR, Zhang X, Chemparathy A, Gu B, Lin X, Rane DA, Xu X, Jamiolkowski RM, Hu Y, Wang S, Qi LS
Nature cell biology 2022 Apr;24(4):590-600
Nature cell biology 2022 Apr;24(4):590-600
Aberrant Expression of Circulating MicroRNA Leads to the Dysregulation of Alpha-Synuclein and Other Pathogenic Genes in Parkinson's Disease.
Cai M, Chai S, Xiong T, Wei J, Mao W, Zhu Y, Li X, Wei W, Dai X, Yang B, Liu W, Shu B, Wang M, Lu T, Cai Y, Zheng Z, Mei Z, Zhou Y, Yang J, Zhao J, Shen L, Ho JWK, Chen J, Xiong N
Frontiers in cell and developmental biology 2021;9:695007
Frontiers in cell and developmental biology 2021;9:695007
Maternal Immune Activation Alters Fetal Brain Development and Enhances Proliferation of Neural Precursor Cells in Rats.
Baines KJ, Hillier DM, Haddad FL, Rajakumar N, Schmid S, Renaud SJ
Frontiers in immunology 2020;11:1145
Frontiers in immunology 2020;11:1145
Computational fluid dynamic analysis of physical forces playing a role in brain organoid cultures in two different multiplex platforms.
Goto-Silva L, Ayad NME, Herzog IL, Silva NP, Lamien B, Orlande HRB, da Costa Souza A, Ribeiro S, Martins M, Domont GB, Junqueira M, Tovar-Moll F, Rehen SK
BMC developmental biology 2019 Mar 7;19(1):3
BMC developmental biology 2019 Mar 7;19(1):3
Defining multistep cell fate decision pathways during pancreatic development at single-cell resolution.
Yu XX, Qiu WL, Yang L, Zhang Y, He MY, Li LC, Xu CR
The EMBO journal 2019 Apr 15;38(8)
The EMBO journal 2019 Apr 15;38(8)
Comparison of in vitro Neuronal Differentiation Capacity Between Mouse Epiblast Stem Cells Derived From Nuclear Transfer and Naturally Fertilized Embryos.
Li T, Zheng Y, Li Y, Ye D
Frontiers in molecular neuroscience 2018;11:392
Frontiers in molecular neuroscience 2018;11:392
MicroRNA-365 modulates astrocyte conversion into neuron in adult rat brain after stroke by targeting Pax6.
Mo JL, Liu Q, Kou ZW, Wu KW, Yang P, Chen XH, Sun FY
Glia 2018 Jul;66(7):1346-1362
Glia 2018 Jul;66(7):1346-1362
In Vitro Generation of Vascular Wall-Resident Multipotent Stem Cells of Mesenchymal Nature from Murine Induced Pluripotent Stem Cells.
Steens J, Zuk M, Benchellal M, Bornemann L, Teichweyde N, Hess J, Unger K, Görgens A, Klump H, Klein D
Stem cell reports 2017 Apr 11;8(4):919-932
Stem cell reports 2017 Apr 11;8(4):919-932
Development and Dynamic Regulation of Mitochondrial Network in Human Midbrain Dopaminergic Neurons Differentiated from iPSCs.
Fang D, Qing Y, Yan S, Chen D, Yan SS
Stem cell reports 2016 Oct 11;7(4):678-692
Stem cell reports 2016 Oct 11;7(4):678-692
Norrin/Frizzled4 signalling in the preneoplastic niche blocks medulloblastoma initiation.
Bassett EA, Tokarew N, Allemano EA, Mazerolle C, Morin K, Mears AJ, McNeill B, Ringuette R, Campbell C, Smiley S, Pokrajac NT, Dubuc AM, Ramaswamy V, Northcott PA, Remke M, Monnier PP, Potter D, Paes K, Kirkpatrick LL, Coker KJ, Rice DS, Perez-Iratxeta C, Taylor MD, Wallace VA
eLife 2016 Nov 8;5
eLife 2016 Nov 8;5
Mfn2 is Required for Mitochondrial Development and Synapse Formation in Human Induced Pluripotent Stem Cells/hiPSC Derived Cortical Neurons.
Fang D, Yan S, Yu Q, Chen D, Yan SS
Scientific reports 2016 Aug 18;6:31462
Scientific reports 2016 Aug 18;6:31462
De-SUMOylation of CCCTC binding factor (CTCF) in hypoxic stress-induced human corneal epithelial cells.
Wang J, Wang Y, Lu L
The Journal of biological chemistry 2012 Apr 6;287(15):12469-79
The Journal of biological chemistry 2012 Apr 6;287(15):12469-79
No comments: Submit comment
Supportive validation
- Submitted by
- Invitrogen Antibodies (provider)
- Main image

- Experimental details
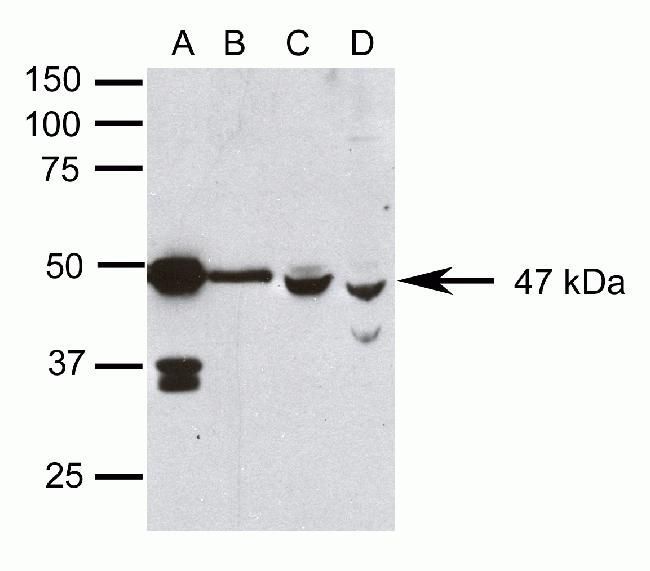
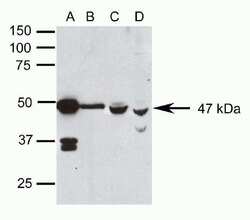
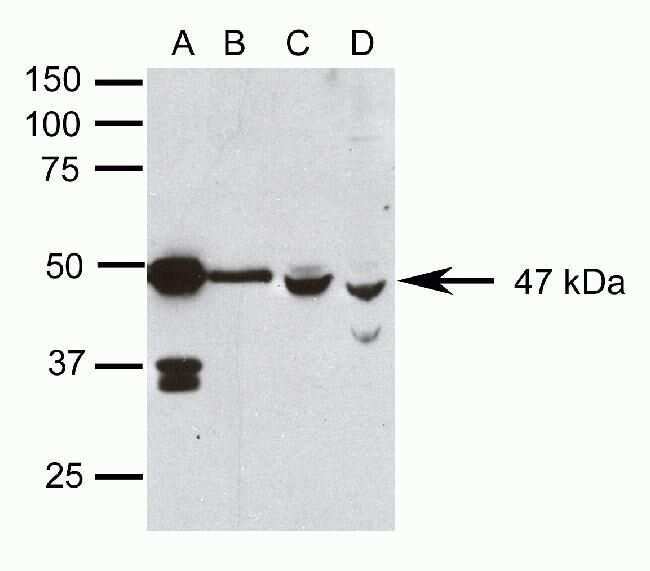
- Western blot analysis of (A) rat eye, (B) adult mouse brain, and (C) fetal mouse brain homogenates and (D) WERI-RB-1 cell lysates using Rb anti-Pax6 (Product # 42-6600).
- Submitted by
- Invitrogen Antibodies (provider)
- Main image
- Experimental details
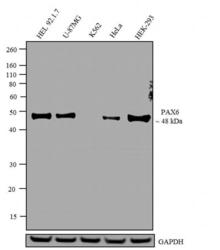
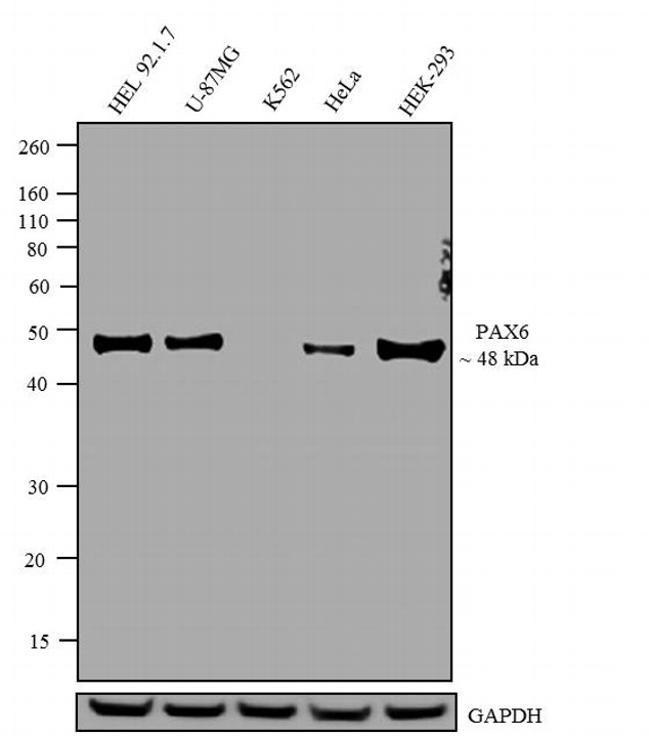
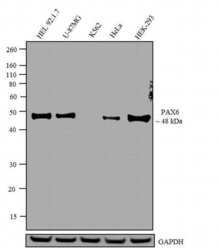
- Western blot analysis was performed on whole cell extracts (30 µg lysate) of HEL 92.1.7 (Lane 1), U-87MG (Lane 2), K562 (Lane 3), HeLa (Lane 4), and HEK-293 (Lane 5). The blots were probed with Anti-Pax6 Rabbit Polyclonal Antibody (Product # 42-6600, 1-2 µg/mL) and detected by chemiluminescence using Goat anti-Rabbit IgG (H+L) Secondary Antibody, HRP conjugate (Product # G-21234, 1:5000 dilution). A ~ 48 kDa band corresponding to Pax6 was observed across cell lines tested except K562. Known quantity of protein samples were electrophoresed using Novex® NuPAGE® 12 % Bis-Tris gel (Product # NP0342BOX), XCell SureLock™ Electrophoresis System (Product # EI0002) and Novex® Sharp Pre-Stained Protein Standard (Product # LC5800). Resolved proteins were then transferred onto a nitrocellulose membrane with iBlot® 2 Dry Blotting System (Product # IB21001). The membrane was probed with the relevant primary and secondary Antibody following blocking with 5 % skimmed milk. Chemiluminescent detection was performed using Pierce™ ECL Western Blotting Substrate (Product # 32106).
- Submitted by
- Invitrogen Antibodies (provider)
- Main image

- Experimental details
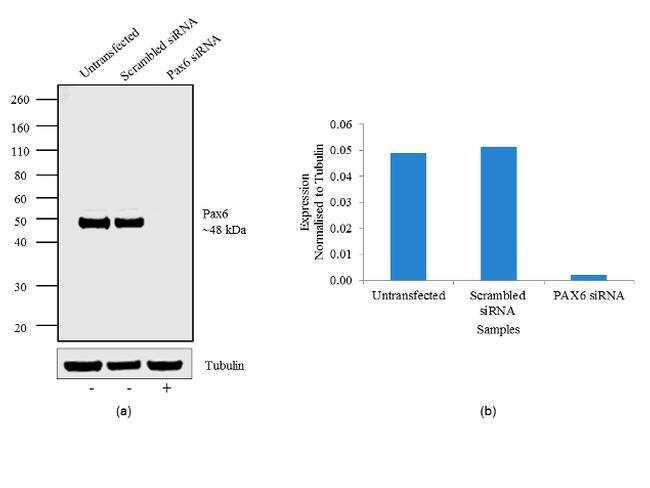
- Knockdown of Pax6 was achieved by transfecting HeLa cells with Pax6 specific siRNAs (Silencer® select Product # s10067 and Product # s10069). Western blot analysis (Fig a) was performed using nuclear enriched cell lysates from the Pax6 knock down cells (lane 3), non-specific scrambled siRNA transfected cells (lane 2) and untransfected cells (lane 1). The blots were probed with Anti-Pax6 Rabbit Polyclonal Antibody (Product # 42-6600, 1-2 µg/mL) and Goat anti-Rabbit IgG (H+L) Secondary Antibody, HRP conjugate (Product # G-21234, 1:5000 dilution). Densitometric analysis of this western blot is shown in histogram (Fig b). Loss of signal upon siRNA mediated knock down confirms that antibody is specific to Pax6.
- Submitted by
- Invitrogen Antibodies (provider)
- Main image
- Experimental details
- Western blot analysis was performed on whole cell extracts (30 µg lysate) of HEL 92.1.7 (Lane 1), U-87MG (Lane 2), K562 (Lane 3), HeLa (Lane 4), and HEK-293 (Lane 5). The blots were probed with Anti-Pax6 Rabbit Polyclonal Antibody (Product # 42-6600, 1-2 µg/mL) and detected by chemiluminescence using Goat anti-Rabbit IgG (H+L) Secondary Antibody, HRP conjugate (Product # G-21234, 1:5000 dilution). A ~ 48 kDa band corresponding to Pax6 was observed across cell lines tested except K562. Known quantity of protein samples were electrophoresed using Novex® NuPAGE® 12 % Bis-Tris gel (Product # NP0342BOX), XCell SureLock™ Electrophoresis System (Product # EI0002) and Novex® Sharp Pre-Stained Protein Standard (Product # LC5800). Resolved proteins were then transferred onto a nitrocellulose membrane with iBlot® 2 Dry Blotting System (Product # IB21001). The membrane was probed with the relevant primary and secondary Antibody following blocking with 5 % skimmed milk. Chemiluminescent detection was performed using Pierce™ ECL Western Blotting Substrate (Product # 32106).

- Submitted by
- Invitrogen Antibodies (provider)
- Main image
- Experimental details
- Western blot analysis of (A) rat eye, (B) adult mouse brain, and (C) fetal mouse brain homogenates and (D) WERI-RB-1 cell lysates using Rb anti-Pax6 (Product # 42-6600).
Supportive validation
- Submitted by
- Invitrogen Antibodies (provider)
- Main image
- Experimental details
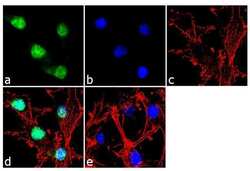
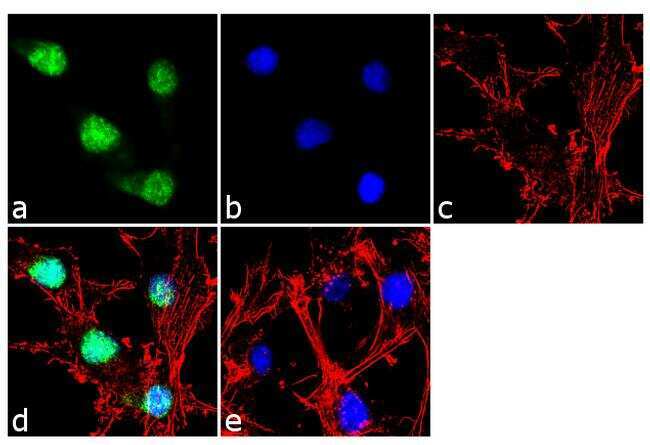
- Immunofluorescence analysis of PAX6 was done on 70% confluent log phase U-87MG cells. The cells were fixed with 4% paraformaldehyde for 10 minutes, permeabilized with 0.1% Triton™ X-100 for 10 minutes, and blocked with 1% BSA for 1 hour at room temperature. The cells were labeled with PAX6 Rabbit Polyclonal Antibody (Product # 42-6600) at 2 µg/mL in 0.1% BSA and incubated for 3 hours at room temperature and then labeled with Goat anti-Rabbit IgG (H+L) Superclonal™ Secondary Antibody, Alexa Fluor® 488 conjugate (Product # A27034) at a dilution of 1:2000 for 45 minutes at room temperature (Panel a: green). Nuclei (Panel b: blue) were stained with SlowFade® Gold Antifade Mountant with DAPI (Product # S36938). F-actin (Panel c: red) was stained with Alexa Fluor® 555 Rhodamine Phalloidin (Product # R415, 1:300). Panel d is a merged image showing nuclear localization. Panel e is a no primary antibody control. The images were captured at 60X magnification.
- Submitted by
- Invitrogen Antibodies (provider)
- Main image
- Experimental details
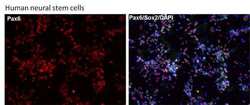
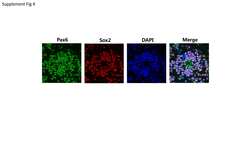
- Immunofluorescent analysis of Pax6 (red) in human neural stem cells derived from PD-3 iPSCs using Gibco® PSC Neural Induction Medium (Product # A1647801). The cells were fixed and permeabilized using Image-IT® Fixation/Permeabilization kit (Product # R37602), and blocked with the including blocking buffer for one hour at room temperature. Cells were stained with a Pax6 polyclonal antibody (Product # 42-6600) at a dilution of 1:100 and a Sox2 monoclonal antibody (Product # MA1-014) at a dilution of 1:200 in blocking buffer for 3 hours at room temperature, and then incubated with a DyLight 594-conjugated goat anti-rabbit IgG (Product # 35561) and a DyLight 488-conjugated goat anti-mouse IgG secondary antibody (Product # 35502) at a dilution of 1:250 for 1 hour at room temperature. Nucleus DNA (blue) was stained with DAPI (Product # D1306). Images were taken on an EVOS® FLoid® Cell Imaging Station at 10X magnification.

Supportive validation
- Submitted by
- Invitrogen Antibodies (provider)
- Main image
- Experimental details
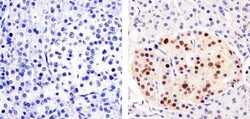
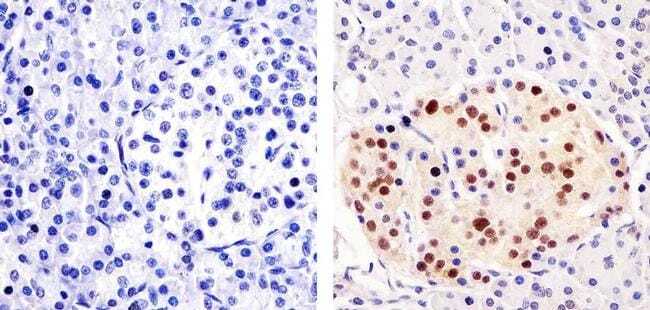
- Immunohistochemistry analysis of PAX6 showing staining in the nucleus of paraffin-embedded human pancreas tissue (right) compared to a negative control without primary antibody (left). To expose target proteins, antigen retrieval was performed using 10mM sodium citrate (pH 6.0), microwaved for 8-15 min. Following antigen retrieval, tissues were blocked in 3% H2O2-methanol for 15 min at room temperature, washed with ddH2O and PBS, and then probed with a Anti- PAX6 Polyclonal Antibody (Product # 42-6600) diluted in 3% BSA-PBS at a dilution of 1:100 overnight at 4ºC in a humidified chamber. Tissues were washed extensively in PBST and detection was performed using an HRP-conjugated secondary antibody followed by colorimetric detection using a DAB kit. Tissues were counterstained with hematoxylin and dehydrated with ethanol and xylene to prep for mounting.
- Submitted by
- Invitrogen Antibodies (provider)
- Main image
- Experimental details
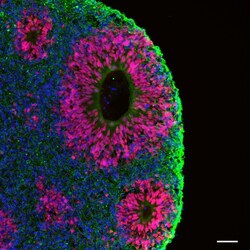
- Immunofluorescent analysis of beta-3 Tubulin (green) and PAX6 (red) in human iPSC-derived forebrain organoids derived at Day 40. The organoids were fixed with 4% PFA for 1 hour at room temperature, followed by incubation with 30% sucrose solution overnight at 4°C. The organoids were then embedded in OCT and cryosectioned at 5 µm, permeabilized with 0.2% Triton X-100 for 20 min, and blocked with 10% donkey serum in PBS for 30 min at room temperature. Organoid slices were stained with a Mouse beta-3 Tubulin monoclonal antibody (green; Product # MA1-118) at a dilution of 1:500, and a Rabbit PAX6 polyclonal antibody (red; Product # 42-6600) at a dilution of 1:500 in blocking buffer overnight at 4°C, and then incubated with Donkey anti-Mouse Alexa Fluor 488 (Product # R37114) and Donkey anti-Rabbit Alexa Fluor 568 (Product # A10042) at a dilution of 1:1000 as well as DAPI (blue; 1:25000) in blocking solution at room temperature for 1 hour. Images were taken at 20X magnification. Scale bar: 50 µm. Data courtesy of Dr. Zhexing Wen at Emory University.

- Submitted by
- Invitrogen Antibodies (provider)
- Main image

- Experimental details
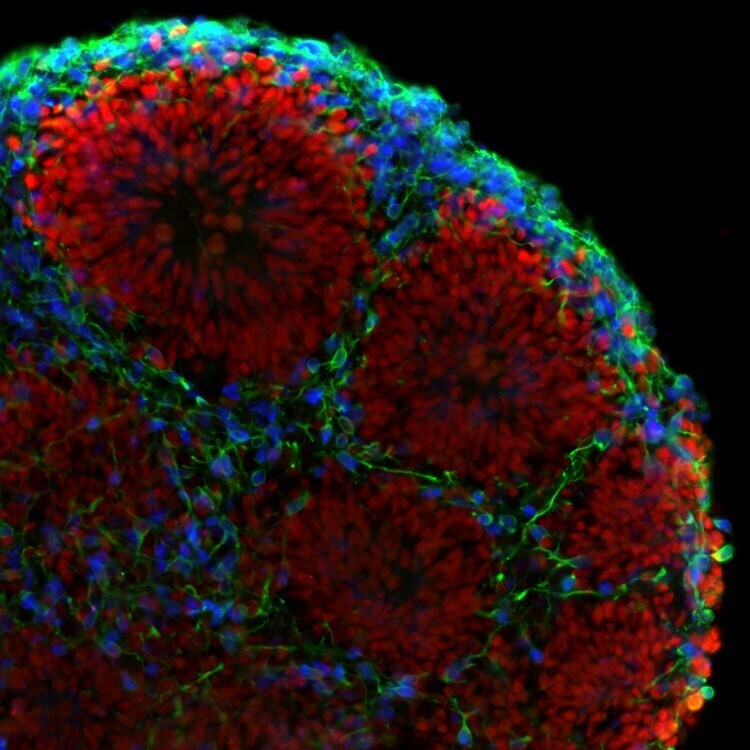
- Immunofluorescent analysis of beta-3 Tubulin (green), PAX6 (red), and CTIP2 (blue) in human iPSC-derived forebrain organoids derived at Day 40. The organoids were fixed with 4% PFA for 1 hour at room temperature, followed by incubation with 30% sucrose solution overnight at 4°C. The organoids were then embedded in OCT and cryosectioned at 5 µm, permeabilized with 0.2% Triton X-100 for 20 min, and blocked with 10% donkey serum in PBS for 30 min at room temperature. Organoid slices were stained with a Mouse beta-3 Tubulin monoclonal antibody (green; Product # MA1-118) at a dilution of 1:500, a Rabbit PAX6 polyclonal antibody (red; Product # 42-6600) at a dilution of 1:500, and a Rat CTIP2 polyclonal antibody (blue) at a dilution of 1:300 in blocking buffer overnight at 4°C, and then incubated with Donkey anti-Mouse Alexa Fluor 488 (Product # R37114), Donkey anti-Rabbit Alexa Fluor 568 (Product # A10042), and Goat anti-Rat Alexa Fluor 350 (Product # A-21093) at a dilution of 1:1000 in blocking solution at room temperature for 1 hour. Images were taken at 20X magnification. Data courtesy of Dr. Zhexing Wen at Emory University.
Supportive validation
- Submitted by
- Invitrogen Antibodies (provider)
- Main image
- Experimental details
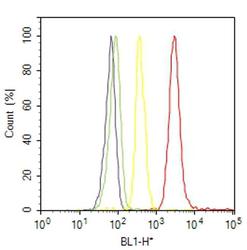
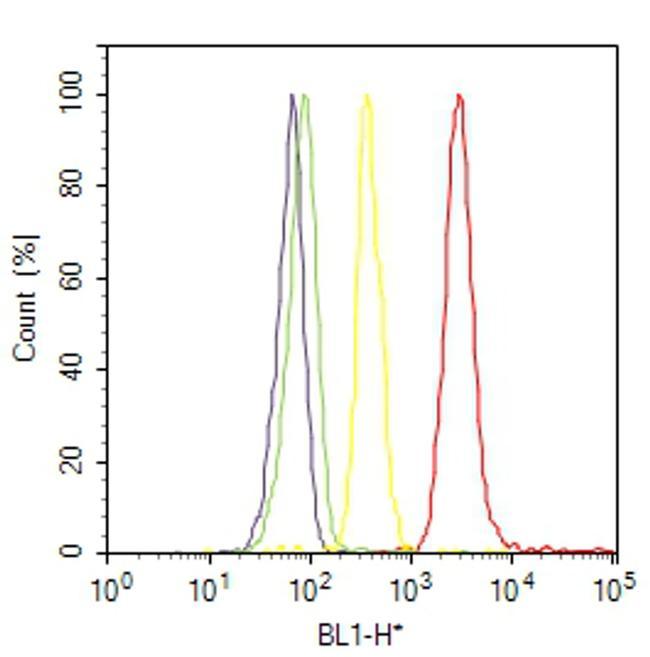
- Flow cytometry analysis of PAX6 was done on U-87 MG cells. Cells were fixed with 70% ethanol for 10 minutes, permeabilized with 0.25% Triton™ X-100 for 20 minutes, and blocked with 5% BSA for 30 minutes at room temperature. Cells were labeled with PAX6 Rabbit Polyclonal Antibody (426600, red histogram) or with rabbit isotype control (yellow histogram) at 3-5 ug/million cells in 2.5% BSA. After incubation at room temperature for 2 hours, the cells were labeled with Alexa Fluor® 488 Goat Anti-Rabbit Secondary Antibody (A11008) at a dilution of 1:400 for 30 minutes at room temperature. The representative 10,000 cells were acquired and analyzed for each sample using an Attune® Acoustic Focusing Cytometer. The purple histogram represents unstained control cells and the green histogram represents no-primary-antibody control..
- Submitted by
- Invitrogen Antibodies (provider)
- Main image
- Experimental details
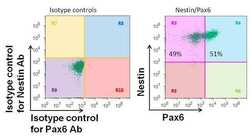
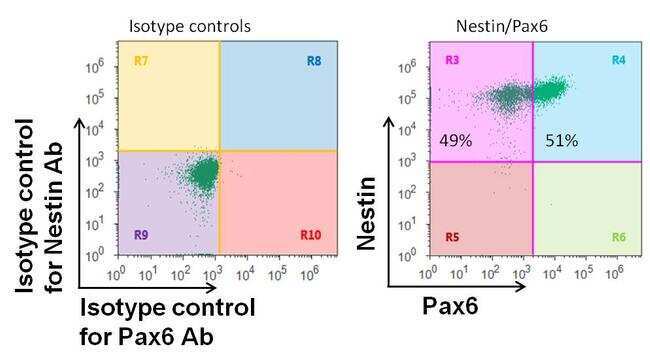
- Flow cytometry analysis of Pax6 on human neural stem cells derived from PD-3 iPSCs using Gibco® PSC Neural Induction Medium (Product # A1647801). Cells were fixed, permeabilized, and then stained with a Pax6 polyclonal antibody (Product # 42-6600) at a 1:100 dilution and a Nestin mouse monoclonal antibody (Product # MA1-110) at a 1:100 dilution. After incubation of the primary antibodies for 1 hour on ice, the cells were stained with Alexafluor® 488-conjugated goat anti-rabbit IgG secondary antibody (Product # A-11034) and Alexafluor® 647-conjugated donkey anti-mouse IgG secondary antibody (Product # A-31571) at a dilution of 1:500 for 1 hour on ice. Flow cytometry analysis was performed using the Attune® Acoustic Focusing Cytometer (Product # 4469120). A representative 10,000 cells were acquired for each sample.
Supportive validation
- Submitted by
- Invitrogen Antibodies (provider)
- Main image
- Experimental details
- NULL
- Submitted by
- Invitrogen Antibodies (provider)
- Main image

- Experimental details
- NULL
- Submitted by
- Invitrogen Antibodies (provider)
- Main image
- Experimental details
- NULL
- Submitted by
- Invitrogen Antibodies (provider)
- Main image
- Experimental details
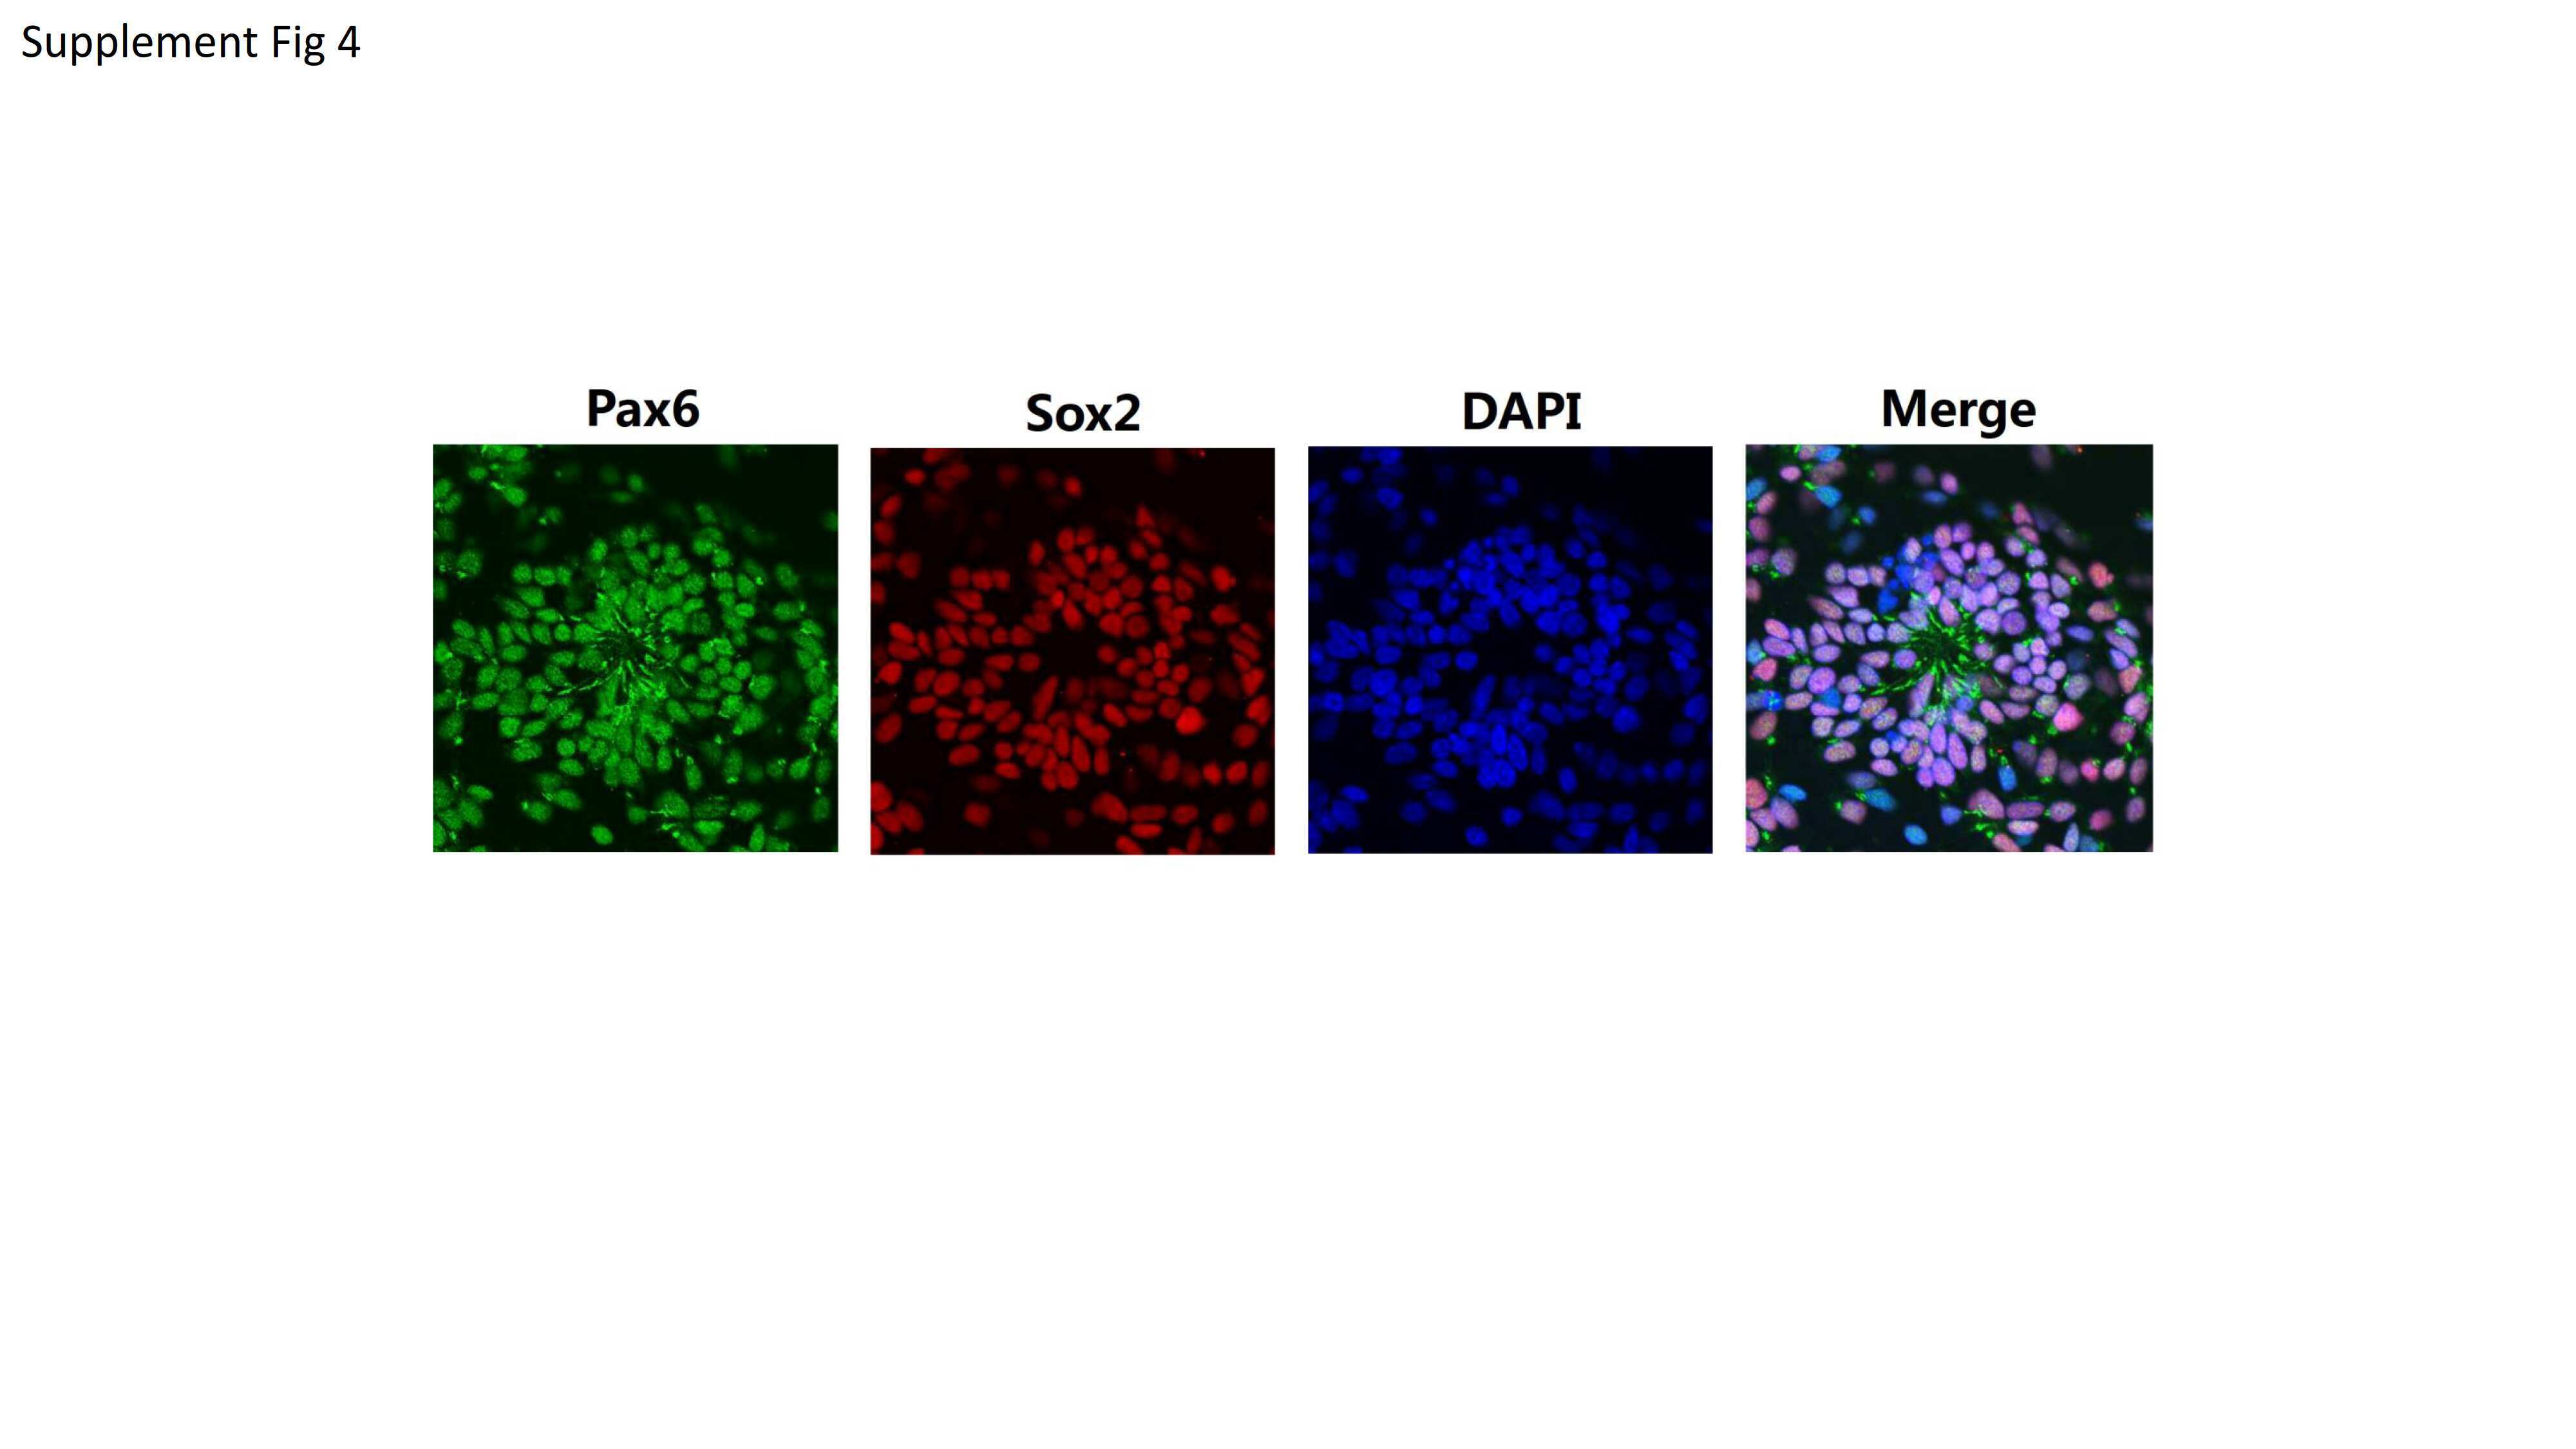
- FIGURE 4 Quantification of early neurons derived from F-mEpiSCs and NT-mEpiSCs. (A) Immunofluorescence staining for Nestin, Pax6, and Tuj1 of early neurons derived from F-mEpiSCs and NT-mEpiSCs; nuclei are shown using DAPI (B) Quantification of Tuj1-positive and Pax6-positive cells based on Tuj1 and Pax6 immunofluorescence staining. (C) Flow cytometry analysis of F-EpiSCs and NT-EpiSCs stained for the neuronal marker NeuroD1. Mouse Neuro-2A cells served as positive control for the staining. Data were acquired for a minimum of 10 x 10 3 events per sample using the FC500 flow cytometer and analyzed using the FlowJo software. Scale bar: 25 mum; n.s., P > 0.05; ** P < 0.01.

- Submitted by
- Invitrogen Antibodies (provider)
- Main image
- Experimental details
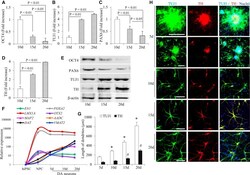
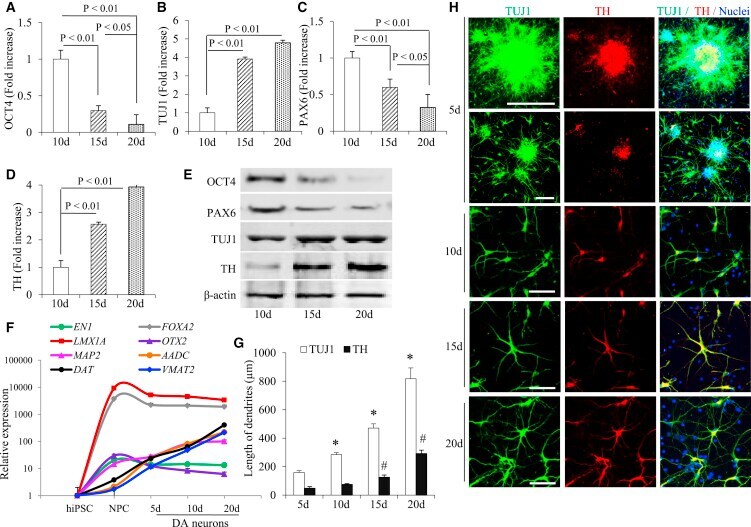
- Figure 1 Differentiation and Development of hiPSC Line-Induced Human DA Neurons (A-E) Expression of pluripotency marker (OCT4), precursor cells marker (PAX6), neuron-specific marker (neuron-specific class III beta-tubulin, TUJ1), and midbrain dopaminergic neuronal marker (TH) in neuronal populations in differentiation media for 10, 15, and 20 days. (A-D) Densitometry of the combined immunoreactive bands for OCT4 (A), PAX6 (B), TUJ1 (C), and TH (D) normalized to beta-actin using NIH ImageJ software. Data are expressed as fold increase relative to DA neurons cultured in differentiation media for 10 days (n = 3 independent experiments; mean +- SEM). (E) Representative immunoblots for OCT4, PAX6, TUJ1, TH, and beta-actin. beta-Actin was used as a protein loading control. (F) Real-time qPCR results for gene expression. The expression level of the undifferentiated hiPSC cells was set to 1 (n = 3 independent experiments). (G and H) Co-expression of TUJ1 and TH in hiPSC-induced neurons cultured in differentiation media for 5, 10, 15, and 20 days. Quantification of neuronal process length of TUJ1-positive neurons and TH-positive DA neurons in differentiation media for different days was performed using NIH ImageJ (G). # p < 0.01 compared with day-5 (5d) cells, length of TUJ1 positive dendrites, and * p < 0.01 compared with 5d cells, length of TH positive dendrites (n = 3 independent experiments; mean +- SEM, with 10 cells quantified per experiment). (H) Representative images for immun
- Submitted by
- Invitrogen Antibodies (provider)
- Main image
- Experimental details
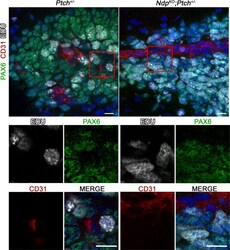
- Figure 8--figure supplement 1. Proliferating GNPs are present in the vicinity of blood vessels in Ptch +/- and Ndp KO ;Ptch +/- lesions . Confocal images of triple staining for Pax6, CD31 and EdU in lesions from P14 Ptch +/- (n = 2) and Ndp KO ;Ptch +/- (n = 3) mutants pulsed with EdU prior to sacrifice. Top row depicts composite maximum intensity projections, and boxed areas are shown below as individual z-stack slices. Scale bars, 10 um. DOI: http://dx.doi.org/

- Submitted by
- Invitrogen Antibodies (provider)
- Main image
- Experimental details
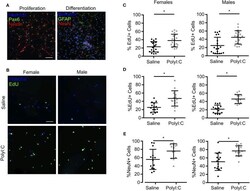
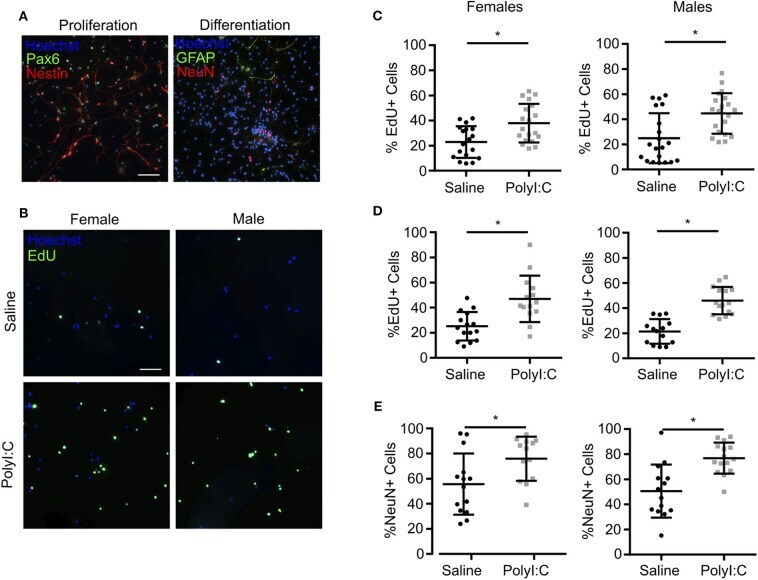
- Figure 5 NPCs isolated from fetal cortices challenged prenatally with PolyI:C exhibit increased proliferation potential. Pregnant rats were administered saline or PolyI:C on E8.5, and NPCs were isolated from E15.5 cortices for neurosphere culture. Neurospheres from male or female embryos were pooled, and then mechanically dissociated to form monolayers. Monolayers were subsequently cultured in media to promote stem or differentiated states. (A) Representative images of NPC monolayers cultured in proliferation conditions stained for Pax6 (green) and Nestin (red), or cultured in differentiation conditions stained for GFAP (green) and NeuN (red). Hoechst (blue) was used to counterstain nuclei. (B) Representative images of EdU incorporation in NPCs prepared in proliferation conditions from male and female cortices challenged prenatally with saline or PolyI:C 1 week prior. (C) Percentage of male and female NPCs that incorporated EdU during culture in proliferation conditions. (D) Percentage of male and female NPCs maintained in differentiation media that incorporated EdU. (E) Percentage of male and female NPCs maintained in differentiation media immunoreactive for NeuN indicating their differentiation capacity. Statistical analyses were performed using Student's t -test. Data are represented as mean +- SEM. Data significantly different ( P < 0.05) from controls are indicated by an asterisk (*2-3 fetuses per sex collected from at least 3 dams). Scale bar = 50 mum.
- Submitted by
- Invitrogen Antibodies (provider)
- Main image
- Experimental details
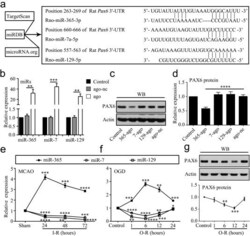
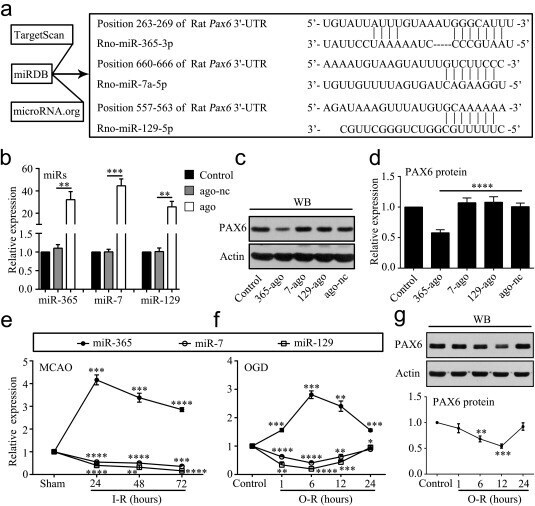
- Figure 1 MiR-365 is increased in the ischemic striatum and hypoxic cultured astrocytes. (a) Predicted miRs that have potential binding sites in the 3'-UTR of Pax6 using bioinformatics analysis. (b) qRT-PCR analysis of miR-365, miR-7 and miR-129 expression in cultured astrocytes 48 hr after transfection of their corresponding miR agomirs (ago) or agomir negative control (ago-nc). All miR expression levels were normalized to endogenous control U6 snRNA and relative to control ( n = 3). (c and d) Expression levels of PAX6 protein in cultured astrocytes 48 hr after transfection of miR-365-ago (365-ago), miR-7-ago (7-ago), miR-129-ago (129-ago), or ago-nc were analyzed by WB. All protein expression levels were normalized to endogenous control actin and relative to control ( n = 5). (e) qRT-PCR analysis of miR-365, miR-7 and miR-129 expression in the ipsilateral striatum at 24, 48, and 72 hr after ischemia-reperfusion (I-R) ( n = 3). (f) qRT-PCR analysis of miR-365, miR-7 and miR-129 expression in cultured astrocytes at 1, 6, 12, and 24 hr after OGD-reperfusion (O-R) ( n = 3). (g) Expression levels of PAX6 protein in cultured astrocytes at 1, 6, 12, and 24 hr after O-R were analyzed by western blotting (WB) ( n = 3). In e, f, and g, the p values are for comparisons versus the sham and control group, respectively; * p < .05, ** p < .01, *** p < .001, and **** p < .0001 by unpaired two-tailed Student's t test. In b and d, ** p < .01, *** p < .001, and **** p < .0001 by
- Submitted by
- Invitrogen Antibodies (provider)
- Main image

- Experimental details
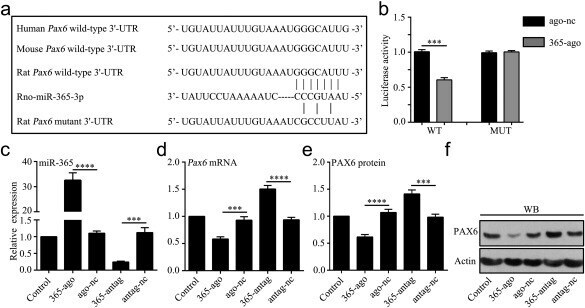
- Figure 2 MiR-365 directly targets PAX6 expression in cultured astrocytes. (a) Nucleotide sequence of the predicted miR-365 binding site in the 3'-UTR of Pax6 . Shown are the seed sequence (CCCGUAA), wild-type miR-365 binding site (GGGCAUU) and the mutated miR-365 binding site (CGCCUUA). (b) Luciferase assay in 293T cells 48 hr after transfection of luciferase reporter plasmid containing wild-type (WT) or mutant (MUT) Pax6 3'-UTR, together with 365-ago or ago-nc. Luciferase activity was calculated as renilla over firefly luciferase ( n = 3). (c) qRT-PCR analysis of miR-365 expression in cultured astrocytes 48 hr after transfection of 365-ago, ago-nc, miR-365 antagomir (365-antag) or antagomir negative control (antag-nc) ( n = 3). (d-f) Expression levels of Pax6 mRNA and PAX6 protein in cultured astrocytes 48 hr after different treatments were analyzed by qRT-PCR and WB, respectively. All mRNA expression levels were normalized to endogenous control actin mRNA ( n = 5). In b, *** p < .001 by unpaired two-tailed Student's t test; In c, d, and e, *** p < .001 and **** p < .0001 by one-way ANOVA with Tukey's post-hoc test. The data are presented as the means +- SEM
- Submitted by
- Invitrogen Antibodies (provider)
- Main image
- Experimental details
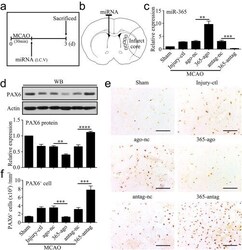
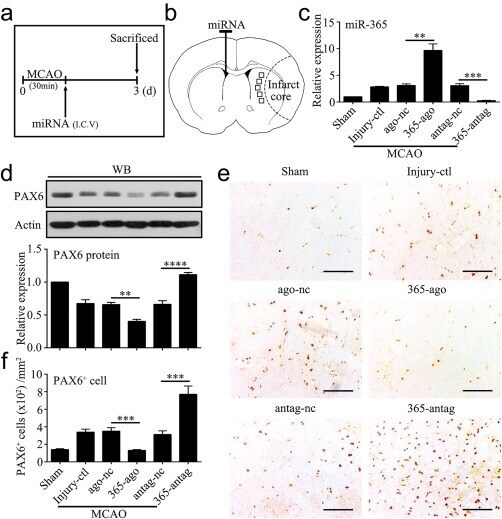
- Figure 3 MiR-365 antagomir increases PAX6 protein and PAX6-positive cells in the ischemic striatum. (a) Illustration of animal experimental protocol. (b) Schematic of the brain showing the injection position of miRNA (contralateral ventricle) and the areas of immunoreactive cells counting (five fields of view). (c) qRT-PCR analysis of miR-365 expression in the ipsilateral striatum of rats 3 days after MCAO ( n = 3). Injury control rats (Injury-ctl) indicated MCAO-operated rats without other interventions. (d) Expression levels of PAX6 protein in the ipsilateral striatum of rats 3 days after MCAO were analyzed by Western blotting (WB) ( n = 5). (e) Representative images of immunolabeling of PAX6 in the brain sections of rats 3 days after MCAO. Scale bars: 100 mum. (f) The number of PAX6 + cell was counted as the average of the number of positive cells in the five fields of view ( n = 5). ** p < .01, *** p < .001, and **** p < .0001 by one-way ANOVA with Tukey's post-hoc test. The data are presented as the means +- SEM [Color figure can be viewed at http://wileyonlinelibrary.com ]
- Submitted by
- Invitrogen Antibodies (provider)
- Main image

- Experimental details
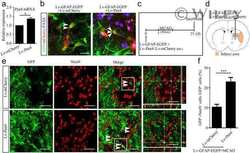
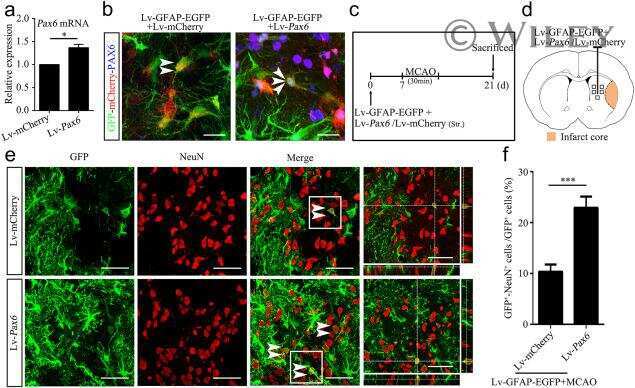
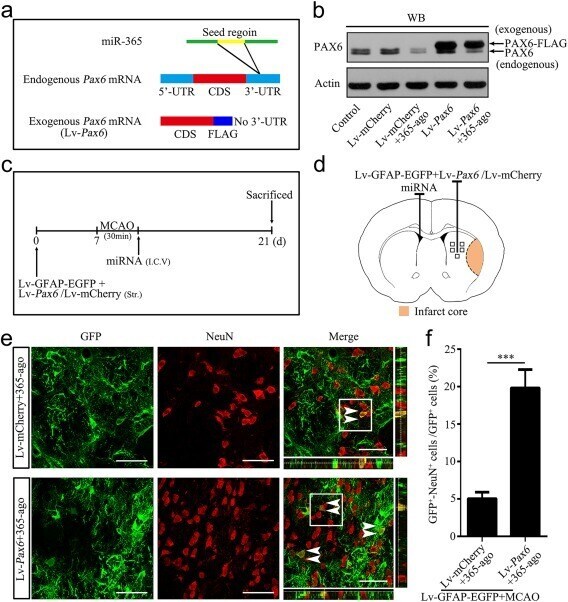
- Figure 7 Overexpression of PAX6 abolishes the miR-365-mediated inhibition of astrocyte-to-neuron conversion in the ischemic striatum. (a) Illustration of the construction of the endogenous Pax6 mRNA and the exogenous Pax6 mRNA (Lv- Pax6 ). (b) Expression levels of PAX6 protein in cultured astrocytes 7 days after Lv- Pax6 or Lv-mCherry transfection, in combination with 365-ago treatment, were analyzed by WB. (c) Illustration of animal experimental protocol. (d) Schematic of the brain showing the injection position of the mixture of Lv-GFAP-EGFP and Lv- Pax6 or Lv-mCherry (ipsilateral striatum) and miRNA (contralateral ventricle) and the areas of immunoreactive cells counting (five fields of view). (e) Representative images of immunofluorescent double labeling of GFP and NeuN in the brain sections of rats 14 days after MCAO. The white double arrowheads indicate GFP + /NeuN + cells. Scale bars: 50 mum. (f) The number of GFP + /NeuN + cell was counted as the percentage of the total number of GFP + cells in the five fields of view ( n = 6). *** p < .001 by unpaired two-tailed Student's t test. The data are presented as the means +- SEM [Color figure can be viewed at http://wileyonlinelibrary.com ]
- Submitted by
- Invitrogen Antibodies (provider)
- Main image
- Experimental details
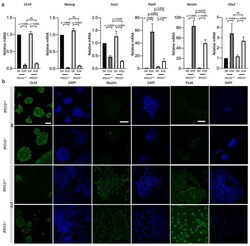
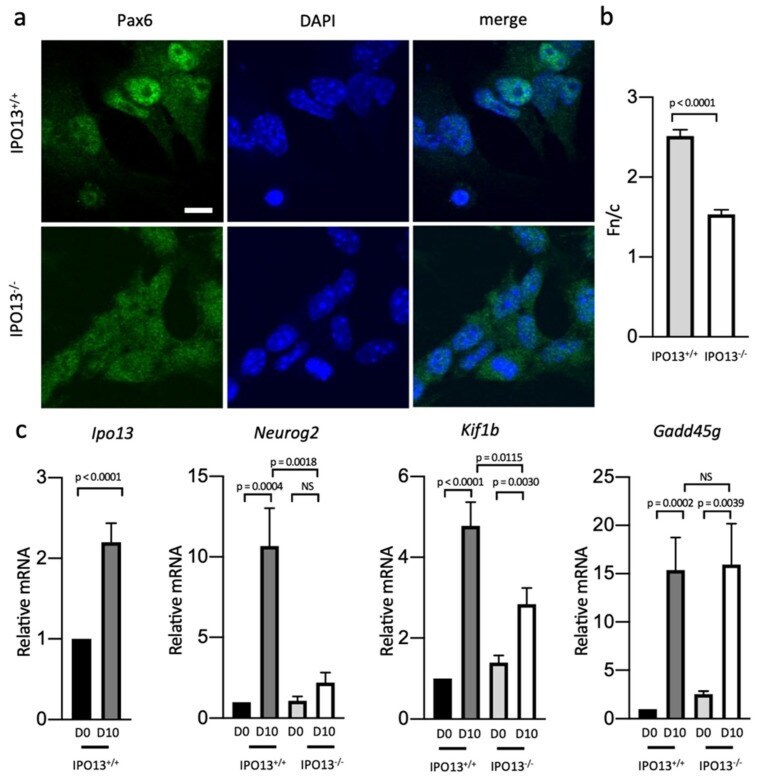
- Expressions of neural progenitor markers Pax6 and Nestin were reduced in differentiated IPO13 - / - cells. IPO13 +/+ and IPO13 - / - mESCs were induced to differentiate as in Figure 1 . ( a ) RNA was extracted from IPO13 +/+ and IPO13 - / - mESC at differentiations D0 and D10. Transcript levels were assessed using SensiMix SYBR Green. Results for gene expression were normalised to the expression of housekeeping genes Sdha , Tbp , and 18s . Data were relativised to IPO13 +/+ D0 expression values. Results represent the mean +- SEM ( n = 7, where each cDNA sample was analysed in duplicate). p values as per Figure 1 d. ( b ). Representative images of Oct4, Nestin, and Pax6 immunostaining from differentiation D0 and D10 in IPO13 +/+ and IPO13 - / - cells. Scale bars (10 mum) are displayed on the top left image and applied to every two columns.

- Submitted by
- Invitrogen Antibodies (provider)
- Main image

- Experimental details
- Decreased Pax6 nuclear accumulation in D10 IPO13 - / - cells results in reduced Pax6 transcriptional activity. ( a ). Representative images of Pax6 immunostaining at D10 in IPO13 +/+ and IPO13 - / - cells. Scale bar = 10 mum. ( b ). Quantitative analysis of Pax6 localisation was carried out using the ImageJ software on images, such as those in ( a ) to determine the nuclear to cytoplasmic ratio (Fn/c). Data represent the mean +- SEM for the nuclear (Fn) and cytoplasmic fluorescence (Fc) above background fluorescence. p values as per Figure 1 d ( c ). RNA was extracted from IPO13 +/+ and IPO13 - / - mESC at D0 and D10. Transcript levels were assessed using the SensiMix SYBR Green. Results for gene expression were normalised to the expression of housekeeping genes Sdha , Tbp , and 18s . Data were relativised to the IPO13 +/+ D0 expression values. Results represent the mean +- SEM ( n = 7, where each cDNA sample was measured in duplicate). p values are as per Figure 1 d.
- Submitted by
- Invitrogen Antibodies (provider)
- Main image
- Experimental details
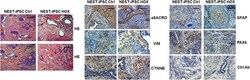
- Figure 3 Pluripotency Analysis In Vivo: Teratoma Formation of Implanted NEST-iPSCs Immature teratomas derived from control and HOX -transduced NEST-iPSCs were explanted 4-6 weeks after subcutaneous cell injection and further subjected to immunohistochemistry. H&E staining was performed to visualize the different cellular structures. The presence of derivatives of all three germ layers was further confirmed using specific antibodies to alpha-sarcomeric actin (aSACRO) and vimentin (VIM) (mesoderm), beta-catenin (CTNNB) (endoderm), glial fibrillary acidic protein (GFAP), and PAX6 (ectoderm) in combination with 3,3'-diaminobenzidine (DAB) staining. Isotype controls (Ctrl Ab) were used as staining controls. Representative photographs for n = 3 different experiments are shown (n = 8-10 mice per group). Magnification, 40x (H&E) and 100x (DAB). Scale bars, 200 mum (H&E) and 100 mum (DAB).
