Explore
 Validate
 Learn
Learn Western blot
Antibody data
- Antibody Data
- Antigen structure
- References [5]
- Comments [0]
- Validations
- Western blot [3]
- Immunocytochemistry [2]
- Immunohistochemistry [2]
- Flow cytometry [1]
- Other assay [7]
Submit
Validation data
Reference
Comment
Report error
- Product number
- MA1-109 - Provider product page

- Provider
- Invitrogen Antibodies
- Product name
- PAX6 Monoclonal Antibody (13B10-1A10)
- Antibody type
- Monoclonal
- Antigen
- Purifed from natural sources
- Description
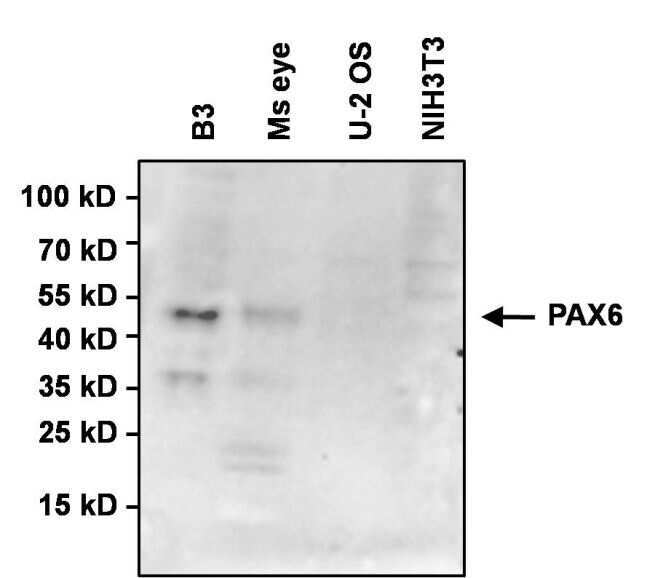
- Western blot analysis of MA1-109 detects an ~47 kDa protein in whole cell lysates from early passage human B3 lens epithelial cells and in mouse eye lysate. An additional unknown band at ~36 kDa is also detected in B3 cell lysates. This antibody will detect additional nonspecific bands in lysates with very low basal PAX6 expression. Specificity of the antibody was confirmed in B3 and mouse eye lysates (positive controls) compared to U-2 OS human osteosarcoma and NIH/3T3 mouse embryonic fibroblasts (negative controls). MA1-109- can be used for immunofluoresence and flow cytometry analysis of Pax6 in human neural stem cells.
- Reactivity
- Human, Mouse
- Host
- Mouse
- Isotype
- IgG
- Antibody clone number
- 13B10-1A10
- Vial size
- 100 µg
- Concentration
- 1 mg/mL
- Storage
- -20°C
Submitted references miR-137 and miR-122, two outer subventricular zone non-coding RNAs, regulate basal progenitor expansion and neuronal differentiation.
3D Interfacial and Spatiotemporal Regulation of Human Neuroepithelial Organoids.
Glycoproteomic analysis of the changes in protein N-glycosylation during neuronal differentiation in human-induced pluripotent stem cells and derived neuronal cells.
Modelling Toxoplasma gondii infection in human cerebral organoids.
Effect of Ionizing Radiation from Computed Tomography on Differentiation of Human Embryonic Stem Cells into Neural Precursors.
Tomasello U, Klingler E, Niquille M, Mule N, Santinha AJ, de Vevey L, Prados J, Platt RJ, Borrell V, Jabaudon D, Dayer A
Cell reports 2022 Feb 15;38(7):110381
Cell reports 2022 Feb 15;38(7):110381
3D Interfacial and Spatiotemporal Regulation of Human Neuroepithelial Organoids.
Tang C, Wang X, D'Urso M, van der Putten C, Kurniawan NA
Advanced science (Weinheim, Baden-Wurttemberg, Germany) 2022 Aug;9(22):e2201106
Advanced science (Weinheim, Baden-Wurttemberg, Germany) 2022 Aug;9(22):e2201106
Glycoproteomic analysis of the changes in protein N-glycosylation during neuronal differentiation in human-induced pluripotent stem cells and derived neuronal cells.
Kimura K, Koizumi T, Urasawa T, Ohta Y, Takakura D, Kawasaki N
Scientific reports 2021 May 27;11(1):11169
Scientific reports 2021 May 27;11(1):11169
Modelling Toxoplasma gondii infection in human cerebral organoids.
Seo HH, Han HW, Lee SE, Hong SH, Cho SH, Kim SC, Koo SK, Kim JH
Emerging microbes & infections 2020 Dec;9(1):1943-1954
Emerging microbes & infections 2020 Dec;9(1):1943-1954
Effect of Ionizing Radiation from Computed Tomography on Differentiation of Human Embryonic Stem Cells into Neural Precursors.
Hanu C, Loeliger BW, Panyutin IV, Maass-Moreno R, Wakim P, Pritchard WF, Neumann RD, Panyutin IG
International journal of molecular sciences 2019 Aug 10;20(16)
International journal of molecular sciences 2019 Aug 10;20(16)
No comments: Submit comment
Supportive validation
- Submitted by
- Invitrogen Antibodies (provider)
- Main image

- Experimental details
- Western blot analysis of PAX6 was performed by loading 40 µg of the indicated whole cell lysates per well, and 10 µL of PageRuler Plus Prestained Protein Ladder (Product # 26619) onto a 4-20% Tris-HCl polyacrylamide gel. Proteins were transferred to a PVDF membrane using the G2 Fast Blotter (Product # 62288), and blocked with StartingBlock T20 (TBS) Blocking Buffer (Product # 37543) for 1 hour at room temperature. PAX6 was detected at ~47 kDa after probing with a PAX6 monoclonal antibody (Product # MA1-109) at a dilution of 1:1000 in StartingBlock T20 (TBS) Blocking Buffer (Product # 37543) overnight at 4C on a rocking platform, followed by an HRP-conjugated goat anti-mouse IgG secondary antibody (Product # 31430) at a dilution of 1:20,000 for 1 hour at room temperature. Chemiluminescent detection was performed using SuperSignal West Dura (Product # 34075). Images were acquired on a Thermo Scientific myECL Imager (Product # 62236).

- Submitted by
- Invitrogen Antibodies (provider)
- Main image

- Experimental details
- Western blot analysis of PAX6 was performed by loading 35 µg of the indicated lysates per well, and 10 µL of PageRuler Plus Prestained Protein Ladder (Product # 26619) onto a 4-20% Tris-HCl polyacrylamide gel. Proteins were transferred to a PVDF membrane using the G2 Fast Blotter (Product # 62288), and blocked with StartingBlock T20 (TBS) Blocking Buffer (Product # 37543) for 1 hour at room temperature. PAX6 was detected at ~47 kDa after probing with a PAX6 monoclonal antibody (Product # MA1-109) at a dilution of 1:1000 in StartingBlock T20 (TBS) Blocking Buffer (Product # 37543) overnight at 4C on a rocking platform, followed by an HRP-conjugated goat anti-mouse IgG secondary antibody (Product # 31430) at a dilution of 1:20,000 for 1 hour at room temperature. Chemiluminescent detection was performed using SuperSignal West Dura (Product # 34075). Images were acquired on a Thermo Scientific myECL Imager (Product # 62236).
- Submitted by
- Invitrogen Antibodies (provider)
- Main image

- Experimental details
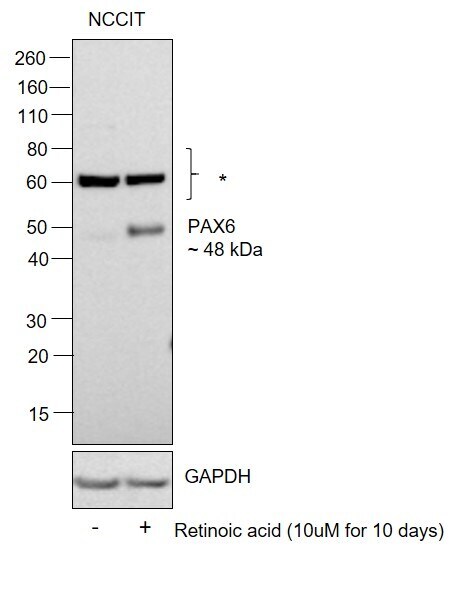
- Western blot was performed using Anti-PAX6 Monoclonal Antibody (13B10-1A10) (Product # MA1-109) and a 48 kDa band corresponding to PAX6 was observed in NCCIT cells on differentiation with retinoic acid. An additional uncharacterized band around 60 kDa (*) was observed in both lanes. Nuclear enriched extracts (30 µg lysate) of NCCIT (Lane 1) and NCCIT cells differentiated using retinoic acid treatment (10 µM for 10days) (Lane 2) were electrophoresed using NuPAGE™ 4-12% Bis-Tris Protein Gel (Product # NP0322BOX). Resolved proteins were then transferred onto a nitrocellulose membrane (Product # IB23001) by iBlot® 2 Dry Blotting System (Product # IB21001). The blot was probed with the primary antibody (1:1000 dilution) and detected by chemiluminescence with Goat anti-Mouse IgG (H+L) Superclonal™ Recombinant Secondary Antibody, HRP (Product # A28177,1:20,000 dilution) using the iBright FL 1000 (Product # A32752). Chemiluminescent detection was performed using SuperSignal™ West Pico PLUS Chemiluminescent Substrate (Product # 34580).
Supportive validation
- Submitted by
- Invitrogen Antibodies (provider)
- Main image
- Experimental details
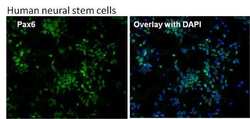
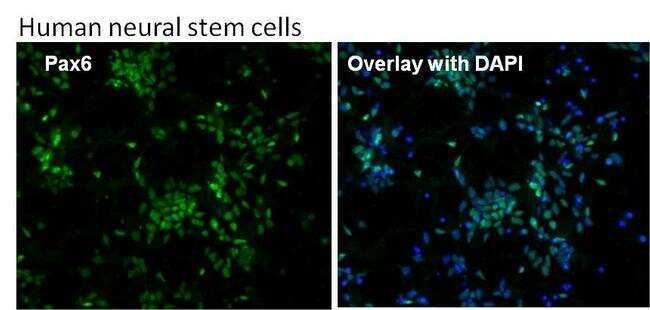
- Immunofluorescent analysis of Pax6 (green) in human neural stem cells derived from PD-3 iPSCs using Gibco® PSC Neural Induction Medium (Product # A1647801). The cells were fixed and permeabilized using Image-IT® Fixation/Permeabilization kit (Product # R37602), and blocked with the including blocking buffer for one hour at room temperature. Cells were stained with a Pax6 monoclonal antibody (Product # MA1-109) at a dilution of 1:200 in blocking buffer for 3 hours at room temperature, and then incubated with a DyLight488-conjugated goat anti-mouse IgG secondary antibody (Product # 35502) at a dilution of 1:250 for 1 hour at room temperature. Nuclear DNA (blue) was stained with DAPI (Product # D1306). Images were taken on an EVOS® FLoid® Cell Imaging Station at 10X magnification.
- Submitted by
- Invitrogen Antibodies (provider)
- Main image
- Experimental details
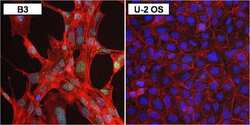
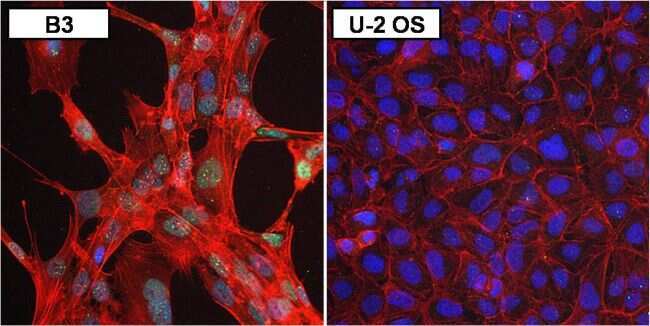
- Immunofluorescent analysis of PAX6 (green) in human B3 lens epithelial cells (left panel) and negative control U-2 OS cells (right panel). The cells were fixed with formaldehyde for 15 minutes, permeabilized with 0.1% Triton X-100 in TBS for 10 minutes, and blocked with 1% Blocker BSA in PBS (Product # 37525) for 15 minutes, all at room temperature. Cells were stained with a PAX6 monoclonal antibody (Product # MA1-109) in 1% Blocker BSA in PBS (Product # 37525) at a dilution of 1:100 for 1 hour at room temperature, and then incubated with a DyLight 488-conjugated goat anti-mouse IgG secondary antibody (Product # 35502) at a dilution of 1:250 for 30 minutes at room temperature. F-Actin (red) was stained with DyLight-554 Phalloidin (Product # 21834) and nuclei (blue) were stained with Hoechst 33342 dye (Product # 62249). Images were taken on a Thermo Scientific ToxInsight Instrument at 20X magnification.
Supportive validation
- Submitted by
- Invitrogen Antibodies (provider)
- Main image

- Experimental details
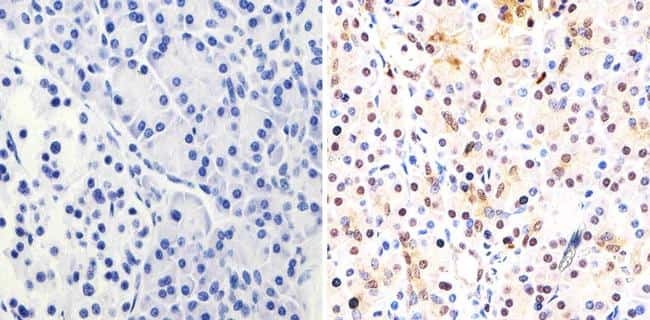
- Immunohistochemistry analysis of PAX6 showing staining in the nucleus of paraffin-embedded human pancreas tissue (right) compared to a negative control without primary antibody (left). To expose target proteins, antigen retrieval was performed using 10mM sodium citrate (pH 6.0), microwaved for 8-15 min. Following antigen retrieval, tissues were blocked in 3% H2O2-methanol for 15 min at room temperature, washed with ddH2O and PBS, and then probed with a PAX6 monoclonal antibody (Product # MA1-109) diluted in 3% BSA-PBS at a dilution of 1:100 overnight at 4ºC in a humidified chamber. Tissues were washed extensively in PBST and detection was performed using an HRP-conjugated secondary antibody followed by colorimetric detection using a DAB kit. Tissues were counterstained with hematoxylin and dehydrated with ethanol and xylene to prep for mounting.
- Submitted by
- Invitrogen Antibodies (provider)
- Main image

- Experimental details
- Immunofluorescent analysis of PAX6 in human iPSC-derived forebrain organoids derived at Day 40. The organoids were fixed with 4% PFA for 1 hour at room temperature, followed by incubation with 30% sucrose solution overnight at 4°C. The organoids were then embedded in OCT and cryosectioned at 5 µm, permeabilized with 0.2% Triton X-100 for 20 min, and blocked with 10% donkey serum in PBS for 30 min at room temperature. Organoid slices were stained with a Mouse PAX6 monoclonal antibody (green; Product # MA1-109) at a dilution of 1:500 in blocking buffer overnight at 4°C, and then incubated with Donkey anti-Mouse Alexa Fluor 488 (Product # R37114) in blocking solution at room temperature for 1 hour. Images were taken at 20X magnification. Scale bar: 50 µm. Data courtesy of Dr. Zhexing Wen at Emory University.

Supportive validation
- Submitted by
- Invitrogen Antibodies (provider)
- Main image
- Experimental details
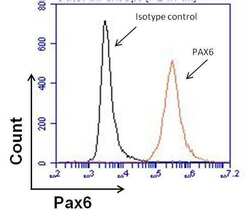
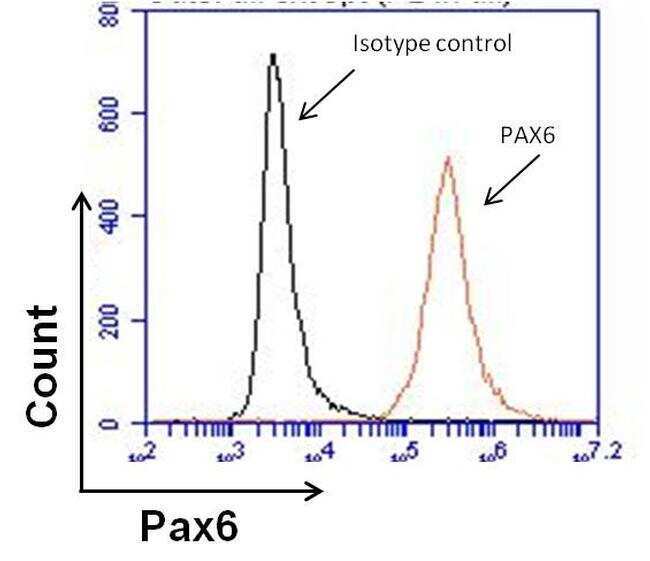
- Flow cytometry analysis of Pax6 in human neural stem cells derived from PD-3 iPSCs using Gibco® PSC Neural Induction Medium (Product # A1647801). Cells were fixed, permeabilized, and then stained with a Pax6 monoclonal antibody (Product # MA1-109) at 1:100 dilution or mouse IgG1 isotype control (black histogram) in 5% BSA. After incubation of the primary antibody for 1 hour on ice, the cells were stained with a DyLight 488-conjugated goat anti-mouse IgG secondary antibody (Product # 35502) at a dilution of 1:500 for 1 hour on ice. A representative 10,000 cells were acquired for each sample.
Supportive validation
- Submitted by
- Invitrogen Antibodies (provider)
- Main image
- Experimental details
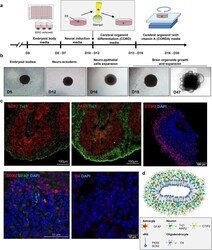
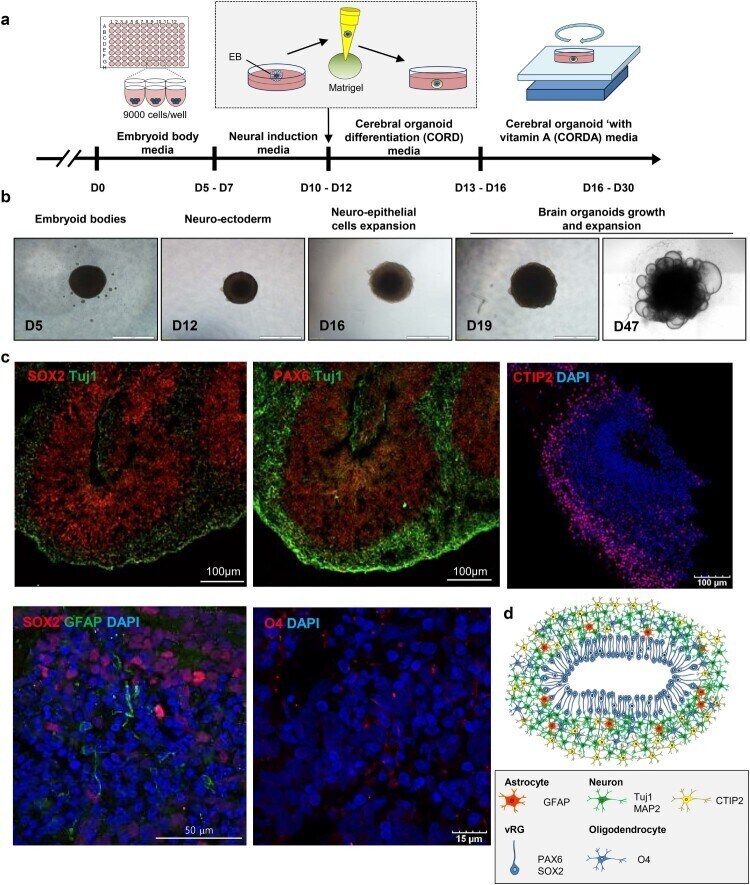
- Figure 1. Generation of cerebral brain organoids. (A) Schematic showing the method for generating hESC-derived brain organoids. (B) Representative images of a developing cerebral organoid at specific time points. (C) Immunohistochemistry of markers for the detection of neurons (SOX2 and TUJ1), radial glial cells (PAX6), astrocytes (GFAP) and oligodendrocytes (O1 and O4). Scale bars, as indicated. (D) Schematic representation of cerebral organoids generated in this study.
- Submitted by
- Invitrogen Antibodies (provider)
- Main image
- Experimental details
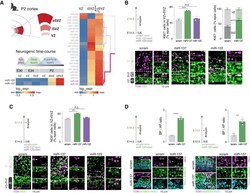
- Figure 1 OSVZ-expressed miR-137, but not miR-122, affects cortical progenitor proliferation (A) Microarray of the ferret ventricular zone (VZ), inner SVZ (iSVZ), and outer SVZ (oSVZ) during cortex development. Data are from and for post-natal day 2 (P2) and embryonic day 30 (E30)/E34/P2, respectively. Top left: schematic of microdissections of the P2 cortex performed for collection of P2 VZ, iSVZ, and oSVZ. Right: expression of miRNAs in the three germinal zones on P2. miR-122 and miR-137 cluster together as most expressed in the oSVZ. Bottom left: expression of miR-137 and miR-122 in the VZ and SVZ along development. (B) Progenitors in the VZ and SVZ at E16.5 upon miR-137 or miR-122 overexpression in the E14.5 mouse cortex. Top left: experimental design. Top right: quantification of KI67 + electroporated cells in the VZ and SVZ (scram, miR-137, and miR-122; n = 3 each). Bottom: representative micrographs of KI67 + electroporated cells. Electroporated cells positive (filled arrowheads) and negative (empty arrowheads) for KI67 are highlighted. (C) Neurogenic output on E17.5 upon miR-137 or miR-122 overexpression in the E14.5 mouse cortex. Top left: experimental design. Top right: quantification of NeuroD2 (ND2) + electroporated cells in the VZ and SVZ (scram, miR-137, and miR-122; n = 3 each). Bottom: representative micrographs of electroporated cells labeled for ND2. Electroporated cells positive (filled arrowheads) and negative (empty arrowheads) for ND2 are highlighted. (D)

- Submitted by
- Invitrogen Antibodies (provider)
- Main image

- Experimental details
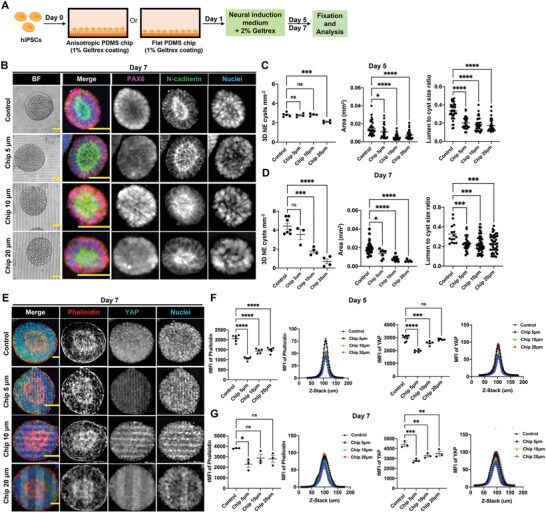
- Anisotropic substrate topographies affect NE cyst formation. A) Schematic of growing hiPSC on PDMS chips with linear grooves and control flat PDMS chip to generate NE cysts. B) NE cysts growing on PDMS chip with linear grooves of different dimensions (Chip 5 um, Chip 10 um, Chip 20 um) and control PDMS chip with flat surface. Bright-field images and immunofluorescence staining of N-cadherin and PAX6 in NE cysts on day 7. Scale bars: 50 um. C,D) Quantification of number density, area, and lumen-to-cyst size ratio of NE cysts on (C) day 5 and (D) day 7, n >= 3. E) Immunofluorescence staining of F-actin (phalloidin) and YAP in NE cysts growing on PDMS chip with linear grooves of different dimensions (Chip 5 um, Chip 10 um, Chip 20 um) and control PDMS chip with flat surface on day 7. Scale bars: 20 um. F,G) Quantification of F-actin (phalloidin) and YAP intensity in NE cysts on (F) day 5 and (G) day 7, n >= 3. Total mean fluorescence intensity (tMFI) of F-actin (phalloidin) and YAP were shown as dot plots and the corresponding MFI of each slide along the Z-stack were indicated as curve graphs. Error bars in (C), (D), (F), and (G) represent S.E.M. P -values of statistical significance were represented as: * P < 0.05, ** P < 0.01, *** P < 0.001, **** P < 0.0001, using one-way analysis of variance (ANOVA) followed by Dunnett multiple comparisons test.
- Submitted by
- Invitrogen Antibodies (provider)
- Main image

- Experimental details
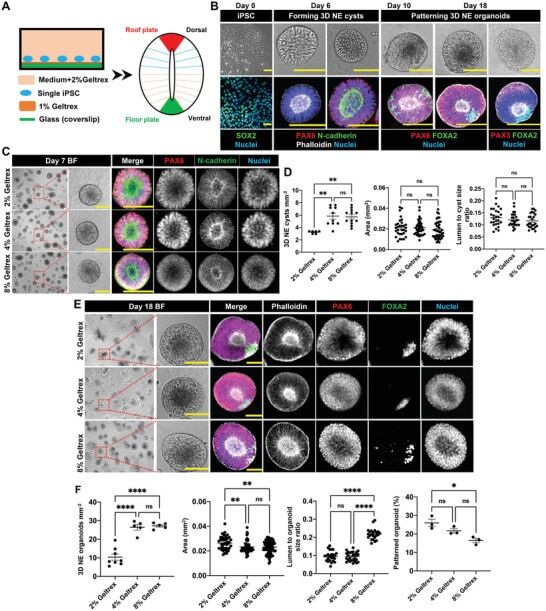
- Formation of 3D NE organoids from human iPSCs. A) Culture system for generating 3D DV patterned NE organoids from single hiPSCs. B) Developmental phases during the formation of NE organoids from single hiPSCs. Phase 1, hiPSCs were digested into single cells and seeded on Geltrex-coated glass coverslip on day 0. Phase 2, hiPSCs differentiated into NE cells and self-organized into cystic structures with smooth outer surface and containing central lumen with apical-basal polarity on day 6. Phase 3, development of NE cysts with FOXA2 + ventral NE cells and PAX3 + dorsal NE cells, forming DV patterned NE organoids. Top panels show bright-field images of hiPSCs, NE cysts, and NE organoids. Bottom panels show immunofluorescence staining of pluripotency marker SOX2, F-actin (phalloidin), N-cadherin, early neuroectodermal marker PAX6, dorsal marker PAX3, and ventral marker FOXA2 in corresponding phases during NE organoid formation. Scale bars: 100 um. C) Representative bright-field (BF) images of NE cysts on day 7 and the corresponding immunofluorescence staining of PAX6, N-cadherin, and nuclei in NE cysts formed in the presence of 2%, 4%, and 8% Geltrex in the neural induction medium. Scale bars: 100 um. D) Quantification of the number density, area, and lumen-to-cyst size ratio of NE cysts on day 7, n >= 5. E) Representative bright-field (BF) images (scale bars: 100 um) and the corresponding immunofluorescence staining (scale bars: 50 um) of F-actin (phalloidin), PAX6, FOXA2, and nu
- Submitted by
- Invitrogen Antibodies (provider)
- Main image

- Experimental details
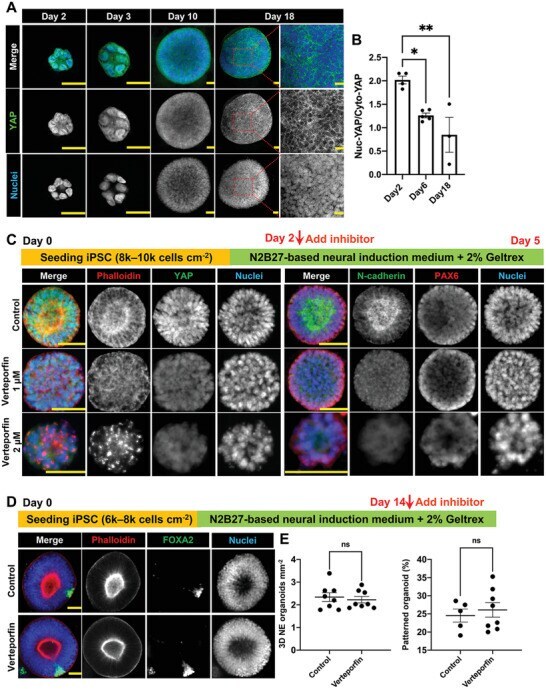
- The dynamic role of YAP in the NE cyst formation and NE organoid patterning. A) Immunofluorescence staining of YAP in NE organoids from day 2 to day 18 during NE organoid formation. Scale bars: 25 um. B) Quantification of nuclear-to-cytoplasmic YAP intensity ratio on day 2, day 6, and day 18, n >= 3. C) Immunofluorescence staining of F-actin (phalloidin), YAP, N-cadherin, and PAX6 in NE cysts on day 5. Verteporfin (0, 1, or 2 x 10 -6 m ) was added from day 2 to day 5 during NE cyst culture. Scale bars: 50 um. D) Immunofluorescence staining of F-actin (phalloidin) and FOXA2 in NE organoids on day 18. Verteporfin (1 x 10 -6 m ) was added from day 14 to day 18 during 3D NE organoid culture. Scale bars: 50 um. E) Quantification of number density of NE organoids and the percentage of floor plate patterned NE organoids on day 18 under different treatments, n >= 5. Error bars in (B) and (E) represent S.E.M. P -values of statistical significance were represented as: * P < 0.05, ** P < 0.01, ns (not significant) P > 0.05, using one-way analysis of variance (ANOVA) followed by Dunnett multiple comparisons test (B) and Student's t -test (E).
- Submitted by
- Invitrogen Antibodies (provider)
- Main image

- Experimental details
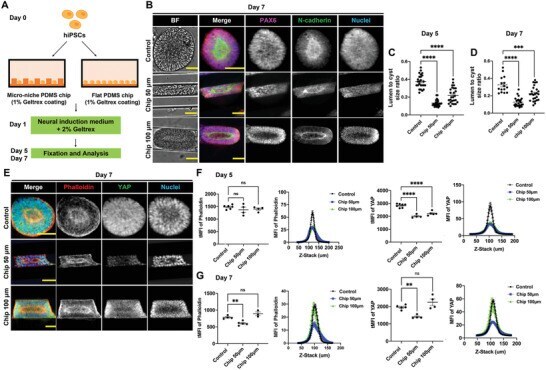
- Figure 6 3D microniches guide NE cyst formation. A) Schematic of growing hiPSC on PDMS chips with linear grooves microniche and control flat PDMS chip to generate NE cysts. B) NE cysts growing on PDMS chip with linear grooves microniche of either 50 um (Chip 50 um) and 100 um (Chip 100 um) in width or 90 um in height. Flat PDMS chip was used as control. Bright-field images and immunofluorescence staining of N-cadherin and PAX6 in NE cysts on day 7. Scale bars: 50 um. C,D) Quantification lumen-to-cyst size ratio of NE cysts on (C) day 5 and (D) day 7, n >= 15. E) Immunofluorescence staining of F-actin (phalloidin) and YAP in NE cysts growing on PDMS chip with linear grooves microniche of different dimensions (Chip 50 um, Chip 100 um) and control PDMS chip with flat surface on day 7. Scale bars: 50 um. F,G) Quantification of F-actin (phalloidin) and YAP intensity in NE cysts on (F) day 5 and (G) day 7, n >= 4. Total mean fluorescence intensity (MFI) of F-actin (phalloidin) and YAP were shown as dot plots (left) and the corresponding MFI of each slide along the Z-stack were indicated as curve graphs (right). Error bars in (C), (D), (F), and (G) represent S.E.M. P -values of statistical significance were represented as: * P < 0.05, ** P < 0.01, *** P < 0.001, **** P < 0.0001, using one-way analysis of variance (ANOVA) followed by Dunnett multiple comparisons test.
- Submitted by
- Invitrogen Antibodies (provider)
- Main image
- Experimental details
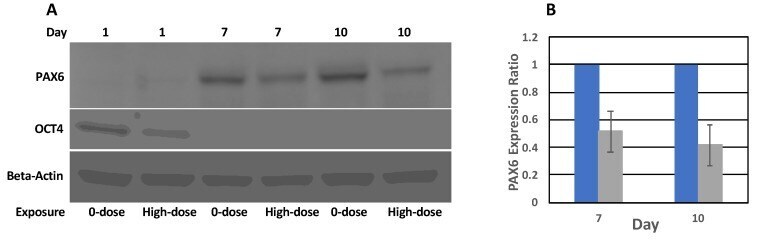
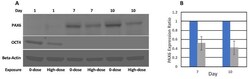
- Figure 6 PAX6 and OCT4 protein expression. ( A ) Western blot analysis of PAX6, OCT4, and beta-actin protein expression in 0-dose and high-dose samples. Images of the same membrane probed by different antibodies are presented. ( B ) Quantitation of Western blot data of PAX6 expression on Days 7 and 10 in high-dose (grey) samples relative to 0-dose (blue) samples. Error bars show standard deviations of three Western blot experiments.