 Explore
 Validate
 Learn
Learn Western blot
Antibody data
- Antibody Data
- Antigen structure
- References [1]
- Comments [0]
- Validations
- Western blot [4]
- Immunohistochemistry [3]
- Other assay [3]
Submit
Validation data
Reference
Comment
Report error
- Product number
- PA5-28982 - Provider product page

- Provider
- Invitrogen Antibodies
- Product name
- SCAP Polyclonal Antibody
- Antibody type
- Polyclonal
- Antigen
- Recombinant protein fragment
- Description
- Recommended positive controls: HepG2, MCF-7. Predicted reactivity: Mouse (91%), Rat (95%), Pig (97%), Bovine (96%). Store product as a concentrated solution. Centrifuge briefly prior to opening the vial.
- Reactivity
- Human, Mouse
- Host
- Rabbit
- Isotype
- IgG
- Vial size
- 100 µL
- Concentration
- 1.43 mg/mL
- Storage
- Store at 4°C short term. For long term storage, store at -20°C, avoiding freeze/thaw cycles.
Submitted references Intracellular biosynthesis of lipids and cholesterol by Scap and Insig in mesenchymal cells regulates long bone growth and chondrocyte homeostasis.
Tsushima H, Tang YJ, Puviindran V, Hsu SC, Nadesan P, Yu C, Zhang H, Mirando AJ, Hilton MJ, Alman BA
Development (Cambridge, England) 2018 Jul 9;145(13)
Development (Cambridge, England) 2018 Jul 9;145(13)
No comments: Submit comment
Supportive validation
- Submitted by
- Invitrogen Antibodies (provider)
- Main image
- Experimental details
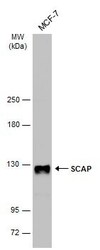
- Western blot analysis of SCAP was performed by separating 30 µg of whole cell extract by 5% SDS-PAGE. Proteins were transferred to a membrane and probed with a SCAP Polyclonal Antibody (Product # PA5-28982) at a dilution of 1:2000. The HRP-conjugated anti-rabbit IgG antibody was used to detect the primary antibody.
- Submitted by
- Invitrogen Antibodies (provider)
- Main image
- Experimental details
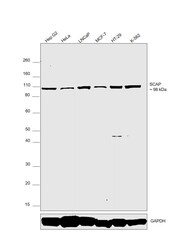
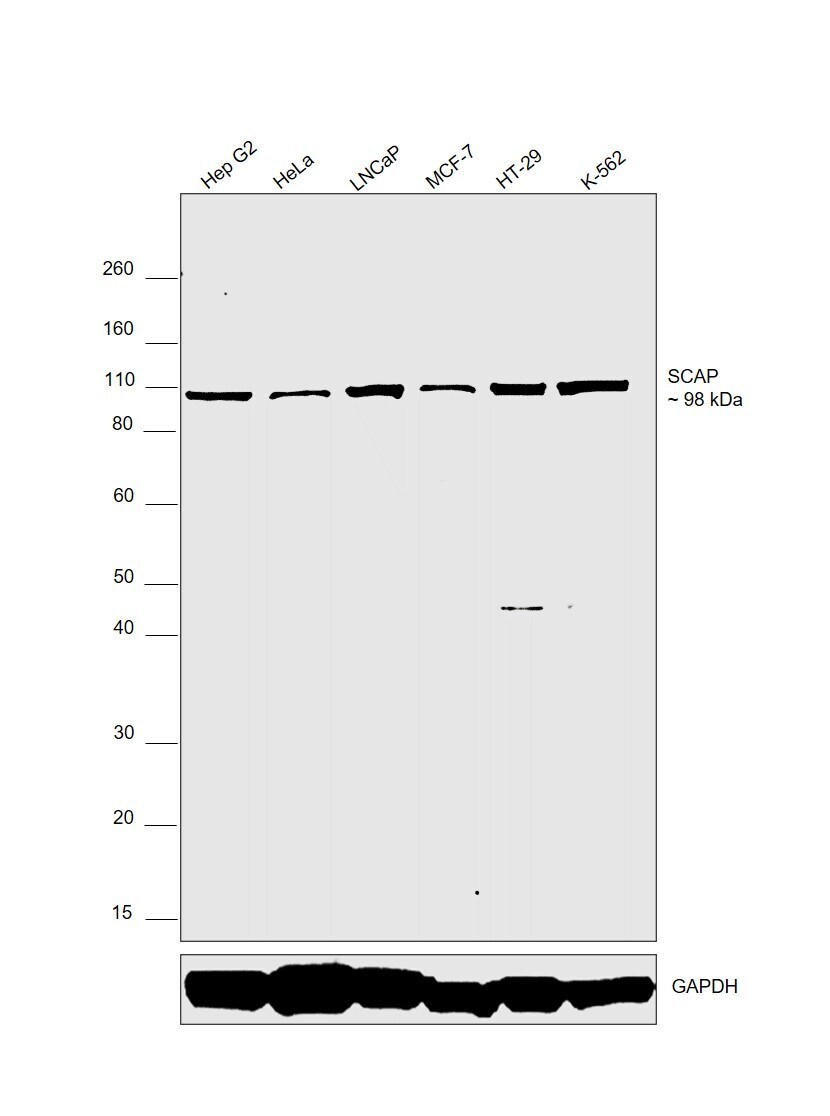
- Western blot was performed using Anti-SCAP Polyclonal Antibody (Product # PA5-28982) and a 98 kDa band corresponding to Sterol regulatory element-binding protein cleavage-activating protein was observed across cell lines. Whole cell extracts (40 µg lysate) of Hep G2 (Lane 1), HeLa (Lane 2), LNCaP (Lane 3), MCF7 (Lane 4), HT-29 (Lane 5) and K-562 (Lane 6) were electrophoresed using NuPAGE™ 4-12% Bis-Tris Protein Gel (Product # NP0321BOX). Resolved proteins were then transferred onto a nitrocellulose membrane (Product # LC2001) by iBlot® 2 Dry Blotting System (Product # IB21001). The blot was probed with the primary antibody (1:2000 dilution) and detected by chemiluminescence with Goat anti-Rabbit IgG (H+L) Superclonal™ Recombinant Secondary Antibody, HRP (Product # A27036,1:20000 dilution) using the iBright FL 1000 (Product # A32752). Chemiluminescent detection was performed using SuperSignal™ West Dura Extended Duration Substrate (Product # 34076).
- Submitted by
- Invitrogen Antibodies (provider)
- Main image
- Experimental details
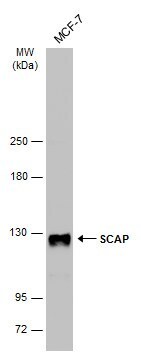
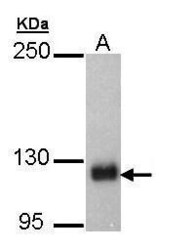
- Western Blot using SCAP Polyclonal Antibody (Product # PA5-28982). Sample (30 µg of whole cell lysate). A: HepG2.5% SDS PAGE. SCAP Polyclonal Antibody (Product # PA5-28982) diluted at 1:5,000. The HRP-conjugated anti-rabbit IgG antibody was used to detect the primary antibody.

- Submitted by
- Invitrogen Antibodies (provider)
- Main image
- Experimental details
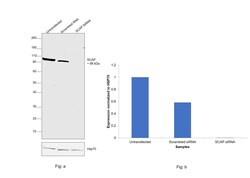
- Knockdown of Sterol regulatory element-binding protein cleavage-activating protein was achieved by transfecting HeLa with Sterol regulatory element-binding protein cleavage-activating protein specific siRNAs (Silencer® select Product # S695, S697). Western blot analysis (Fig. a) was performed using Whole cell extracts from the Sterol regulatory element-binding protein cleavage-activating protein knockdown cells (lane 3), non-targeting scrambled siRNA transfected cells (lane 2) and untransfected cells (lane 1). The blot was probed with SCAP Polyclonal Antibody (Product # PA5-28982, 1:2000 dilution) and Goat anti-Rabbit IgG (H+L) Superclonal™ Recombinant Secondary Antibody, HRP (Product # A27036, 1:20000 dilution). Densitometric analysis of this western blot is shown in histogram (Fig. b). Decrease in signal upon siRNA mediated knock down confirms that antibody is specific to Sterol regulatory element-binding protein cleavage-activating protein.

Supportive validation
- Submitted by
- Invitrogen Antibodies (provider)
- Main image

- Experimental details
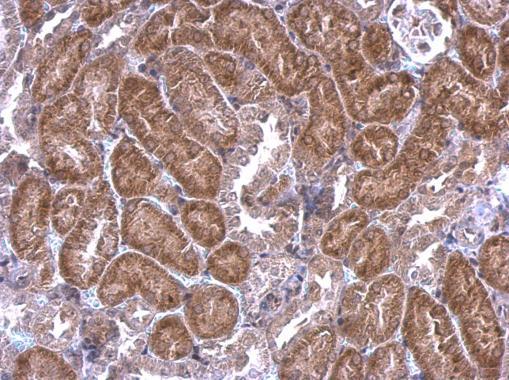
- SREBF chaperone protein antibody [C2C3], C-term detects SREBF chaperone protein protein at cytosol on mouse kidney by immunohistochemical analysis. Sample: Paraffin-embedded mouse kidney. SREBF chaperone protein antibody [C2C3], C-term (Product # PA5-28982) dilution: 1:500. Antigen Retrieval: EDTA based buffer, pH 8.0, 15 min.
- Submitted by
- Invitrogen Antibodies (provider)
- Main image

- Experimental details
- SREBF chaperone protein antibody [C2C3], C-term detects SREBF chaperone protein protein at cytosol on mouse kidney by immunohistochemical analysis. Sample: Paraffin-embedded mouse kidney. SREBF chaperone protein antibody [C2C3], C-term (Product # PA5-28982) dilution: 1:500. Antigen Retrieval: EDTA based buffer, pH 8.0, 15 min.
- Submitted by
- Invitrogen Antibodies (provider)
- Main image
- Experimental details
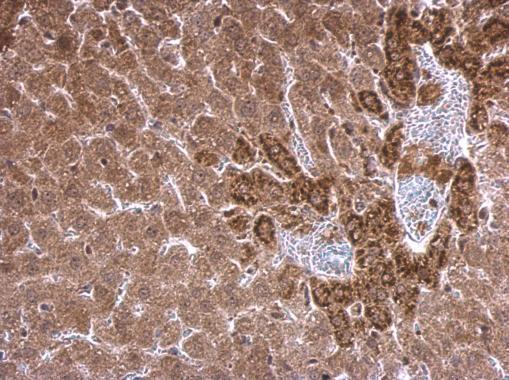
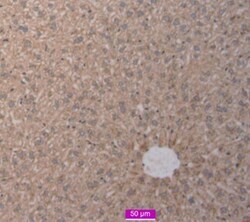
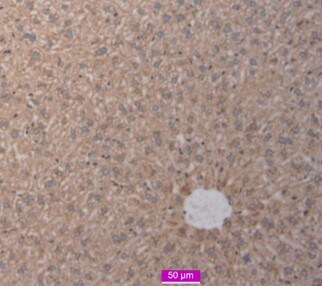
- Immunohistochemical analysis of SREBF chaperone protein in the cytosol of paraffin-embedded mouse liver using a SREBF chaperone protein polyclonal antibody (Product # PA5-28982) at a dilution of 1:600. Data Courtesy of Wei Xu’s laboratory at the University of Wisconsin Madison.
Supportive validation
- Submitted by
- Invitrogen Antibodies (provider)
- Main image

- Experimental details
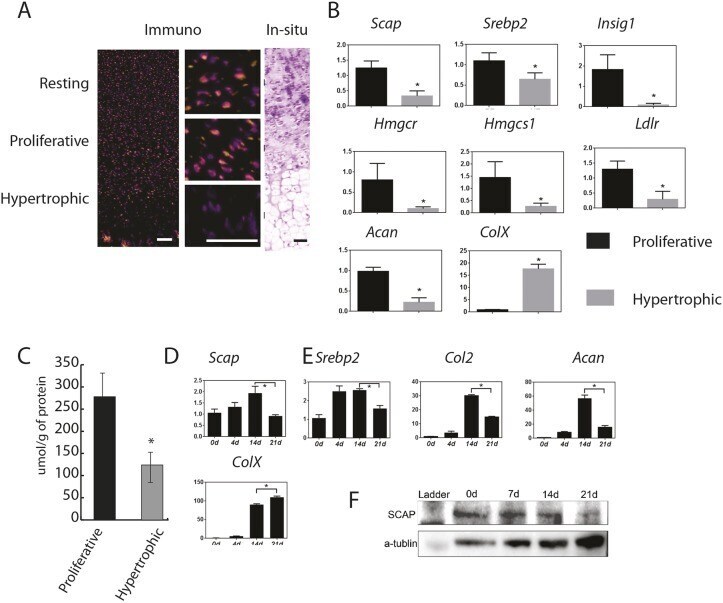
- Fig. 3. Scap expression and cholesterol levels are decreased in hypertrophic chondrocytes . (A) Immunofluorescent staining and in situ hybridization of E16.5 embryos showed that Scap protein was expressed in the round cell zone (resting) and proliferation zone, but was decreased in the hypertrophic zone. Left panel is immunofluorescent staining, middle panels are magnified views of the three zones and the right panels show in situ hybridization. Scale bars: 100 mum. (B) RT-PCR data from microdissected regions of the proliferating zone (PZ) and hypetrophic zone (HZ) of the growth plate showing differential regulation of Scap and other genes involved in intracellular biosynthesis of cholesterol and lipids (from E16.5 limbs, n =8 in each group). Black represents controls; gray represents cells from limbs lacking Scap . (C) Cholesterol levels in the proliferating zone (PZ) and hypetrophic zone (HZ) of the growth plate ( n =4). (D,E) Scap expression micromass cultures also showed that Scap expression was gradually decreased over time as cells progressed through chondrocytic differentiation. D shows RNA data ( n =8) and E a representative western blot. Means and 95% confidence intervals are shown (* P
- Submitted by
- Invitrogen Antibodies (provider)
- Main image
- Experimental details
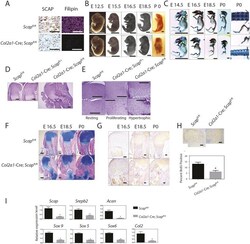
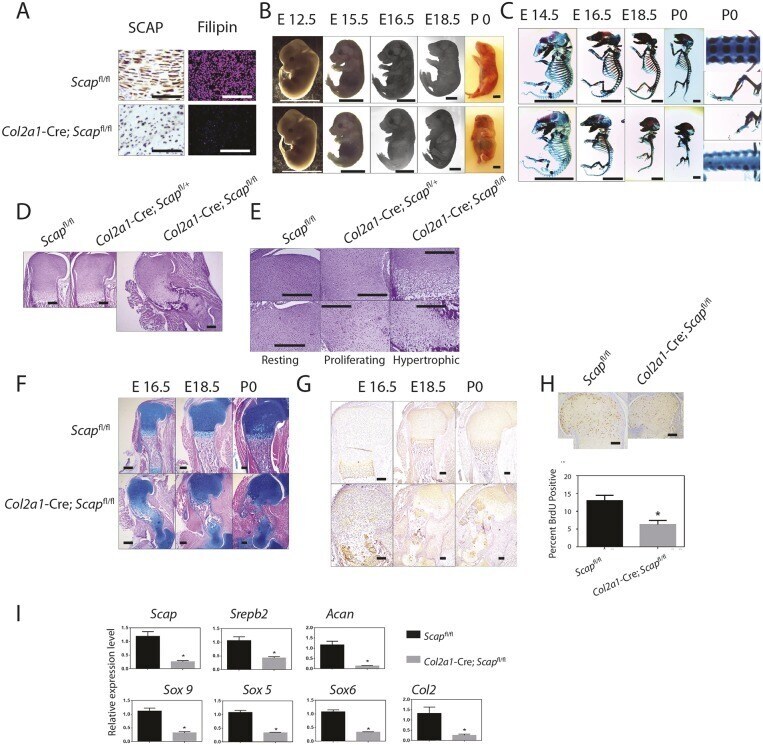
- Fig. 4. Loss of Scap in chondrocytes results in a disordered growth plate and severe dwarfism. (A) Immunohistochemistry for SCAP (left) and filipin fluorescent staining (right) for control limbs (top) and for limbs from mice lacking Scap in Col2a1 -expressing cells (bottom), confirming lack of SCAP expression and decreased intracellular cholesterol and lipids in mutant mice. (B,C) Whole-mount and skeletal preparations of representative E12.5 to P0 mice. Top rows show mice expressing Scap in Col2a1 -expressing cells; the bottom rows show mice lacking Scap in these cells ( n >5 for each genotype at each age). P0 images of the spine and limb show a lack of spinal cartilage development and severely shortened long bones. (D) Hematoxylin and Eosin staining of fetal limbs of E16.5 humerus sections with control limbs on the right, limbs from a mouse lacking Scap in one allele in the middle and limbs from a mouse lacking Scap in both alleles in Col2a1 -expressing cells on the left. (E) Magnified views of 16.5 humeri showing views of the resting, proliferating and hypertrophic zones. The mutant limb demonstrates ectopic hypertrophic cells. (F) Alcian Blue staining of the upper limb. (G) Type X collagen staining of the upper limb. (H) BrdU incorporation, with the limbs from mice lacking Scap . (I) Expression of various genes in the mutant and control limbs. Means and 95% confidence intervals are shown (* P
- Submitted by
- Invitrogen Antibodies (provider)
- Main image
- Experimental details
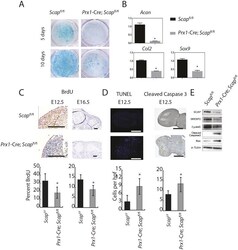
- Fig. 2. Scap regulates mesenchymal cell proliferation and differentiation. (A) Representative Alcian Blue staining from micromass cultures showing decreased glycosaminoglycan production in limbs from mice with inactivation of Scap in Prx1 -expressing cells ( n =5 mutant and 5 controls). (B) Relative RNA expression comparing micromass cultures lacking Scap in Prx1 -expressing cells with controls, showing decreased expression of markers of chondrogenesis at 10 days ( n =6 mutant and 6 controls). Means and 95% confidence intervals are shown. (C) BrdU uptake in limbs. Graphs of means and 95% confidence intervals are underneath, n =6 for each time point and condition. (D) Scap -deficient mice contained TUNEL-stained cells and cleaved caspase 3 in the central regions of the developing bone, whereas TUNEL-stained cells were restricted to the margins of digital rays ( n =6 for each genotype). Graphs of means and 95% confidence intervals are underneath, n =6 for each, P
