Explore
 Validate
 Learn
Learn Western blot
Antibody data
- Antibody Data
- Antigen structure
- References [1]
- Comments [0]
- Validations
- Western blot [2]
- Immunocytochemistry [2]
- Other assay [2]
Submit
Validation data
Reference
Comment
Report error
- Product number
- PA5-17409 - Provider product page

- Provider
- Invitrogen Antibodies
- Product name
- SCD Polyclonal Antibody
- Antibody type
- Polyclonal
- Antigen
- Synthetic peptide
- Description
- It is not recommended to aliquot this antibody.
- Reactivity
- Human, Mouse
- Host
- Rabbit
- Isotype
- IgG
- Vial size
- 100 µL
- Concentration
- 16 µg/mL
- Storage
- -20°C
Submitted references Neonatal hyperoxia inhibits proliferation and survival of atrial cardiomyocytes by suppressing fatty acid synthesis.
Cohen ED, Yee M, Porter GA Jr, Ritzer E, McDavid AN, Brookes PS, Pryhuber GS, O'Reilly MA
JCI insight 2021 Mar 8;6(5)
JCI insight 2021 Mar 8;6(5)
No comments: Submit comment
Supportive validation
- Submitted by
- Invitrogen Antibodies (provider)
- Main image

- Experimental details
- Western blot analysis of SCD1 in 3T3-L1 cell lysates using SCD1 polyclonal antibody (Product # PA5-17409).

- Submitted by
- Invitrogen Antibodies (provider)
- Main image

- Experimental details
- Western blot was performed using Anti-SCD Polyclonal Antibody (Product # PA5-17409) and a 37 kDa band corresponding to SCD was observed across all the cell lines tested except undifferentiated 3T3-L1. Whole cell extracts (30 µg lysate) of undifferentiated 3T3-L1 pre-adipocytes (Lane 1), 3T3-L1 differentiated to adipocytes (Lane 2) were electrophoresed using NuPAGE™ 4-12% Bis-Tris Protein Gel (Product # NP0322BOX). Resolved proteins were then transferred onto a nitrocellulose membrane (Product # IB23001) by iBlot® 2 Dry Blotting System (Product # IB21001). The blot was probed with the primary antibody (1:1000 dilution) and detected by chemiluminescence with Goat anti-Rabbit IgG (H+L) Superclonal™ Recombinant Secondary Antibody, HRP (Product # A27036, 1:4000 dilution) using the iBright FL 1000 (Product # A32752). Chemiluminescent detection was performed using Novex® ECL Chemiluminescent Substrate Reagent Kit (Product # WP20005).

Supportive validation
- Submitted by
- Invitrogen Antibodies (provider)
- Main image

- Experimental details
- Immunofluorescent analysis of SCD1 in 3T3-L1 cells using a SCD1 polyclonal antibody (Product # PA5-17409) (green) showing cytoplasmic localization in differentiated cells. DNA is labeled using a fluorescent blue dye.

- Submitted by
- Invitrogen Antibodies (provider)
- Main image

- Experimental details
- Immunofluorescence analysis of SCD was performed using 70% confluent log phase 3T3-L1 undifferentiated and 3T3-L1 differentiated to adipocytes. The cells were fixed with 4% Paraformaldehyde for 10 minutes, permeabilized with 0.1% Triton™ X-100 for 10 minutes, and blocked with 2% BSA for 1 hour at room temperature. The cells were labeled with SCD Polyclonal Antibody (Product # PA5-17409) at 1:100 dilution in 0.1% BSA, incubated at 4 degree celsius overnight and then labeled with Goat anti-Rabbit IgG (H+L) Superclonal™ Recombinant Secondary Antibody, Alexa Fluor® 488 (Product # A27034, 1:2000 dilution) for 45 minutes at room temperature (Panel a: Green). Nuclei (Panel b: Blue) were stained with SlowFade® Gold Antifade Mountant with DAPI (Product # S36938). F-actin (Panel c: Red) was stained with Rhodamine Phalloidin (Product # R415, 1:300). Panel d represents the merged image showing ER like cytoplasmic localization. Panel e represents undifferentiated 3T3L-1 cells having no expression of SCD. Panel f represents control cells with no primary antibody to assess background. The images were captured at 60X magnification.

Supportive validation
- Submitted by
- Invitrogen Antibodies (provider)
- Main image
- Experimental details
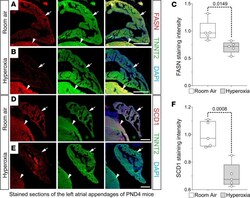
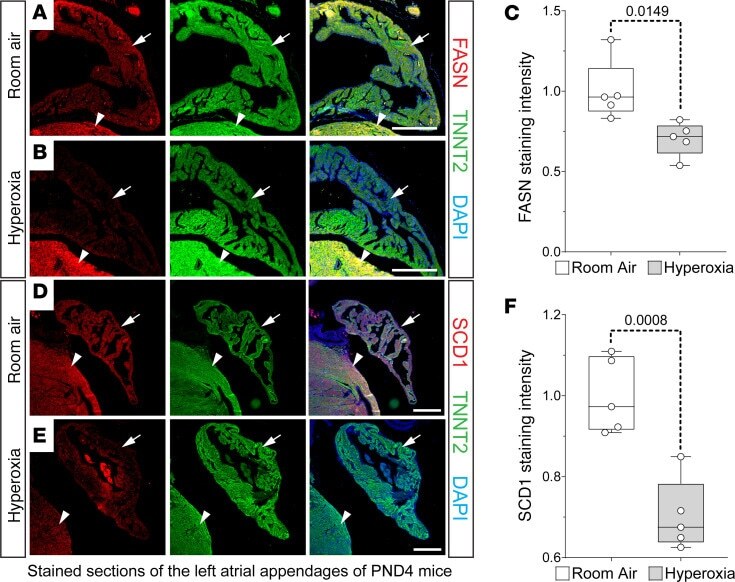
- Figure 5 Neonatal hyperoxia represses fatty acid synthesis enzymes in murine atrial cardiomyocytes. ( A , B , D , and E ). Sections of left atrial appendages from P4 neonates exposed to room air ( A and B ) or hyperoxia ( D and E ) costained for FASN (red, A and B ) or SCD1 (red, D and E ) and TNNT2 (green, A , B , D , and E ). Sections were also stained with DAPI to label nuclei (blue, A , B , D , and E ). Arrows and arrowheads show TNNT2 + cardiomyocytes in left atrial appendage and LV, respectively. Scale bars: 200 mum. ( C and F ) Graphs show relative staining intensities for Fasn ( C ) and Scd1 ( F ) measured using NIH ImageJ 2.0/Fiji. ( C and F ) Room air, n = 5; hyperoxia, n = 5. Box plots show median values and inner quartiles. Whiskers show the range of values. Circles show values for individual room air- and hyperoxia-exposed mice, respectively. F tests were used to determine if samples had equal or unequal variances. P values are the results of unpaired 2-tailed t tests.
- Submitted by
- Invitrogen Antibodies (provider)
- Main image

- Experimental details
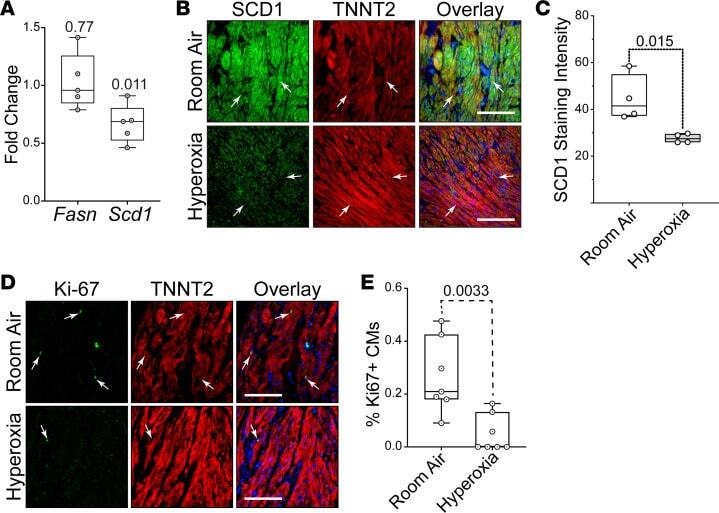
- Figure 8 Hyperoxia suppresses fatty acid synthesis genes in left atrial tissue explanted from human infants. ( A ) Results of qPCR for Fasn and Scd1 in left atrial tissue explanted from human infants who died at birth due to anencephaly and exposed to room air or hyperoxia for 24 hours. n = 5 donors. ( B ) Sectioned explants exposed to room air (top) or hyperoxia (bottom) were stained for SCD1 (green), TNNT2 (red), and DAPI (blue). ( C ) Graph shows staining intensities for SCD1 in sections of control and hyperoxia-exposed mice determined using NIH ImageJ 2.0/Fiji. n = 4 donors. ( D ) Sections of explants exposed to room air (top) and hyperoxia (bottom) stained for the proliferation marker Ki67 (green), TNNT2 (red), and DAPI (blue). ( E ) Graph shows percentages of TNNT2-expressing cells with Ki67 + nuclei in explants exposed to room air or hyperoxia. n = 7 donors. ( A , C , and E ) Circles indicate individual values for explants of each donor. Boxes show medians and inner quartiles; whiskers represent the range. P values are the results of either single-sample 1-tailed t test and Wilcox test ( A ) or unpaired 2-tailed t tests ( C and E ). ( B and D ) Scale bars = 100 mum.