 Explore
 Validate
 Learn
Learn Flow cytometry
Antibody data
- Antibody Data
- Antigen structure
- References [48]
- Comments [0]
- Validations
- Flow cytometry [1]
- Other assay [46]
Submit
Validation data
Reference
Comment
Report error
- Product number
- 12-0049-80 - Provider product page

- Provider
- Invitrogen Antibodies
- Product name
- CD4 Monoclonal Antibody (RPA-T4), PE, eBioscience™
- Antibody type
- Monoclonal
- Antigen
- Other
- Description
- Description: The RPA-T4 monoclonal antibody reacts with human CD4, a 59 kDa cell surface receptor expressed by a majority of thymocytes, subpopulation of mature T cells (T-helper cells) and in low levels on monocytes. CD4 is a receptor for the human immunodeficiency virus (HIV). RPA-T4 blocks HIV binding and mixed lymphocyte reaction. The RPA-T4 antibody recognizes a different epitope than the OKT4 monoclonal antibody, and these antibodies do not cross-block binding to each other's respective epitopes. Applications Reported: The RPA-T4 antibody has been reported for use in flow cytometric analysis. Applications Tested: The FITC conjugated RPA-T4 has been tested by flow cytometric analysis and can be used at less than or equal to 1 µg per test. A test is defined as the amount (µg) of antibody that will stain a cell sample in a final volume of 100 µL. Cell number should be determined empirically but can range from 10^5 to 10^8 cells/test. It is recommended that the antibody be carefully titrated for optimal performance in the assay of interest. Excitation: 488-561 nm; Emission: 578 nm; Laser: Blue Laser, Green Laser, Yellow-Green Laser. Filtration: 0.2 µm post-manufacturing filtered.
- Reactivity
- Human
- Host
- Mouse
- Conjugate
- Yellow dye
- Isotype
- IgG
- Antibody clone number
- RPA-T4
- Vial size
- 25 µg
- Concentration
- 0.2 mg/mL
- Storage
- 4° C, store in dark, DO NOT FREEZE!
Submitted references Rapamycin improves Graves' orbitopathy by suppressing CD4+ cytotoxic T lymphocytes.
Single-cell RNA sequencing reveals the molecular features of peripheral blood immune cells in children, adults and centenarians.
Decoding the pathogenesis of Diamond-Blackfan anemia using single-cell RNA-seq.
Single-cell profiling of healthy human kidney reveals features of sex-based transcriptional programs and tissue-specific immunity.
Bispecific T-Cell Engaging Antibodies Against MUC16 Demonstrate Efficacy Against Ovarian Cancer in Monotherapy and in Combination With PD-1 and VEGF Inhibition.
Characterization and modulation of anti-αβTCR antibodies and their respective binding sites at the βTCR chain to enrich engineered T cells.
Effects of the Antidiabetic Drugs Evogliptin and Sitagliptin on the Immune Function of CD26/DPP4 in Th1 Cells.
Murlentamab, a Low Fucosylated Anti-Müllerian Hormone Type II Receptor (AMHRII) Antibody, Exhibits Anti-Tumor Activity through Tumor-Associated Macrophage Reprogrammation and T Cell Activation.
Standardized 11-color flow cytometry panel for the functional phenotyping of human T regulatory cells.
HDAC Inhibitor, CG-745, Enhances the Anti-Cancer Effect of Anti-PD-1 Immune Checkpoint Inhibitor by Modulation of the Immune Microenvironment.
Identification of two HLA-A*0201 immunogenic epitopes of lactate dehydrogenase C (LDHC): potential novel targets for cancer immunotherapy.
Involvement of natural killer cells in the pathogenesis of endometriosis in patients with pelvic pain.
MicroRNA‑155 inhibits the proliferation of CD8+ T cells via upregulating regulatory T cells in vitiligo.
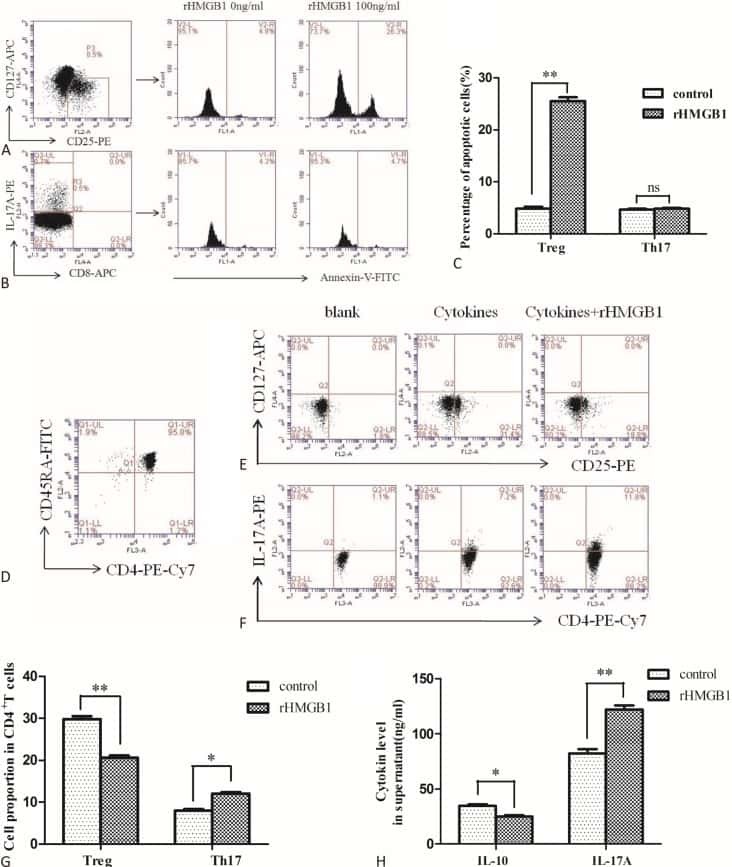
The Effects of High Mobility Group Box-1 Protein on Peripheral Treg/Th17 Balance in Patients with Atherosclerosis.
RAB11FIP5 Expression and Altered Natural Killer Cell Function Are Associated with Induction of HIV Broadly Neutralizing Antibody Responses.
Impact of Enhancer of Zeste Homolog 2 on T Helper Cell-Mediated Allergic Rhinitis.
Protein kinase CK2 controls T-cell polarization through dendritic cell activation in response to contact sensitizers.
CXCL13-producing TFH cells link immune suppression and adaptive memory in human breast cancer.
Non-neutralizing Antibodies Alter the Course of HIV-1 Infection In Vivo.
Blocking the recruitment of naive CD4(+) T cells reverses immunosuppression in breast cancer.
Lack of T Cell Response to iPSC-Derived Retinal Pigment Epithelial Cells from HLA Homozygous Donors.
Remarkably low affinity of CD4/peptide-major histocompatibility complex class II protein interactions.
An oncofetal antigen, IMP-3-derived long peptides induce immune responses of both helper T cells and CTLs.
Equilibrium of Treg/Th17 cells of peripheral blood in syphilitic patients with sero-resistance.
Interaction among activated lymphocytes and mesenchymal cells through podoplanin is critical for a high IL-17 secretion.
CD28 family of receptors on T cells in chronic HBV infection: Expression characteristics, clinical significance and correlations with PD-1 blockade.
New mouse model of acute adult T-cell leukemia generated by transplantation of AKT, BCLxL, and HBZ-transduced T cells.
Tuning of AKT-pathway by Nef and its blockade by protease inhibitors results in limited recovery in latently HIV infected T-cell line.
Investigating the causes for decreased levels of glutathione in individuals with type II diabetes.
dNP2 is a blood-brain barrier-permeable peptide enabling ctCTLA-4 protein delivery to ameliorate experimental autoimmune encephalomyelitis.
Liposomal Glutathione Supplementation Restores TH1 Cytokine Response to Mycobacterium tuberculosis Infection in HIV-Infected Individuals.
Distinct patterns of intratumoral immune cell infiltrates in patients with HPV-associated compared to non-virally induced head and neck squamous cell carcinoma.
RNAi-Mediated CCR5 Knockdown Provides HIV-1 Resistance to Memory T Cells in Humanized BLT Mice.
T helper cell subsets specific for Pseudomonas aeruginosa in healthy individuals and patients with cystic fibrosis.
M-CSF inhibits anti-HIV-1 activity of IL-32, but they enhance M2-like phenotypes of macrophages.
OMIP-022: Comprehensive assessment of antigen-specific human T-cell functionality and memory.
Immune response to JC virus T antigen in patients with and without colorectal neoplasia.
Comparison of human adipose-derived stem cells isolated from subcutaneous, omental, and intrathoracic adipose tissue depots for regenerative applications.
The lantibiotic peptide labyrinthopeptin A1 demonstrates broad anti-HIV and anti-HSV activity with potential for microbicidal applications.
Human regulatory T cells kill tumor cells through granzyme-dependent cytotoxicity upon retargeting with a bispecific antibody.
Gelsolin activity controls efficient early HIV-1 infection.
Increased frequencies of Th22 cells as well as Th17 cells in the peripheral blood of patients with ankylosing spondylitis and rheumatoid arthritis.
Upregulation of programmed death-1 on T cells and programmed death ligand-1 on monocytes in septic shock patients.
Forced expression of cyclin-dependent kinase 6 confers resistance of pro-B acute lymphocytic leukemia to Gleevec treatment.
Modulation of CD4+ T lymphocyte lineage outcomes with targeted, nanoparticle-mediated cytokine delivery.
Divergent expression patterns of IL-4 and IL-13 define unique functions in allergic immunity.
B cells and monocytes from patients with active multiple sclerosis exhibit increased surface expression of both HERV-H Env and HERV-W Env, accompanied by increased seroreactivity.
Sepsis-induced human lymphocyte apoptosis and cytokine production in "humanized" mice.
Zhang M, Chong KK, Chen ZY, Guo H, Liu YF, Kang YY, Li YJ, Shi TT, Lai KK, He MQ, Ye K, Kahaly GJ, Shi BY, Wang Y
JCI insight 2023 Feb 8;8(3)
JCI insight 2023 Feb 8;8(3)
Single-cell RNA sequencing reveals the molecular features of peripheral blood immune cells in children, adults and centenarians.
Zhong J, Ding R, Jiang H, Li L, Wan J, Feng X, Chen M, Peng L, Li X, Lin J, Yang H, Wang M, Li Q, Chen Q
Frontiers in immunology 2022;13:1081889
Frontiers in immunology 2022;13:1081889
Decoding the pathogenesis of Diamond-Blackfan anemia using single-cell RNA-seq.
Wang B, Wang C, Wan Y, Gao J, Ma Y, Zhang Y, Tong J, Zhang Y, Liu J, Chang L, Xu C, Shen B, Chen Y, Jiang E, Kurita R, Nakamura Y, Lim KC, Engel JD, Zhou J, Cheng T, Zhu X, Zhu P, Shi L
Cell discovery 2022 May 10;8(1):41
Cell discovery 2022 May 10;8(1):41
Single-cell profiling of healthy human kidney reveals features of sex-based transcriptional programs and tissue-specific immunity.
McEvoy CM, Murphy JM, Zhang L, Clotet-Freixas S, Mathews JA, An J, Karimzadeh M, Pouyabahar D, Su S, Zaslaver O, Röst H, Arambewela R, Liu LY, Zhang S, Lawson KA, Finelli A, Wang B, MacParland SA, Bader GD, Konvalinka A, Crome SQ
Nature communications 2022 Dec 10;13(1):7634
Nature communications 2022 Dec 10;13(1):7634
Bispecific T-Cell Engaging Antibodies Against MUC16 Demonstrate Efficacy Against Ovarian Cancer in Monotherapy and in Combination With PD-1 and VEGF Inhibition.
Yeku OO, Rao TD, Laster I, Kononenko A, Purdon TJ, Wang P, Cui Z, Liu H, Brentjens RJ, Spriggs D
Frontiers in immunology 2021;12:663379
Frontiers in immunology 2021;12:663379
Characterization and modulation of anti-αβTCR antibodies and their respective binding sites at the βTCR chain to enrich engineered T cells.
Kierkels GJJ, van Diest E, Hernández-López P, Scheper W, de Bruin ACM, Frijlink E, Aarts-Riemens T, van Dooremalen SFJ, Beringer DX, Oostvogels R, Kramer L, Straetemans T, Uckert W, Sebestyén Z, Kuball J
Molecular therapy. Methods & clinical development 2021 Sep 10;22:388-400
Molecular therapy. Methods & clinical development 2021 Sep 10;22:388-400
Effects of the Antidiabetic Drugs Evogliptin and Sitagliptin on the Immune Function of CD26/DPP4 in Th1 Cells.
Yoon H, Sung JH, Song MJ
Biomolecules & therapeutics 2021 Mar 1;29(2):154-165
Biomolecules & therapeutics 2021 Mar 1;29(2):154-165
Murlentamab, a Low Fucosylated Anti-Müllerian Hormone Type II Receptor (AMHRII) Antibody, Exhibits Anti-Tumor Activity through Tumor-Associated Macrophage Reprogrammation and T Cell Activation.
Prat M, Salon M, Allain T, Dubreuil O, Noël G, Preisser L, Jean B, Cassard L, Lemée F, Tabah-Fish I, Pipy B, Jeannin P, Prost JF, Barret JM, Coste A
Cancers 2021 Apr 13;13(8)
Cancers 2021 Apr 13;13(8)
Standardized 11-color flow cytometry panel for the functional phenotyping of human T regulatory cells.
Manuszak C, Brainard M, Thrash E, Hodi FS, Severgnini M
Journal of biological methods 2020;7(2):e131
Journal of biological methods 2020;7(2):e131
HDAC Inhibitor, CG-745, Enhances the Anti-Cancer Effect of Anti-PD-1 Immune Checkpoint Inhibitor by Modulation of the Immune Microenvironment.
Kim YD, Park SM, Ha HC, Lee AR, Won H, Cha H, Cho S, Cho JM
Journal of Cancer 2020;11(14):4059-4072
Journal of Cancer 2020;11(14):4059-4072
Identification of two HLA-A*0201 immunogenic epitopes of lactate dehydrogenase C (LDHC): potential novel targets for cancer immunotherapy.
Thomas R, Shaath H, Naik A, Toor SM, Elkord E, Decock J
Cancer immunology, immunotherapy : CII 2020 Mar;69(3):449-463
Cancer immunology, immunotherapy : CII 2020 Mar;69(3):449-463
Involvement of natural killer cells in the pathogenesis of endometriosis in patients with pelvic pain.
He J, Xu Y, Yi M, Gu C, Zhu Y, Hu G
The Journal of international medical research 2020 Jul;48(7):300060519871407
The Journal of international medical research 2020 Jul;48(7):300060519871407
MicroRNA‑155 inhibits the proliferation of CD8+ T cells via upregulating regulatory T cells in vitiligo.
Lv M, Li Z, Liu J, Lin F, Zhang Q, Li Z, Wang Y, Wang K, Xu Y
Molecular medicine reports 2019 Oct;20(4):3617-3624
Molecular medicine reports 2019 Oct;20(4):3617-3624
The Effects of High Mobility Group Box-1 Protein on Peripheral Treg/Th17 Balance in Patients with Atherosclerosis.
Ding JW, Zhou T, Zheng XX, Wang XA, Tong XH, Luo CY, Zhang ZQ, Yu B
Acta Cardiologica Sinica 2018 Sep;34(5):399-408
Acta Cardiologica Sinica 2018 Sep;34(5):399-408
RAB11FIP5 Expression and Altered Natural Killer Cell Function Are Associated with Induction of HIV Broadly Neutralizing Antibody Responses.
Bradley T, Peppa D, Pedroza-Pacheco I, Li D, Cain DW, Henao R, Venkat V, Hora B, Chen Y, Vandergrift NA, Overman RG, Edwards RW, Woods CW, Tomaras GD, Ferrari G, Ginsburg GS, Connors M, Cohen MS, Moody MA, Borrow P, Haynes BF
Cell 2018 Oct 4;175(2):387-399.e17
Cell 2018 Oct 4;175(2):387-399.e17
Impact of Enhancer of Zeste Homolog 2 on T Helper Cell-Mediated Allergic Rhinitis.
Hou TY, Chen MR, Chou YC, Kan PC, Tsai YT, Cha TL
Frontiers in immunology 2017;8:790
Frontiers in immunology 2017;8:790
Protein kinase CK2 controls T-cell polarization through dendritic cell activation in response to contact sensitizers.
de Bourayne M, Gallais Y, El Ali Z, Rousseau P, Damiens MH, Cochet C, Filhol O, Chollet-Martin S, Pallardy M, Kerdine-Römer S
Journal of leukocyte biology 2017 Mar;101(3):703-715
Journal of leukocyte biology 2017 Mar;101(3):703-715
CXCL13-producing TFH cells link immune suppression and adaptive memory in human breast cancer.
Gu-Trantien C, Migliori E, Buisseret L, de Wind A, Brohée S, Garaud S, Noël G, Dang Chi VL, Lodewyckx JN, Naveaux C, Duvillier H, Goriely S, Larsimont D, Willard-Gallo K
JCI insight 2017 Jun 2;2(11)
JCI insight 2017 Jun 2;2(11)
Non-neutralizing Antibodies Alter the Course of HIV-1 Infection In Vivo.
Horwitz JA, Bar-On Y, Lu CL, Fera D, Lockhart AAK, Lorenzi JCC, Nogueira L, Golijanin J, Scheid JF, Seaman MS, Gazumyan A, Zolla-Pazner S, Nussenzweig MC
Cell 2017 Aug 10;170(4):637-648.e10
Cell 2017 Aug 10;170(4):637-648.e10
Blocking the recruitment of naive CD4(+) T cells reverses immunosuppression in breast cancer.
Su S, Liao J, Liu J, Huang D, He C, Chen F, Yang L, Wu W, Chen J, Lin L, Zeng Y, Ouyang N, Cui X, Yao H, Su F, Huang JD, Lieberman J, Liu Q, Song E
Cell research 2017 Apr;27(4):461-482
Cell research 2017 Apr;27(4):461-482
Lack of T Cell Response to iPSC-Derived Retinal Pigment Epithelial Cells from HLA Homozygous Donors.
Sugita S, Iwasaki Y, Makabe K, Kimura T, Futagami T, Suegami S, Takahashi M
Stem cell reports 2016 Oct 11;7(4):619-634
Stem cell reports 2016 Oct 11;7(4):619-634
Remarkably low affinity of CD4/peptide-major histocompatibility complex class II protein interactions.
Jönsson P, Southcombe JH, Santos AM, Huo J, Fernandes RA, McColl J, Lever M, Evans EJ, Hudson A, Chang VT, Hanke T, Godkin A, Dunne PD, Horrocks MH, Palayret M, Screaton GR, Petersen J, Rossjohn J, Fugger L, Dushek O, Xu XN, Davis SJ, Klenerman D
Proceedings of the National Academy of Sciences of the United States of America 2016 May 17;113(20):5682-7
Proceedings of the National Academy of Sciences of the United States of America 2016 May 17;113(20):5682-7
An oncofetal antigen, IMP-3-derived long peptides induce immune responses of both helper T cells and CTLs.
Hirayama M, Tomita Y, Yuno A, Tsukamoto H, Senju S, Imamura Y, Sayem MA, Irie A, Yoshitake Y, Fukuma D, Shinohara M, Hamada A, Jono H, Yuba E, Kono K, Yoshida K, Tsunoda T, Nakayama H, Nishimura Y
Oncoimmunology 2016 Jun;5(6):e1123368
Oncoimmunology 2016 Jun;5(6):e1123368
Equilibrium of Treg/Th17 cells of peripheral blood in syphilitic patients with sero-resistance.
Zhao J, Ma J, Zhang X, Li Q, Yang X
Experimental and therapeutic medicine 2016 Jun;11(6):2300-2304
Experimental and therapeutic medicine 2016 Jun;11(6):2300-2304
Interaction among activated lymphocytes and mesenchymal cells through podoplanin is critical for a high IL-17 secretion.
Noack M, Ndongo-Thiam N, Miossec P
Arthritis research & therapy 2016 Jun 23;18:148
Arthritis research & therapy 2016 Jun 23;18:148
CD28 family of receptors on T cells in chronic HBV infection: Expression characteristics, clinical significance and correlations with PD-1 blockade.
Tang ZS, Hao YH, Zhang EJ, Xu CL, Zhou Y, Zheng X, Yang DL
Molecular medicine reports 2016 Aug;14(2):1107-16
Molecular medicine reports 2016 Aug;14(2):1107-16
New mouse model of acute adult T-cell leukemia generated by transplantation of AKT, BCLxL, and HBZ-transduced T cells.
Kasugai Y, Yoshida N, Ohshima K, Matsuo K, Seto M, Tsuzuki S
Cancer science 2016 Aug;107(8):1072-8
Cancer science 2016 Aug;107(8):1072-8
Tuning of AKT-pathway by Nef and its blockade by protease inhibitors results in limited recovery in latently HIV infected T-cell line.
Kumar A, Abbas W, Colin L, Khan KA, Bouchat S, Varin A, Larbi A, Gatot JS, Kabeya K, Vanhulle C, Delacourt N, Pasquereau S, Coquard L, Borch A, König R, Clumeck N, De Wit S, Rohr O, Rouzioux C, Fulop T, Van Lint C, Herbein G
Scientific reports 2016 Apr 14;6:24090
Scientific reports 2016 Apr 14;6:24090
Investigating the causes for decreased levels of glutathione in individuals with type II diabetes.
Lagman M, Ly J, Saing T, Kaur Singh M, Vera Tudela E, Morris D, Chi PT, Ochoa C, Sathananthan A, Venketaraman V
PloS one 2015;10(3):e0118436
PloS one 2015;10(3):e0118436
dNP2 is a blood-brain barrier-permeable peptide enabling ctCTLA-4 protein delivery to ameliorate experimental autoimmune encephalomyelitis.
Lim S, Kim WJ, Kim YH, Lee S, Koo JH, Lee JA, Yoon H, Kim DH, Park HJ, Kim HM, Lee HG, Yun Kim J, Lee JU, Hun Shin J, Kyun Kim L, Doh J, Kim H, Lee SK, Bothwell ALM, Suh M, Choi JM
Nature communications 2015 Sep 15;6:8244
Nature communications 2015 Sep 15;6:8244
Liposomal Glutathione Supplementation Restores TH1 Cytokine Response to Mycobacterium tuberculosis Infection in HIV-Infected Individuals.
Ly J, Lagman M, Saing T, Singh MK, Tudela EV, Morris D, Anderson J, Daliva J, Ochoa C, Patel N, Pearce D, Venketaraman V
Journal of interferon & cytokine research : the official journal of the International Society for Interferon and Cytokine Research 2015 Nov;35(11):875-87
Journal of interferon & cytokine research : the official journal of the International Society for Interferon and Cytokine Research 2015 Nov;35(11):875-87
Distinct patterns of intratumoral immune cell infiltrates in patients with HPV-associated compared to non-virally induced head and neck squamous cell carcinoma.
Partlová S, Bouček J, Kloudová K, Lukešová E, Zábrodský M, Grega M, Fučíková J, Truxová I, Tachezy R, Špíšek R, Fialová A
Oncoimmunology 2015 Jan;4(1):e965570
Oncoimmunology 2015 Jan;4(1):e965570
RNAi-Mediated CCR5 Knockdown Provides HIV-1 Resistance to Memory T Cells in Humanized BLT Mice.
Shimizu S, Ringpis GE, Marsden MD, Cortado RV, Wilhalme HM, Elashoff D, Zack JA, Chen IS, An DS
Molecular therapy. Nucleic acids 2015 Feb 17;4(2):e227
Molecular therapy. Nucleic acids 2015 Feb 17;4(2):e227
T helper cell subsets specific for Pseudomonas aeruginosa in healthy individuals and patients with cystic fibrosis.
Bayes HK, Bicknell S, MacGregor G, Evans TJ
PloS one 2014;9(2):e90263
PloS one 2014;9(2):e90263
M-CSF inhibits anti-HIV-1 activity of IL-32, but they enhance M2-like phenotypes of macrophages.
Osman A, Bhuyan F, Hashimoto M, Nasser H, Maekawa T, Suzu S
Journal of immunology (Baltimore, Md. : 1950) 2014 Jun 1;192(11):5083-9
Journal of immunology (Baltimore, Md. : 1950) 2014 Jun 1;192(11):5083-9
OMIP-022: Comprehensive assessment of antigen-specific human T-cell functionality and memory.
Graves AJ, Padilla MG, Hokey DA
Cytometry. Part A : the journal of the International Society for Analytical Cytology 2014 Jul;85(7):576-9
Cytometry. Part A : the journal of the International Society for Analytical Cytology 2014 Jul;85(7):576-9
Immune response to JC virus T antigen in patients with and without colorectal neoplasia.
Butcher LD, Garcia M, Arnold M, Ueno H, Goel A, Boland CR
Gut microbes 2014 Jul 1;5(4):468-75
Gut microbes 2014 Jul 1;5(4):468-75
Comparison of human adipose-derived stem cells isolated from subcutaneous, omental, and intrathoracic adipose tissue depots for regenerative applications.
Russo V, Yu C, Belliveau P, Hamilton A, Flynn LE
Stem cells translational medicine 2014 Feb;3(2):206-17
Stem cells translational medicine 2014 Feb;3(2):206-17
The lantibiotic peptide labyrinthopeptin A1 demonstrates broad anti-HIV and anti-HSV activity with potential for microbicidal applications.
Férir G, Petrova MI, Andrei G, Huskens D, Hoorelbeke B, Snoeck R, Vanderleyden J, Balzarini J, Bartoschek S, Brönstrup M, Süssmuth RD, Schols D
PloS one 2013;8(5):e64010
PloS one 2013;8(5):e64010
Human regulatory T cells kill tumor cells through granzyme-dependent cytotoxicity upon retargeting with a bispecific antibody.
Choi BD, Gedeon PC, Herndon JE 2nd, Archer GE, Reap EA, Sanchez-Perez L, Mitchell DA, Bigner DD, Sampson JH
Cancer immunology research 2013 Sep;1(3):163
Cancer immunology research 2013 Sep;1(3):163
Gelsolin activity controls efficient early HIV-1 infection.
García-Expósito L, Ziglio S, Barroso-González J, de Armas-Rillo L, Valera MS, Zipeto D, Machado JD, Valenzuela-Fernández A
Retrovirology 2013 Apr 10;10:39
Retrovirology 2013 Apr 10;10:39
Increased frequencies of Th22 cells as well as Th17 cells in the peripheral blood of patients with ankylosing spondylitis and rheumatoid arthritis.
Zhang L, Li YG, Li YH, Qi L, Liu XG, Yuan CZ, Hu NW, Ma DX, Li ZF, Yang Q, Li W, Li JM
PloS one 2012;7(4):e31000
PloS one 2012;7(4):e31000
Upregulation of programmed death-1 on T cells and programmed death ligand-1 on monocytes in septic shock patients.
Zhang Y, Li J, Lou J, Zhou Y, Bo L, Zhu J, Zhu K, Wan X, Cai Z, Deng X
Critical care (London, England) 2011;15(1):R70
Critical care (London, England) 2011;15(1):R70
Forced expression of cyclin-dependent kinase 6 confers resistance of pro-B acute lymphocytic leukemia to Gleevec treatment.
Kuo TC, Chavarria-Smith JE, Huang D, Schlissel MS
Molecular and cellular biology 2011 Jul;31(13):2566-76
Molecular and cellular biology 2011 Jul;31(13):2566-76
Modulation of CD4+ T lymphocyte lineage outcomes with targeted, nanoparticle-mediated cytokine delivery.
Park J, Gao W, Whiston R, Strom TB, Metcalfe S, Fahmy TM
Molecular pharmaceutics 2011 Feb 7;8(1):143-52
Molecular pharmaceutics 2011 Feb 7;8(1):143-52
Divergent expression patterns of IL-4 and IL-13 define unique functions in allergic immunity.
Liang HE, Reinhardt RL, Bando JK, Sullivan BM, Ho IC, Locksley RM
Nature immunology 2011 Dec 4;13(1):58-66
Nature immunology 2011 Dec 4;13(1):58-66
B cells and monocytes from patients with active multiple sclerosis exhibit increased surface expression of both HERV-H Env and HERV-W Env, accompanied by increased seroreactivity.
Brudek T, Christensen T, Aagaard L, Petersen T, Hansen HJ, Møller-Larsen A
Retrovirology 2009 Nov 16;6:104
Retrovirology 2009 Nov 16;6:104
Sepsis-induced human lymphocyte apoptosis and cytokine production in "humanized" mice.
Unsinger J, McDonough JS, Shultz LD, Ferguson TA, Hotchkiss RS
Journal of leukocyte biology 2009 Aug;86(2):219-27
Journal of leukocyte biology 2009 Aug;86(2):219-27
No comments: Submit comment
Supportive validation
- Submitted by
- Invitrogen Antibodies (provider)
- Main image

- Experimental details
- Staining of human peripheral blood mononuclear cells with CD45 Pacific Blue, CD3 APC, CD8 PerCP and CD4 PE. As expected based on known relative expression patterns, CD4 clone RPA-T4 stains a subset of lymphocytes (pink) and monocytes (orange), but not granulocytes (blue).
- Conjugate
- Yellow dye

Supportive validation
- Submitted by
- Invitrogen Antibodies (provider)
- Main image

- Experimental details
- NULL
- Conjugate
- Yellow dye

- Submitted by
- Invitrogen Antibodies (provider)
- Main image

- Experimental details
- NULL
- Conjugate
- Yellow dye

- Submitted by
- Invitrogen Antibodies (provider)
- Main image

- Experimental details
- NULL
- Conjugate
- Yellow dye

- Submitted by
- Invitrogen Antibodies (provider)
- Main image

- Experimental details
- NULL
- Conjugate
- Yellow dye

- Submitted by
- Invitrogen Antibodies (provider)
- Main image

- Experimental details
- NULL
- Conjugate
- Yellow dye

- Submitted by
- Invitrogen Antibodies (provider)
- Main image

- Experimental details
- NULL
- Conjugate
- Yellow dye

- Submitted by
- Invitrogen Antibodies (provider)
- Main image

- Experimental details
- NULL
- Conjugate
- Yellow dye

- Submitted by
- Invitrogen Antibodies (provider)
- Main image

- Experimental details
- NULL
- Conjugate
- Yellow dye

- Submitted by
- Invitrogen Antibodies (provider)
- Main image

- Experimental details
- NULL
- Conjugate
- Yellow dye

- Submitted by
- Invitrogen Antibodies (provider)
- Main image

- Experimental details
- NULL
- Conjugate
- Yellow dye

- Submitted by
- Invitrogen Antibodies (provider)
- Main image

- Experimental details
- NULL
- Conjugate
- Yellow dye

- Submitted by
- Invitrogen Antibodies (provider)
- Main image

- Experimental details
- NULL
- Conjugate
- Yellow dye

- Submitted by
- Invitrogen Antibodies (provider)
- Main image

- Experimental details
- NULL
- Conjugate
- Yellow dye

- Submitted by
- Invitrogen Antibodies (provider)
- Main image

- Experimental details
- NULL
- Conjugate
- Yellow dye

- Submitted by
- Invitrogen Antibodies (provider)
- Main image

- Experimental details
- NULL
- Conjugate
- Yellow dye

- Submitted by
- Invitrogen Antibodies (provider)
- Main image

- Experimental details
- NULL
- Conjugate
- Yellow dye

- Submitted by
- Invitrogen Antibodies (provider)
- Main image

- Experimental details
- NULL
- Conjugate
- Yellow dye

- Submitted by
- Invitrogen Antibodies (provider)
- Main image

- Experimental details
- NULL
- Conjugate
- Yellow dye

- Submitted by
- Invitrogen Antibodies (provider)
- Main image
- Experimental details
- NULL
- Conjugate
- Yellow dye
- Submitted by
- Invitrogen Antibodies (provider)
- Main image

- Experimental details
- NULL
- Conjugate
- Yellow dye

- Submitted by
- Invitrogen Antibodies (provider)
- Main image
- Experimental details
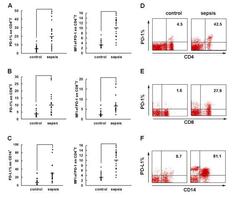
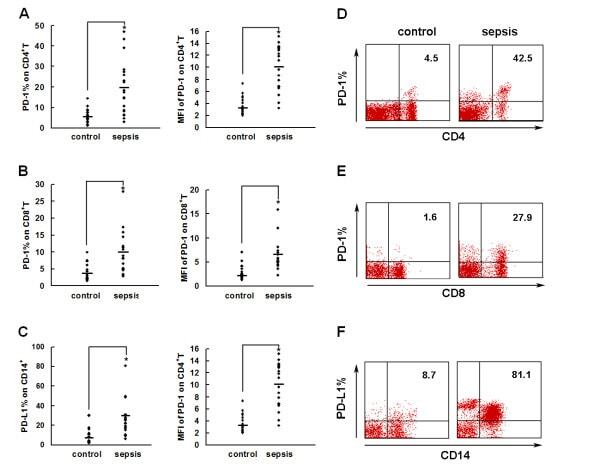
- Figure 2 PD-1 and PD-L1 were upregulated on T cells and monocytes in septic shock patients . Blood samples were obtained from 19 septic shock patients and 22 healthy controls and were stained for programmed death-1 (PD-1) and programmed death ligand-1 (PD-L1) gated on CD4 + T cells, CD8 + T cells, and CD14 + monocytes. (a) to (c) Percentage of PD-1 expression on (a) CD4 + T cells and (b) CD8 + T cells, and (c) percentage of PD-L1 expression on CD14 + monocytes. Each dot represents one individual. Data are mean +- standard error of the mean (SEM) of three independent experiments. ** P < 0.01 compared with healthy controls. (d) to (f) Mean fluorescence intensity (relative fluorescence units) of PD-1 expression on (d) CD4 + T cells, (e) PD-1 expression on CD8 + T cells, and (f) PD-L1 expression on CD14 + monocytes Each dot represents one individual. Data are mean +- SEM of three independent experiments. * P < 0.05 compared with healthy controls. (g) Representative PD-1 expression levels on CD4 + T cells and CD8 + T cells, and PD-L1 expression on CD14 + monocytes. Values in the upper-right quadrant indicate the percentage of cells that express PD-1 or PD-L1.
- Conjugate
- Yellow dye
- Submitted by
- Invitrogen Antibodies (provider)
- Main image

- Experimental details
- Fig 7 Measurement of ROS in CD14 + cells, CD4 + T-cells, and CD8 + T-cells by cellROX stain mean intensity in T2DM patients compared to healthy. CD14 + cells were stained with cellROX green reagent, a marker of ROS, and a CD14 cell marker, CD14-PE. CD14 + -ROX + cells' mean intensity was analyzed by FLOW cytometry. There was an observable increase in ROX mean intensity in CD14 + cells isolated from individuals with T2DM compared to healthy volunteers (Fig. 7A). CD4 + cells were also stained with cellROX green reagent and a CD4 cell marker, CD4-Cy5. CD4 + -ROX + cells' mean intensity was analyzed by FLOW cytometry. There was an observable increase in ROX mean intensity in CD4 + T-cells isolated from individuals with T2DM compared to healthy volunteers (Fig. 7B). CD8 + cells were stained with cellROX green reagent and a CD8 cell marker, CD8-Cy5. CD8 + -ROX + cells' mean intensity was analyzed by FLOW cytometry. There was an observable increase in ROX mean intensity in CD8 + T-cells isolated from individuals with T2DM compared to healthy volunteers (Fig. 7C). Data represents mean +-SE from 5 healthy individuals and 5 individuals with T2DM.
- Conjugate
- Yellow dye

- Submitted by
- Invitrogen Antibodies (provider)
- Main image

- Experimental details
- FIG. 2. Baseline comparison of the interleukin-6 (IL-6) and reactive oxygen species (ROS) markers between healthy volunteers and HIV-positive individuals. We observed a significant increase in the levels of the proinflammatory cytokine, IL-6 in plasma samples collected from individuals with HIV infection compared to healthy individuals (A) . Data represent mean+-SE from comparing baseline levels of 10 healthy volunteers and 15 HIV-positive individuals, **** P
- Conjugate
- Yellow dye

- Submitted by
- Invitrogen Antibodies (provider)
- Main image

- Experimental details
- FIG. 6. Difference in plasma IL-6 levels and ROS markers pre- and post-GSH supplementation. Sandwich ELISA was performed to compare the cytokine levels between pre-supplementation (V1) and post-supplementation (V3). Assay of cytokines showed a significant decrease in the levels of IL-6 in plasma samples collected from the lGSH-treatment group. There was no significant difference between the levels of IL-6 from the placebo group when comparing visit 1 and visit 3 (A) . Data represent mean+-SE, * P
- Conjugate
- Yellow dye

- Submitted by
- Invitrogen Antibodies (provider)
- Main image

- Experimental details
- Figure 1. Flow cytometric mapping of the CD4 + CD25 + Foxp3 + cells in peripheral blood withdrawn from the syphilitic patients with sero-resistance. Foxp3, forkhead box P3.
- Conjugate
- Yellow dye

- Submitted by
- Invitrogen Antibodies (provider)
- Main image

- Experimental details
- Figure 2. Flow cytometric mapping of the proportion of CD4 + IL-17 + cells in peripheral blood withdrawn from the syphilitic patients with sero-resistance. IL, interleukin.
- Conjugate
- Yellow dye

- Submitted by
- Invitrogen Antibodies (provider)
- Main image
- Experimental details
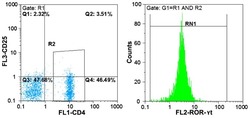
- Figure 4. Flow cytometric mapping of the expression of forkhead box P3 and retinoic acid-related orphan receptor gammat (ROR-gammat) molecules in CD4 + cells of peripheral blood.
- Conjugate
- Yellow dye
- Submitted by
- Invitrogen Antibodies (provider)
- Main image

- Experimental details
- Figure 4 Murlentamab opsonization of SKOV3-R2 + activates an effective anti-tumor T cell immune response. SKOV3-R2 + ovarian tumor cells were labeled with different 3C23K antibodies (3C23K-FcKO control, 3C23K-CHO normally fucosylated or murlentamab the low fucosylated form) and cultured in the presence of human monocyte-derived macrophages from healthy donors unstimulated (M0) or stimulated with M-CSF and IL-10 (TAMs). After 3 days of co-culture, activated T cells coming from the same healthy donor were added in the culture well for 4 more days. ( A ) The CD4 + Th1/Th2 polarization profile, ( B ) the proportion of CD3 + CD4 + CD25 + regulatory T cells and ( C ) the activation of T CD8 + cells were determined by flow cytometry after four days of co-culture. Data shown (boxplots) are the results from two different experiments (performed with two different healthy donors). * p < 0.05; ** p < 0.01; *** p < 0.001. p values were determined using one-way ANOVA analysis followed by Tukey''s multiple comparisons test.
- Conjugate
- Yellow dye

- Submitted by
- Invitrogen Antibodies (provider)
- Main image

- Experimental details
- Figure 5 Murlentamab/pembrolizumab combination accentuates the anti-tumoral effect of murlentamab monotherapy through the enhancement of T cell activation. ( A - C ) SKOV3-R2 + ovarian tumor cells were labeled with different 3C23K antibodies (3C23K-FcKO control or murlentamab the low fucosylated form) and cultured in the presence of human monocyte-derived macrophages from healthy donors stimulated with M-CSF and IL-10 (TAMs). After 3 days of co-culture, activated T cells coming from the same healthy donor were added in the culture well for 4 more days. Pembrolizumab was added into co-culture wells everyday from day 3 to day 10. ( A ) Opsonized-SKOV3-R2 + cell number was determined by flow cytometry after one and two days of co-culture with TAMs. Data shown (mean +- SEM) are the results from three different experiments (performed with one healthy donors). ** p < 0.01 compared 3C23K-FcKO vs. Murlentamab. # p < 0.05; ## p < 0.01 compared 3C23K-FcKO + anti-PD-1 vs. Murlentamab + anti-PD-1 as determined using one-way ANOVA analysis followed by Dunnett''s multiple comparisons test. ( B , C ) The CD4 + Th1/Th2 polarization profile and the activation of T CD8 + cells were determined by flow cytometry after four days of co-culture. Data shown (mean +- SEM) are the results from three different experiments (performed with one healthy donors). * p < 0.05; ** p < 0.01; *** p < 0.001; **** p < 0.0001. p values were determined using one-way ANOVA analysis followed by Tukey''s multiple compa
- Conjugate
- Yellow dye

- Submitted by
- Invitrogen Antibodies (provider)
- Main image

- Experimental details
- Figure 2. The frequency of CD4 + T cell subsets in the tumor tissues ( n = 44) with regard to human papillomavirus (HPV)-status. To evaluate the subtypes of tumor-infiltrating CD4 + T cells, tumor-derived single cell suspensions were stimulated with PMA and ionomycin in the presence of Brefeldin A and analyzed by flow cytometry. ( A, B, D, F, and H ) The plots represent the numbers of Th1 cells, Th17 cells, Tregs or naive T cells within 10 6 isolated tumor-derived cells; the lines in the box represent the median. ( C, E, G, and I ) The data are expressed as the proportion of Th1 cells, Th17 cells, Tregs and naive T cells, respectively, among the tumor-infiltrating CD4 + cells. The boundaries of the box indicate the SEM, and the lines in the box represent the mean. Whiskers indicate the SD * p < 0.05 (General Linear Models; age was added as a covariate).
- Conjugate
- Yellow dye

- Submitted by
- Invitrogen Antibodies (provider)
- Main image

- Experimental details
- Figure 5. The levels of cyclooxygenase 2 ( Cox-2 ), programmed cell death 1 (PD-1), programmed cell death-ligand 1 (PD-L1) and T cell immunoglobulin and mucin domain containing protein-3 (Tim-3) in control and metastatic lymph nodes and tumor tissue from head and neck squamous cell carcinoma (HNSCC) patients. ( A ) The white columns represent the relative mRNA expression of Cox-2 , PD-1 , PD-L1 and Tim-3 in control lymph nodes (LN; n = 14); the gray columns represent the relative mRNA expression of genes in metastatic lymph nodes ( n = 14); the black columns represent the relative mRNA expression of these genes in tumor tissues ( n = 14). To assess the expression levels of mRNA, cDNA was synthesized from total tumor and lymph node RNA and amplified by quantitative real time PCR. As an internal reference, beta-actin housekeeping gene was used. ( B ) The columns represent the mean proportion of IFNgamma + cells among Tim-3-PD-1- (white column), Tim-3-PD-1+ (gray column) and Tim-3+PD-1+ (black column) cells in the tumor tissue ( n = 6). To analyze the IFNgamma production, tumor-derived single cell suspensions were stimulated with PMA and ionomycin in the presence of Brefeldin A and analyzed by flow cytometry. ( C ) Dot plots show the expression of CD3 + on PD-1 + or Tim-3 + tumor-infiltrating cells from a representative patient. ( D ) Dot plots are gated on CD3 + CD8 + cells (upper line) and CD3 + CD4 + cells (lower line) and show the expression of Tim-3 and PD-1 in the peripher
- Conjugate
- Yellow dye

- Submitted by
- Invitrogen Antibodies (provider)
- Main image

- Experimental details
- Figure 2 Protein delivery efficiency of dNP2 in primary mouse and human immune cells. ( a , b ) Mouse primary splenocytes were isolated from 6-week-old female C57BL/6 mice and the cells were incubated with 5 muM EGFP, TAT- and dNP2-EGFP for 2 h. Intracellular fluorescence was analysed by flow cytometry and the data are represented as dot plots or mean fluorescence intensity (MFI) of the cells. ( c , d ) Human PBMCs were isolated from healthy donor blood and the cells were incubated with 5 muM EGFP, TAT-, dNP2-EGFP for 2 h. The data were analysed as described above. ( e ) Total splenocytes were incubated with 1 muM EGFP, TAT-, and dNP2-EGFP for 2 h. Cells were gated using markers specific for CD4 T cells (CD4 + ), B cells (CD19 + ), macrophages (CD11c lo CD11b hi F480 + ) and DCs (CD11c hi MHCII hi ). The EGFP signal in each cell population was then analysed by flow cytometric analysis. The relative MFI value was normalization to PBS treated cells. The red line indicates relative MFI of PBS-treated cells. ( f ) Total PBMCs were incubated with 1 muM EGFP, TAT-, and dNP2-EGFP for 2 h. Cells were gated with markers specific for CD4 T cells (CD4 + ), B cells (CD19 + ), macrophages (CD11b + ) and DCs (CD11c + ) and the data were then analysed as described above. ( g ) Time-lapse images of mouse CD4 T cells incubated with 1 muM EGFP, TAT- and dNP2-EGFP were acquired for 2 h (Scale bar, 15 mum) and ( h ) the average fluorescence intensities of 10 cells from each sample were calculate
- Conjugate
- Yellow dye

- Submitted by
- Invitrogen Antibodies (provider)
- Main image

- Experimental details
- Figure 3 Intracellular delivery mechanisms of dNP2. ( a ) Splenocytes from 6-week-old female C57BL/6 mice were incubated with 5 muM TAT- or dNP2-EGFP at various temperatures (4, 25 or 37 degC) for 2 h. The intracellular EGFP signal of gated CD4 T cells was analysed by flow cytometric analysis and the data are represented as mean fluorescence intensity (MFI). ( b ) The splenocytes were pretreated with 0, 10, 20 or 50 mug ml -1 heparin at 37 degC for 30 min and the cells were then further incubated with 5 muM TAT- or dNP2-EGFP at 37 degC for 2 h. The intracellular EGFP protein signal of gated CD4 T cells was analysed and the data are represented as described above. ( c - h ) The splenocytes were pre-treated with the indicated concentrations of chlorpromazine (CPZ), amiloride (Am) or methyl-beta cyclodextrin (MbetaCD) at 37 degC for 30 min and cells were further incubated with ( c - e ) 5 muM TAT- or dNP2-dTomato or ( f - h ) 5 muM TAMRA-labeled TAT or dNP2 peptide at 37 degC for 1 h. The intracellular dTomato protein signal or TAMRA signal in the CD4 T cells were analysed by flow cytometry. ( i ) HeLa cells were pre-treated with 1-5 mM MbetaCD or PBS on ice for 10 min and the cells were further incubated with 20 muM dTomato or dNP2-dTomato at 37 degC for 1 h. The intracellular localization of the dTomato protein was visualized by fluorescent microscopy ( x 400, Scale bar, 75 mum). Values are mean+-s.e.m. and * P
- Conjugate
- Yellow dye

- Submitted by
- Invitrogen Antibodies (provider)
- Main image

- Experimental details
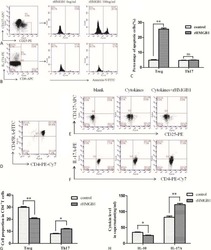
- Figure 5 Inhibition of effector T cell functions and amelioration of EAE by dNP2-ctCTLA-4. ( a ) DNA constructs and purified proteins. ( b ) Mouse splenocytes were incubated with 1 muM ctCTLA-4, Hph-1-, and dNP2-ctCTLA-4 for 1 h and the intracellular ctCTLA-4 proteins were stained with an anti-HA antibody and the signal was amplified with PE-conjugated anti-rabbit IgG antibody. Intracellular fluorescence was analysed by flow cytometry. ( c ) Splenocytes from 6-week-old female C57BL/6 mice were activated with anti-CD3/CD28 antibody or PMA/ionomycin in the presence of 1 muM PBS, dNP2-EGFP or dNP2-ctCTLA-4 for 24 h. The concentration of IL-2 was determined by ELISA assay. ( d ) The supernatants of anti-CD3/CD28 antibody stimulated cells were analysed for IFN-gamma and IL-17A by ELISA assay. ( e - i ) EAE was induced in 7-week-old female C57BL/6 mice as described in the Methods section. The mice were treated intraperitoneally with PBS or 25 mug dNP2-EGFP or dNP2-ctCTLA-4 on day 7 after MOG immunization and subsequently treated every other day (prevention scheme, n =15). ( e ) The clinical scores were monitored and ( f ) spinal cord tissues were harvested and observed after Luxol fast blue (LFB) and hematoxylin and eosin staining to determine demyelination and tissue inflammation levels (Scale bar, 100 mum). ( g ) The number of spinal cord tissue infiltrating cells was counted via Image J software. ( h ) The spinal cord cells were isolated and IL-17A and/or IFN-gamma expressing CD
- Conjugate
- Yellow dye

- Submitted by
- Invitrogen Antibodies (provider)
- Main image

- Experimental details
- Figure 1 HIV-1 Nef is internalized by CD4 + T cells and activates Akt in PBLs which is mediated via PI3K in a dose and time dependent manners. ( A ), Dose-dependent (n = 3) and ( B ), Time-dependent activation of Akt (pAkt(Ser473)) in PBLs treated with rNef (n = 3). ( B ) Five million PBLs were either left untreated or treated with rNef (100 ng/ml) for various period of time (30 seconds to 30 minutes). As a positive control, PBLs were treated with anti-CD28 antibody. Expression of pAkt (Ser473, Thr308), total Akt and beta-actin were detected by standard western blotting method as described in materials and methods (n = 3). ( C , D ) A series of confocal images showing internalization and colocalization of HIV-1 Nef and Akt ( C ) at serum concentration of Nef (1 to 10 ng/ml) and a dose response of rNef treatment on Akt activation ( D ) in PBLs isolated from healthy donors. ( E ), Internalization of rNef by CD4+ T cells determined by flow cytometry. Five million CD4+ T cells were treated with rNef for 30 min at 37 degC and 4 degC with and without permeabilization. Expression of rNef was determined by confocal microscopy (n = 3).( F ), Activation of Akt in PBLs treated with rNef is mediated via PI3K. Western blot detection of activated pAkt (Ser473, Thr308) in the lysates derived from 5 x 10 6 PBLs treated with 100 ng/ml of Nef with or without Akt (Akt inhibitor VIII) and PI3K inhibitors (LY294002 and Wortmannin) (n = 3). ( G ), Akt activation in PBLs by wild-type HIV-1, but not
- Conjugate
- Yellow dye

- Submitted by
- Invitrogen Antibodies (provider)
- Main image

- Experimental details
- Figure 3 Another PBMC-RPE MLR Assay with Allogeneic iPS-RPE Cells by Ki-67 Proliferation To evaluate the PBMC-RPE MLR assay with allogeneic HLA homozygote iPS-RPE cells (454E2, 453F2, and Ff-I01) and B cells as positive control cells, we used Ki-67 proliferation by FACS analysis using antibodies against CD4 + cells (helper T cells), CD8 + cells (cytotoxic T cells), CD11b + cells (macrophages/monocytes), CD19 + cells (B cells), and CD56 + (NK cells). (A) TLHD10 PBMCs versus both 454E2 and Ff-I01 iPS-RPE cells = HLA-A, -B, -DRB1 matched. (B) TLHD14 PBMCs versus TLHD1 iPS-RPE cells = HLA-A, -B, -DRB1 mismatched, and Ff-I01 iPS-RPE cells = HLA-A matched, and HLA-B and -DRB1 mismatched. Figure 3
- Conjugate
- Yellow dye

- Submitted by
- Invitrogen Antibodies (provider)
- Main image

- Experimental details
- Figure 5 Expression of Th1-Associated Cytokines in Allogeneic iPS-RPE Cell-Exposed Helper T Cells In FACS analysis, purified CD4 + T cells exposed to allogeneic HLA homozygous 454E2 iPS-RPE cells were stained with anti-human CD4/IFN-gamma, IL-2, or TNF-alpha antibody for 48 hr. (A) TLHD1 donor (versus 454E2 MHC-mismatched). (B) TLHD21 donor (versus 454E2 MHC-matched). Figure 5
- Conjugate
- Yellow dye

- Submitted by
- Invitrogen Antibodies (provider)
- Main image

- Experimental details
- Figure 7 Recognition of MHC-II Molecules on Allogeneic iPS-RPE Cells by CD4 + T Cells, but Not iPSCs (A) The graph depicts data for IFN-gamma ELISA by CD4 + T cells (TLHD1) exposed to 454E2 iPS-RPE cells. Anti-MHC-II (HLA-DR, -DP, -DQ) or isotype control antibody (mouse IgG) was used for the T cell RPE culture. Anti-human CD3 antibody was also used (right panel). Data represent the mean +- SEM of three independent experiments. (B) FACS data for IFN-gamma by CD4 + T cells (TLHD1) exposed to 454E2 iPS-RPE cells in the presence of anti-MHC-II blocking antibodies. (C) 454E2 human iPSCs were stained with anti-MHC-II antibody. Cells were also cultured with recombinant IFN-gamma for 48 hr. Red curve represents data for MHC-II molecules. Blue curve represents data for isotype controls. (D) Purified CD4 + T cells (TLHD1) were cultured with 454E2 iPSCs, 454E2 iPS-RPE cells, and 454E2 fibroblasts for 48 hr, and the supernatants were measured for IFN-gamma production by T cells. Data represent the mean +- SEM of four independent experiments. * p < 0.05, ** p < 0.005 compared with the positive control (open bars). n.s., not significant. Figure 7
- Conjugate
- Yellow dye

- Submitted by
- Invitrogen Antibodies (provider)
- Main image

- Experimental details
- Figure 3 Naive CD4 + T cells are converted to functional Tregs by tumor-infiltrating DCs and tumor conditioned medium (CM). (A-C) Naive CD4 + T cells from peripheral blood of patients with invasive breast carcinoma were co-cultured with or without autologous pDCs isolated from tumor (TI) or peripheral blood (PB) for 9 days in the presence or absence of 30% CM from autologous tumor slices or adjacent normal tissue slices. (A , B) Non-adherent cells from co-cultures were stained for CD3, CD4, CD25 and intracellular Foxp3, and analyzed by flow cytometry. Representative plots of gated CD3 + CD4 + cells (A) and quantification of percentage of Foxp3 + CD25 + cells among CD3 + CD4 + cells (B) are shown (mean +- SEM, n = 19; * P < 0.05, ** P < 0.01, *** P < 0.001 by Student's t -test). (C) Expression of Treg-associated genes, assessed by qRT-PCR normalized to GAPDH , in sorted CD4 + T cells, relative to expression in cultures without DCs or CM (mean +- SEM, n = 19; * P < 0.05, ** P < 0.01, *** P < 0.001 compared with naive CD4 + T cells cultured alone by Student's t -test). (D-G) Effect of naive CD4 + T cell-derived Tregs, obtained by co-culture with TI pDCs and tumor CM as above, on function of autologous tumor-specific CD8 + T cells. Tumor-specific CD8 + T cells were generated for each subject by stimulating autologous PB CD8 + T cells with autologous tumor lysate-pulsed autologous DCs. Tregs were recovered from co-cultures by magnetic sorting. (D) CFSE-labeled CD8 + T ce
- Conjugate
- Yellow dye

- Submitted by
- Invitrogen Antibodies (provider)
- Main image

- Experimental details
- Figure 6 In vivo knockdown of PITPNM3 in CD4 + T cells reverses immunosuppression and inhibits tumor progression in humanized mice. (A) Humanized mice bearing palpable MDA-MB-231 orthotopic xenografts were intraperitoneally injected daily for 14 days with PBS, 1 nmol CD4-aptamer-control siRNA (AsiC-con) or CD4-aptamer-siRNA targeting PITPNM3 (sequence in A , AsiC-PI) to assess the role of PITPNM3 in TI Tregs, and other T cells and tumor control. Experimental schematic is provided in Supplementary information, Figure S9A . (B) Representative immunoblots showing selective knockdown of PITPNM3 protein in PB CD4 + T cells, but not tumor xenografts ( n = 3). (C) PITPNM3 knockdown did not affect the distribution of human CD45 + hematopoietic cells, CD4 + and CD8 + T cells, and CD14 + monocytes in the peripheral blood of humanized mice. Representative flow plots are shown ( n = 3). (D , E) Effect of PITPNM3 knockdown on TI naive CD4 + , Tregs and CD8 + T cell numbers, and apoptosis by TUNEL assay in xenografts. D shows representative immunofluorescence microscopy images. Top row indicates CD4 + naive T cells by arrows; the second row indicates CD4 + CD45RO + Foxp3 - CD4 + memory T cells (yellow arrows) and Foxp3 + Tregs (white arrows). Scale bar, 50 mum. E shows number of cells of each subtype/high power field in eight mice ( ** P < 0.01, *** P < 0.001 compared to PBS group by Student's t -test). (F) Flow cytometry analysis of gated human CD3 + CD4 + cells isolated from xenogra
- Conjugate
- Yellow dye

- Submitted by
- Invitrogen Antibodies (provider)
- Main image

- Experimental details
- Figure 7 CD4-aptamer-siRNA targeting PITPNM3 reduces TI Tregs and inhibits tumor progression in humanized mice with circulating human Tregs. Humanized mice, implanted with MDA-MB-231 tumors and concurrently injected intravenously with autologous Tregs, were intraperitoneally injected daily for 14 days after tumors became palpable with PBS, 1 nmol CD4-aptamer-control siRNA (AsiC-con) or CD4-aptamer-siRNA targeting PITPNM3 to assess the role of PITPNM3 in TI Tregs, and other T cells and tumor control. Tregs were administered every 10 days after the initial injection and mice were sacrificed 30 days after tumor cell inoculation. (A) Experimental schematic. (B , C) Peripheral blood cells of humanized mice were stained for human CD3, CD4 and Foxp3, and analyzed by flow cytometry. A representative flow plot (B) and the percentage (mean +- SEM) of PB CD4 + cells that are CFSE + Tregs in six mice per group (C) are shown. (D , E) Isolated cells from xenografts were stained for human CD3, CD4 and Foxp3. The percentage (mean +- SEM) of six mice per group (D) and representative flow plot (E) of FoxP3 + Tregs are shown. Most Tregs were CFSE - (i.e., did not come from infused Tregs) and the number of TI Tregs was reduced by knocking down PITPNM3 in CD4 + T cells ( *** P < 0.001 compared to the PBS group by Student's t -test). (F) Tumor size (mean +- SEM, n = 6 per group; *** P < 0.001 by two-way ANOVA with Bonferroni multiple comparison tests). (G) Lung metastases assessed by qRT-PCR
- Conjugate
- Yellow dye

- Submitted by
- Invitrogen Antibodies (provider)
- Main image

- Experimental details
- Figure S6 Functional Analysis of CD56dim and CD56neg NK Subsets and Gating Strategy for Analysis of NK:Tfh:B Cell Co-culture, Related to Figures 4 and 5 (A) Spearman correlation of percentage of total NK cells undergoing degranulation (assessed by CD107a expression) on exposure to target cells with plasma HIV-1 neutralization breadth (PC1). (B and C) Summary boxplots for CD107a expression, IFN-gamma and TNF-alpha production from (B) CD56dim NK cells and (C) CD56neg NK cells following target cell stimulation in bnAb (red), control (blue) and HIV seronegative individuals (black). Each symbol represents data from an individual subject and the box-and-whisker plots show the median, quartiles and range. * p < 0.05, ** p < 0.01. P values corrected for MCA and viral load. (D) Class-switched memory B cells were identified as live CD3-CD4-CD56-CD19+IgD-IgM-CD20+CD38+/- cells and plasmablasts as live CD3-CD4-CD56-CD19+IgD-IgM-CD20-CD38+ cells. Tfh cells were identified as live CD3+CD4+CD19-CD56- cells. The division index was calculated using Flowjo software. CountBright absolute counting beads were used to calculate absolute numbers. The staining shown is from a representative subject (Tfh+B cell only condition).
- Conjugate
- Yellow dye

- Submitted by
- Invitrogen Antibodies (provider)
- Main image
- Experimental details
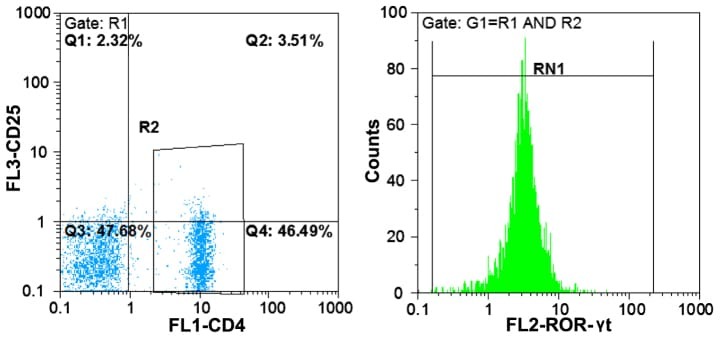
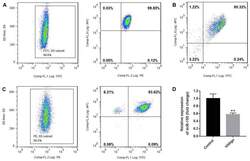
- Figure 1. Purity of CD3 + CD4 + CD45RA + T cells, CD3 + CD8 + T cells and CD4 + CD25 + FoxP3 + Treg cells. CD3 + CD4 + CD45RA + T cells and CD3 + CD8 + T cells were purified by magnetic cell sorting, and their purity was determined by flow cytometry. (A) The purity of CD3 + CD4 + CD45RA + T cells was 99.45% (CD3 + T cells, 99.6%; CD4 + CD45RA + T cells, 99.85%). (B) The purity of CD3 + CD8 + T cells was 95.32%. (C) The purity of CD4 + CD25 + FoxP3 + Treg cells was 93.15% (CD4 + T cells, 99.5%; CD25 + FoxP3 + T cells, 93.62%). (D) miR-155 expression in T cells of the patients with vitiligo and healthy donor was detected by reverse transcription quantitative polymerase chain reaction. **P
- Conjugate
- Yellow dye
- Submitted by
- Invitrogen Antibodies (provider)
- Main image

- Experimental details
- Fig. 5 Characterization of generated T cells against LDHC-derived peptides. Multi-parameter flow cytometry was conducted to assess the frequency of CD4 + and CD8 + central memory (T CM ), effector memory (T EM ), naive (T N ), and effector (T E ) T cells. a Frequency of immune cell subsets among T cell responses after in vitro stimulation with peptides or control (no peptides). Representative density plots show an increase in CD4 + and CD8 + T EM cells of donor D03 after stimulation with PP4 as compared to control (no peptides)-stimulated T cells. b Frequency of immune cell subsets among T cell responses after priming with autologous pulsed-DCs. Representative density plots show an increase in CD4 + and CD8 + T EM s of donor D09 after stimulation with P11- and P73-pulsed DCs as compared to the cell subpopulations of T cells primed by control (no peptides)-pulsed DCs
- Conjugate
- Yellow dye

- Submitted by
- Invitrogen Antibodies (provider)
- Main image

- Experimental details
- Figure 1 Enhancer of zeste homolog 2 (Ezh2) was involved in the development of allergic rhinitis (AR) in human patients. (A) The mean Th1/Th2 cell ratio in the patients with AR and controls. (B) Identification of Th1 (CD4 + CD45RA - IFN-gamma + ) cells in peripheral blood mononuclear cells (PBMCs). (C) Identification of Th2 (CD4 + CD45RA - IL-4 + ) cells in PBMCs. (D) Expression of Ezh2 in Th1 cells in in the patients with AR and controls (two representatives in each group). (E) Expression of Ezh2 in Th2 cells in the patients and controls (two representatives in each group). (F) Relative Ezh2 expression of Th1 cells to naive CD4 + T cells. The mean fluorescence intensity (MFI) of Th1 cells divided by the MFI of naive CD4 + T cells in the same tube [(MFI of the Th1 cells/MFI of the naive CD4 + T cells) x 100%] ( n = 65 in the AR group and n = 49 in the control group). (G) Relative Ezh2 expression of Th2 cells to naive CD4 + T cells. The MFI of Th2 cells divided by the MFI of naive CD4 + T cells in the same tube [(MFI of Th2 cells/MFI of naive CD4 + T cells) x 100%] ( n = 65 in the AR group and n = 49 in the control group). (H) Correlation analysis between the relative Ezh2 MFI of Th1 and Th2 cells. (I) Total IgE levels in all subjects with lower relative Ezh2 MFI of Th1 cells (lower than the median relative Ezh2 MFI in the controls: 147.60%) compared with those with a lower relative Ezh2 MFI of Th1 cells. (J) Allergen-specific IgE to Dermatophag
- Conjugate
- Yellow dye

- Submitted by
- Invitrogen Antibodies (provider)
- Main image

- Experimental details
- Figure 3 CG-745 increases helper T cells, cytotoxic T cells and natural killer T cells, and decreases Treg: (A) hPBMCs were incubated with CG (CG-745) for 36 hours and a subset of hPBMCs was analyzed using the antibodies indicated in the text; (B) hPBMCs were co-cultured with Huh7, Hep3B, HepG2 or PLC/PRF/5 cells for 36 hours with or without CG, and a subset of hPBMCs was analyzed by Attune Nxt (Invitrogen, USA).
- Conjugate
- Yellow dye
