Explore
 Validate
 Learn
Learn Western blot
Antibody data
- Antibody Data
- Antigen structure
- References [7]
- Comments [0]
- Validations
- Western blot [2]
- Immunocytochemistry [2]
- Flow cytometry [1]
- Other assay [5]
Submit
Validation data
Reference
Comment
Report error
- Product number
- 701134 - Provider product page

- Provider
- Invitrogen Antibodies
- Product name
- E-cadherin Recombinant Rabbit Monoclonal Antibody (5H6L18)
- Antibody type
- Monoclonal
- Antigen
- Synthetic peptide
- Description
- Intact IgG appears on a non-reducing gel as ~150 kDa band and upon reduction generating a ~25 kDa light chain band and a ~50 kDa heavy chain.
- Antibody clone number
- 5H6L18
- Concentration
- 0.5 mg/mL
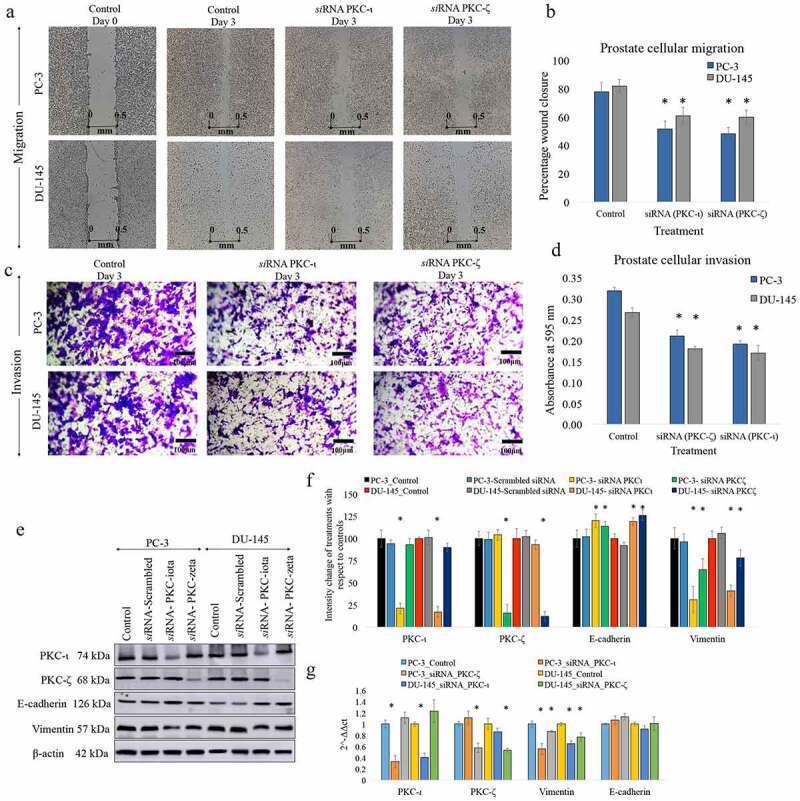
Submitted references Atypical PKCs activate Vimentin to facilitate prostate cancer cell motility and invasion.
Rainbow Trout (Oncorhynchus Mykiss) Intestinal Epithelial Cells as a Model for Studying Gut Immune Function and Effects of Functional Feed Ingredients.
Endothelial Differentiation G Protein-Coupled Receptor 5 Plays an Important Role in Induction and Maintenance of Pluripotency.
Analysis of PKC-ζ protein levels in normal and malignant breast tissue subtypes.
HDAC inhibitors, trichostatin A and valproic acid, increase E‑cadherin and vimentin expression but inhibit migration and invasion of cholangiocarcinoma cells.
Two novel atypical PKC inhibitors; ACPD and DNDA effectively mitigate cell proliferation and epithelial to mesenchymal transition of metastatic melanoma while inducing apoptosis.
Cisplatin promotes mesenchymal-like characteristics in osteosarcoma through Snail.
Ratnayake WS, Apostolatos CA, Breedy S, Dennison CL, Hill R, Acevedo-Duncan M
Cell adhesion & migration 2021 Dec;15(1):37-57
Cell adhesion & migration 2021 Dec;15(1):37-57
Rainbow Trout (Oncorhynchus Mykiss) Intestinal Epithelial Cells as a Model for Studying Gut Immune Function and Effects of Functional Feed Ingredients.
Wang J, Lei P, Gamil AAA, Lagos L, Yue Y, Schirmer K, Mydland LT, Øverland M, Krogdahl Å, Kortner TM
Frontiers in immunology 2019;10:152
Frontiers in immunology 2019;10:152
Endothelial Differentiation G Protein-Coupled Receptor 5 Plays an Important Role in Induction and Maintenance of Pluripotency.
Neganova I, Cotts L, Banks P, Gassner K, Shukurov A, Armstrong L, Ladds G, Lako M
Stem cells (Dayton, Ohio) 2019 Mar;37(3):318-331
Stem cells (Dayton, Ohio) 2019 Mar;37(3):318-331
Analysis of PKC-ζ protein levels in normal and malignant breast tissue subtypes.
Smalley T, Islam SMA, Apostolatos C, Apostolatos A, Acevedo-Duncan M
Oncology letters 2019 Feb;17(2):1537-1546
Oncology letters 2019 Feb;17(2):1537-1546
HDAC inhibitors, trichostatin A and valproic acid, increase E‑cadherin and vimentin expression but inhibit migration and invasion of cholangiocarcinoma cells.
Wang JH, Lee EJ, Ji M, Park SM
Oncology reports 2018 Jul;40(1):346-354
Oncology reports 2018 Jul;40(1):346-354
Two novel atypical PKC inhibitors; ACPD and DNDA effectively mitigate cell proliferation and epithelial to mesenchymal transition of metastatic melanoma while inducing apoptosis.
Ratnayake WS, Apostolatos AH, Ostrov DA, Acevedo-Duncan M
International journal of oncology 2017 Nov;51(5):1370-1382
International journal of oncology 2017 Nov;51(5):1370-1382
Cisplatin promotes mesenchymal-like characteristics in osteosarcoma through Snail.
Fang S, Yu L, Mei H, Yang J, Gao T, Cheng A, Guo W, Xia K, Liu G
Oncology letters 2016 Dec;12(6):5007-5014
Oncology letters 2016 Dec;12(6):5007-5014
No comments: Submit comment
Supportive validation
- Submitted by
- Invitrogen Antibodies (provider)
- Main image
- Experimental details
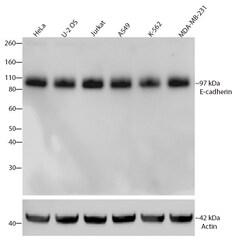
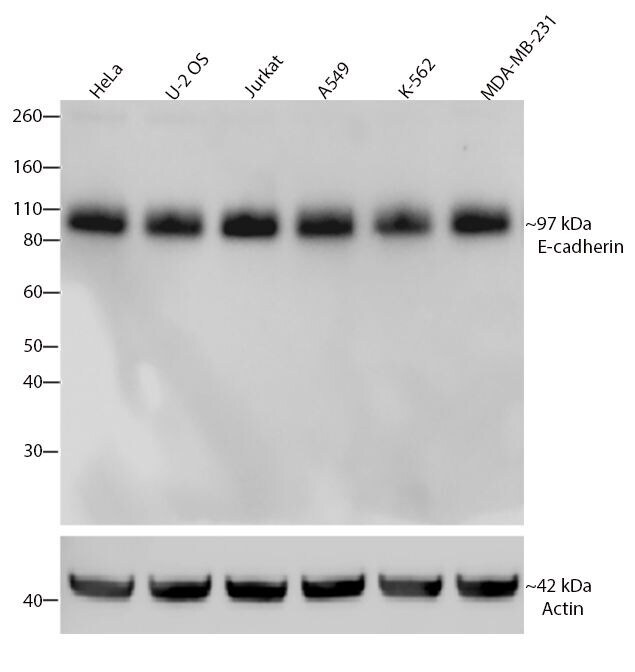
- Western blot analysis of E-cadherin/CD324 was performed by loading 30 µg of HeLa, U-2 OS, Jurkat, A549, K562 and MDA-MB-231 cell lysates using Novex®NuPAGE® 4-12% Bis-Tris Gel (Product # NP0321BOX), XCell SureLock Electrophoresis System (Product # EI0002), and Novex® Sharp Pre-Stained Protein Standard (Product # LC5800). Proteins were transferred to a PVDF membrane and blocked with 5% skim milk for 1 hour at room temperature. E-cadherin/CD324 was detected at ~97 kDa using E-cadherin/CD324 Recombinant Rabbit Monoclonal Antibody (Product # 701134) at a 1:1000 dilution in 2.5% skim milk at 4°C overnight on a rocking platform. Detection was performed using an HRP-conjugated Goat anti-Rabbit secondary antibody (Product # G-21234) at a 1:5000 dilution and chemiluminescent detection was performed using Pierce™ ECL Western blotting Substrate (Product # 32106).
- Submitted by
- Invitrogen Antibodies (provider)
- Main image
- Experimental details
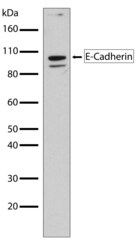
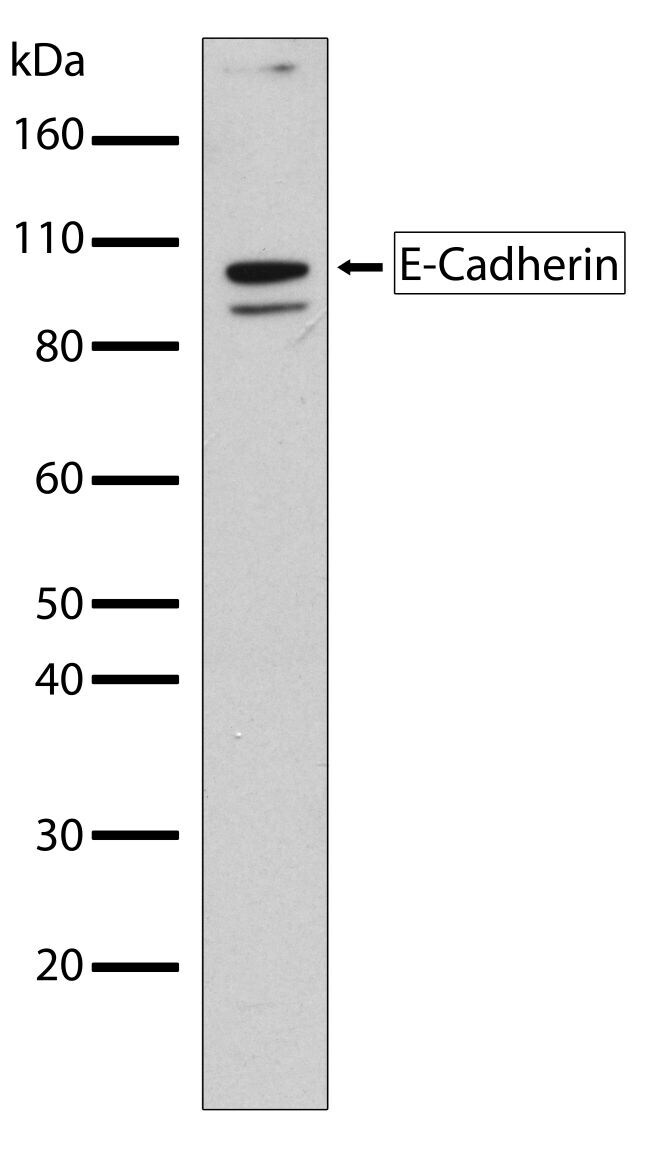
- Western blot analysis of E Cadherin in MCF-7 whole cell extracts using an E Cadherin recombinant rabbit monoclonal antibody (Product # 701134) at a dilution of 1 µg/mL. Samples were detected using chemiluminescence (ECL). Results show a band at ~97kDa.
Supportive validation
- Submitted by
- Invitrogen Antibodies (provider)
- Main image
- Experimental details
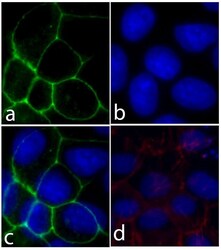
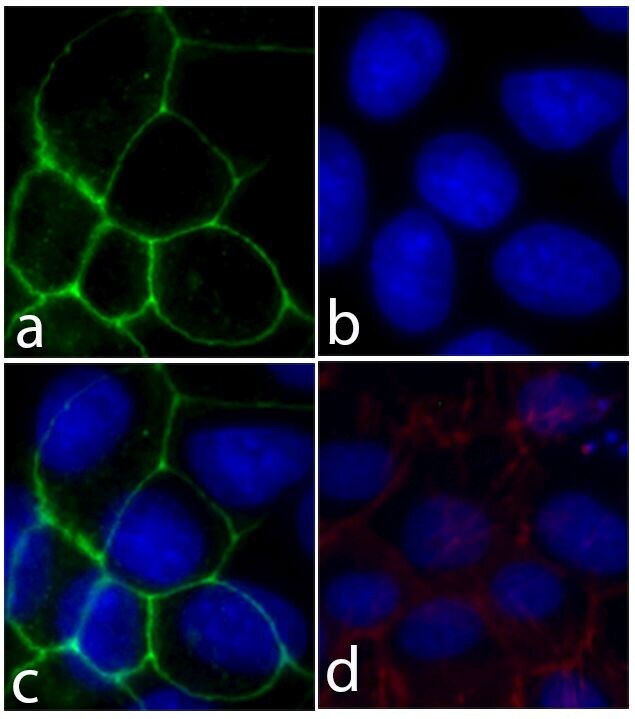
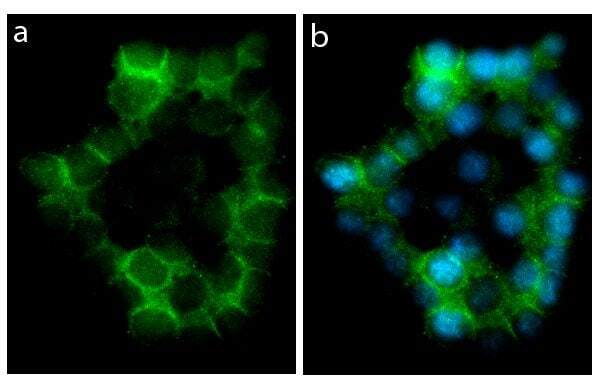
- Immunofluorescent analysis of E-cadherin/CD324 was performed on 90% confluent log phase Caco-2 cells. The cells were fixed with 4% paraformaldehyde for 15 minutes, and blocked with 5% BSA for 1 hour at room temperature. The cells were labeled with E-cadherin/CD324 Recombinant Rabbit Monoclonal Antibody (Product # 701134) at a dilution of 1:500 in 1% BSA and incubated for 3 hours at room temperature and then labeled with Alexa Fluor® 488 Goat anti-Rabbit IgG secondary antibody (Product # A-11008) at a dilution of 1:400 for 30 minutes at room temperature (Panel a: green). Nuclei (Panel b: blue) were stained with SlowFade® Gold Antifade Mountant with DAPI (Product # S36938). Panel c is a merged image showing cell junction localization and panel d is a control without primary antibody. The images were captured using a Nikon microscope at 20X magnification.
- Submitted by
- Invitrogen Antibodies (provider)
- Main image
- Experimental details
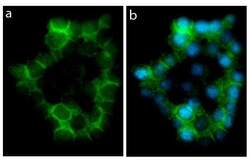
- Immunofluorescent analysis of E Cadherin in HEK293 cells using an E Cadherin recombinant rabbit monoclonal antibody (Product # 701134) followed by detection using an Alexa Fluor 488-conjugated goat anti-rabbit secondary antibody (green) and nuclei staining using DAPI (Image A). Image B is a composite image showing localization of E-cadherin at cell membrane and junction.
Supportive validation
- Submitted by
- Invitrogen Antibodies (provider)
- Main image
- Experimental details
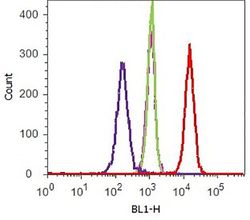
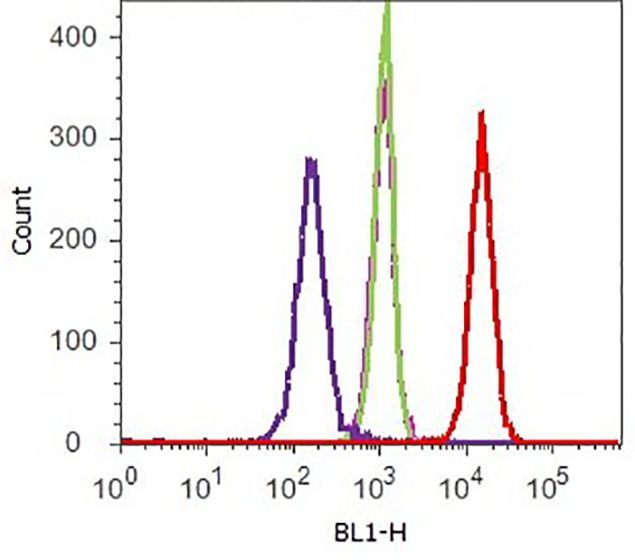
- Flow cytometry analysis of E-cadherin/CD324 was performed on HEK-293 cells. Cells were fixed with 70% ethanol for 10 minutes, permeabilized with 0. 25% Tritonª X-100 for 20 minutes, and blocked with 5% BSA for 1 hour at room temperature. Cells were labeled with ABfinityª E-cadherin/CD324 recombinant rabbit monoclonal antibody (Product # 701134, red histogram) or with rabbit isotype control (pink histogram) at a dilution of 1:250 in 2.5% BSA. After incubation at room temperature for 3 hours, the cells were labeled with Alexa Fluor¨ 488 goat anti-Rabbit Secondary antibody (Product # A11008) at a dilution of 1:400 for 30 minutes at room temperature. The representative 10,000 cells were acquired and analyzed for each sample using an Attune¨ Acoustic Focusing Cytometer. The purple histogram represents unstained control cells and the green histogram represents no-primary-antibody control.
Supportive validation
- Submitted by
- Invitrogen Antibodies (provider)
- Main image
- Experimental details
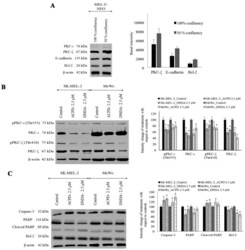
- Figure 5 Western blots of aPKC expression in normal melanocytes and the effects of ACPD and DNDA on aPKC expression and apoptosis on malignant melanoma cells. (A) The western blots and densitometry values of expression of PKC-iota, PKC-zeta, E-cadherin and Bcl-2 in MEL-F-NEO normal melanocytes examined at 50 and 100% confluency levels. (B) The expression of phosphorylated PKC-iota, total PKC-iota, phosphorylated PKC-zeta and total PKC-zeta and (C) represents the protein expression of selected apoptotic markers (caspase-3, cleaved PARP, total PARP and Bcl-2) for the ACPD and DNDA (2.5 u M) treated malignant melanoma cell lines (SK-MEL-2 and MeWo) after the end of 3rd day of treatments with respect to their controls. Densitometry bar graphs for (B and C) are shown as the percentage change of the treated samples with respect to their controls and mean +- SD are plotted. A total of 40 u g of protein was loaded into each well and beta-actin was used as the loading control in each western blot analysis. Experiments (N=3) were performed.

- Submitted by
- Invitrogen Antibodies (provider)
- Main image

- Experimental details
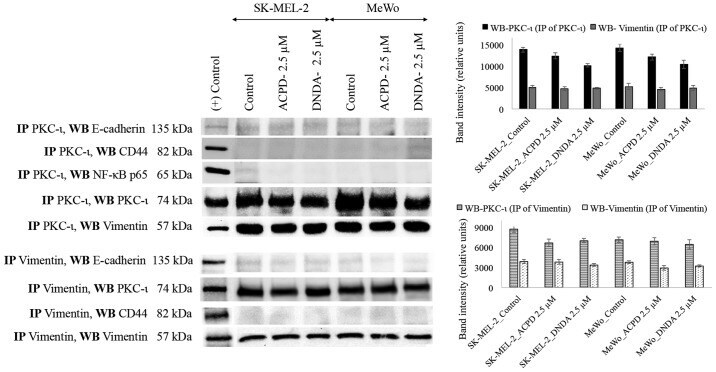
- Figure 8 PKC-iota strongly associates with vimentin. Whole cell lysates (100 u g) of malignant cells (Sk-MeL-2 and MeWo) were IP separately for PKC-iota and vimentin using specific antibodies. First column of the western blot analysis represents the (+) control which contained 40 u g of MeWo whole cell extract, applied to ensure that bands appeared for the specific proteins in western blots. Western blots of PKC-iota IP showed an association with vimentin while no association was observed for E-cadherin, CD44 and NF-kappaB p65. Vimentin IP confirmed the association with PKC-iota the western blot while no association was observed with above mentioned proteins. Three experiments were performed in each trial. Densitometry for each band is indicated in the bar graph.
- Submitted by
- Invitrogen Antibodies (provider)
- Main image
- Experimental details
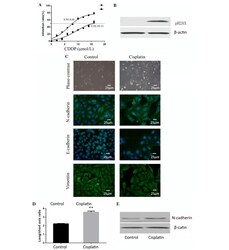
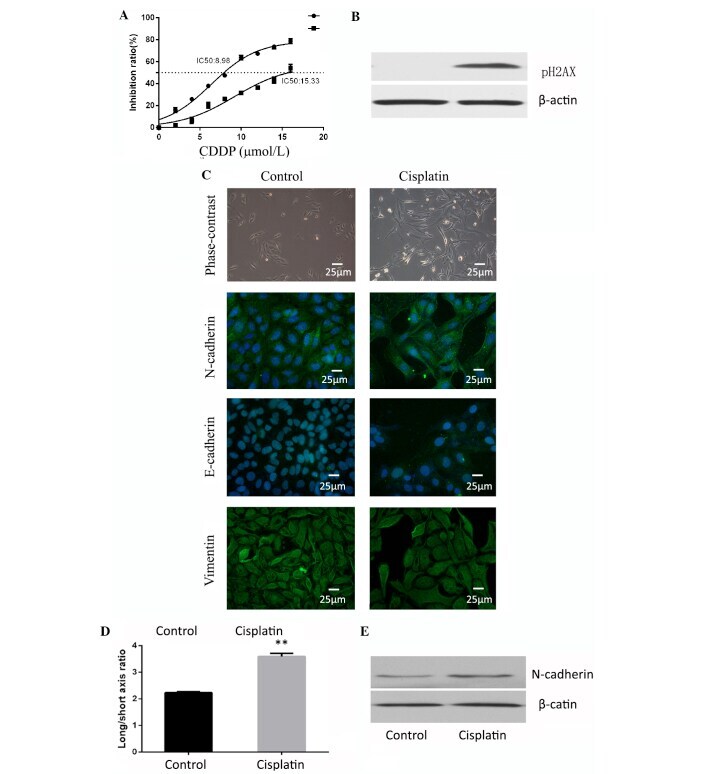
- Figure 1. Cisplatin induces epithelial-mesenchymal transition in osteosarcoma. (A) Cells treated with cisplatin were observed to have increased resistance to cisplatin. (B) Cells treated with cisplatin demonstrated high expression of pH2AX and confirmed the effectiveness of cisplatin. (C) Cell shape was observed by phase contrast microscopy and immunocytofluorescence. Staining of E-cadherin, N-cadherin and vimentin for the two groups of cells was observed by fluorescence microscope (magnification, x400; Scale, 25 um). Cells treated with cisplatin had higher N-cadherin expression. (D) Cisplatin-treated group cells had a higher average ratio of long/short axis. **P
- Submitted by
- Invitrogen Antibodies (provider)
- Main image
- Experimental details
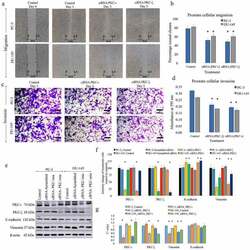
- Figure 1. aPKC knockdown decreases prostate cancer cell migration and invasion. Figure 1(a) and 1(b) represent the effects of aPKC si RNA treatments (20 nM against scrambled si RNA) on PC-3 and DU-145 cell migration in wound healing assay and Figure 1c and 1d represent the effects of aPKC si RNA treatments on prostate cell invasion in Boyden chamber assay in the presence of basement extract (BME). In the wound healing assay, microscopic photographs (40x) of scratches on cells at the beginning (day 0) were compared with the photographs taken after 3 days. The effects of aPKC attenuation are shown compared to their controls. Experiments were performed for each cell line and representative photographs are shown ( N = 3). Figure 1b bar graph represents a comparison of calculated percent wound closure for the photographs taken using ImageJ (NIH, Rockville, MD, USA). For the Boyden chamber assay (Figure 1b), invaded cells in the bottom surface of transwell insert were stained with 0.5% crystal violet and microscopic photographs were taken (100x). Subsequently, crystal violet was dissolved in 70% ethanol and absorbance was measured at 590 nm which is directly proportional to the number of invaded cells (Figure 1d). Figure 1e shows the effect of RNA interference ( si RNA) of PKC-iota and PKC-zeta in prostate cancer cells (PC-3 and DU-145). PC-3 and DU-145 (1 x 10 5 ) cells were seeded in T25 flasks and after 24 h post seeding time, fresh medium was supplied and si RNA (20 nM for PKC-
- Submitted by
- Invitrogen Antibodies (provider)
- Main image
- Experimental details
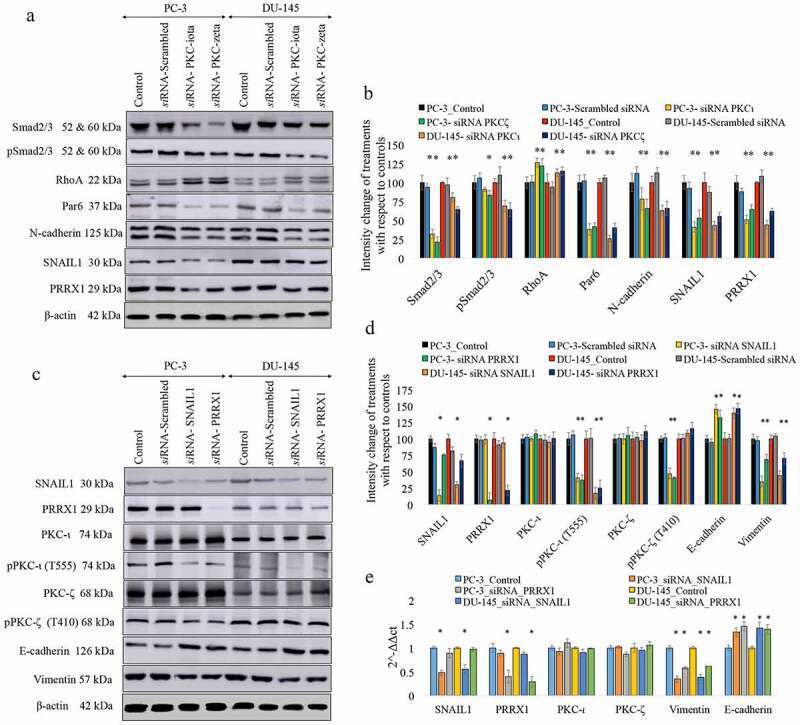
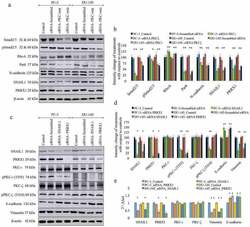
- Figure 2. Effects of RNA interference ( si RNA) for aPKCs, transcription factors of PRRX1 and SNAIL1 on the expression of EMT markers in prostate cancer cells. Figure 2(a) and 2(b) show the expression of the protein levels for EMT markers for aPKC attenuation (Smad2/3, pSmad2/3 RhoA, Par6 and N-cadherin) and the transcription factors of SNAIL1 and PRRX1. Figure 2c and 2d show the expression of SNAIL1, PRRX1, total PKC-iota, phosphorylated PKC-iota (T555), total PKC-zeta, phosphorylated PKC-zeta (S410), E-cadherin and Vimentin for the si RNA knockdown of the expression of SNAIL1 for PC-3 and DU-145 cell lines. PC-3 and DU-145 (1 x 10 5 ) cells were seeded in T25 flasks and after 24 h post seeding time, fresh medium was supplied and si RNA (20 nM for PKC-iota/zeta or 30 nM for SNAIL1 or PRRX1) treatments were conducted for 48 h using 'siTran' si RNA transfection reagent. Total protein (80 mug) was loaded into each well and beta-actin was used as the internal control in each Western blot. Representative densitometry values for the Western blots are shown (Figure 2(b) and 2(d)). Experiments were performed and representative bands are shown ( N = 4). The blots are cropped from different gels and separated with a white space between them Fig. 2E shows the mRNA levels of SNAIL1, PRRX1, PKC-iota, PKC-zeta, E-cadherin and Vimentin for SNAIL1 and PRRX1 si RNA knockdown samples for PC-3 and DU-145 cells based on quantitative real-time PCR (qPCR) ( N = 3). All values are reported as the