Explore
 Validate
 Learn
Learn Western blot
Antibody data
- Antibody Data
- Antigen structure
- References [1]
- Comments [0]
- Validations
- Western blot [1]
- Immunocytochemistry [1]
- Chromatin Immunoprecipitation [1]
Submit
Validation data
Reference
Comment
Report error
- Product number
- 710169 - Provider product page

- Provider
- Invitrogen Antibodies
- Product name
- PDGFRA Recombinant Polyclonal Antibody
- Antibody type
- Polyclonal
- Antigen
- Recombinant full-length protein
- Description
- Recombinant rabbit polyclonal antibodies are unique offerings from Thermo Fisher Scientific. They are comprised of a selection of multiple different recombinant monoclonal antibodies, providing the best of both worlds - the sensitivity of polyclonal antibodies with the specificity of monoclonal antibodies - all delivered with the consistency only found in a recombinant antibody. While functionally the same as a polyclonal antibody - recognizing multiple epitope sites on the target and producing higher detection sensitivity for low abundance targets - a recombinant rabbit polyclonal antibody has a known mixture of light and heavy chains. The exact population can be produced in every lot, circumventing the biological variability typically associated with polyclonal antibody production.
- Reactivity
- Human
- Host
- Rabbit
- Isotype
- IgG
- Vial size
- 100 µg
- Concentration
- 0.5 mg/mL
- Storage
- Store at 4°C short term. For long term storage, store at -20°C, avoiding freeze/thaw cycles.
Submitted references A phase II study of tivozanib in patients with metastatic and nonresectable soft-tissue sarcomas.
Agulnik M, Costa RLB, Milhem M, Rademaker AW, Prunder BC, Daniels D, Rhodes BT, Humphreys C, Abbinanti S, Nye L, Cehic R, Polish A, Vintilescu C, McFarland T, Skubitz K, Robinson S, Okuno S, Van Tine BA
Annals of oncology : official journal of the European Society for Medical Oncology 2017 Jan 1;28(1):121-127
Annals of oncology : official journal of the European Society for Medical Oncology 2017 Jan 1;28(1):121-127
No comments: Submit comment
Supportive validation
- Submitted by
- Invitrogen Antibodies (provider)
- Main image
- Experimental details
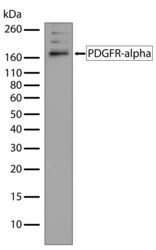
- Western blot analysis of PDGFR alpha in whole cell extracts of HepG2 cells using a PDGFR alpha Recombinant Rabbit Polyclonal Antibody (Product # 710169) at a dilution of 2.5 µg/mL. Samples were detected using chemiluminescence (ECL). Results show a band at ~190kDa.

Supportive validation
- Submitted by
- Invitrogen Antibodies (provider)
- Main image

- Experimental details
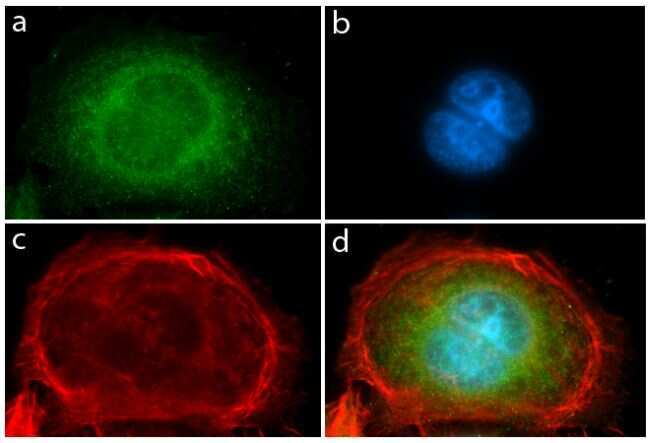
- Immunofluorescent analysis of PDGFR alpha in serum-starved HeLa cells treated with insulin (100 ng/mL, 15 min) using a PDGFR alpha Recombinant Rabbit Polyclonal Antibody (Product # 710169) followed by detection using an Alexa Fluor 488-conjugated Goat anti-Rabbit secondary antibody (green) (Image A). Nuclei were stained using DAPI (Image B) and actin stained with Alexa Fluor 594 phalloidin (red) (image C). Image D is a composite image showing cytoplasmic and nuclear membrane localization of PDGFR-alpha.
Supportive validation
- Submitted by
- Invitrogen Antibodies (provider)
- Main image
- Experimental details
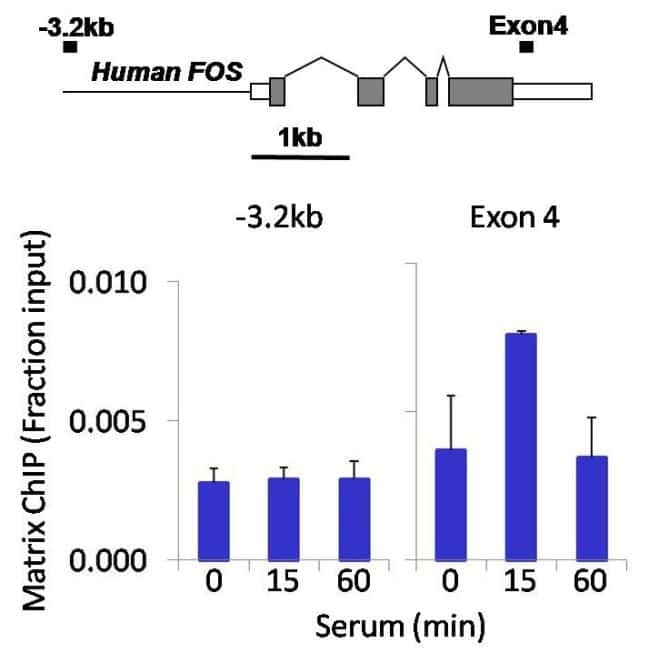
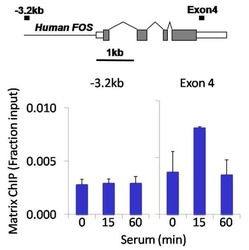
- Chromatin immunoprecipitation analysis of PDGF Receptor alpha was performed using cross-linked chromatin from 1 x 10^6 HCT116 human colon carcinoma cells treated with serum for 0, 15, and 60 minutes. Immunoprecipitation was performed using a multiplex microplate Matrix ChIP assay (see reference for Matrix ChIP protocol: http://www.ncbi.nlm.nih.gov/pubmed/22098709) with 1.0 µL/100 µL well volume of a PDGF Receptor alpha Recombinant Rabbit Polyclonal Antibody (Product # 710169). Chromatin aliquots from ~1 x 10^5 cells were used per ChIP pull-down. Quantitative PCR data were done in quadruplicate using 1 µL of eluted DNA in 2 µL SYBR real-time PCR reactions containing primers to amplify -3.2kb upstream of the human FOS gene, or exon-4 of human FOS. PCR calibration curves were generated for each primer pair from a dilution series of sheared total genomic DNA. Quantitation of immunoprecipitated chromatin is presented as signal relative to the total amount of input chromatin. Results represent the mean +/- SEM for three experiments. A schematic representation of the FOS locus is shown above the data where boxes represent exons (grey boxes = translated regions, white boxes = untranslated regions), the zigzag lines represent introns, and the straight line represents upstream sequence. Regions amplified by FOS primers are represented by black bars. Data courtesy of the Innovators Program.