 Explore
 Validate
 Learn
LearnMA1-822
antibody from Invitrogen Antibodies
Targeting: PPARA
hPPAR, NR1C1, PPAR
 Western blot Immunocytochemistry
 Immunoprecipitation Flow cytometry Gel shift Chromatin Immunoprecipitation Other assay
Antibody data
- Antibody Data
- Antigen structure
- References [20]
- Comments [0]
- Validations
- Western blot [1]
- Immunocytochemistry [1]
- Flow cytometry [4]
- Other assay [9]
Submit
Validation data
Reference
Comment
Report error
- Product number
- MA1-822 - Provider product page

- Provider
- Invitrogen Antibodies
- Product name
- PPAR alpha Monoclonal Antibody (3B6/PPAR)
- Antibody type
- Monoclonal
- Antigen
- Purifed from natural sources
- Description
- MA1-822 detects peroxisome proliferator activated receptors (PPAR) alpha from human, mouse, and rat tissues. MA1-822 has been successfully used in Western blot, Gel Shift and immunoprecipitation procedures. By Western blot, this antibody detects a ~52 kDa protein which corresponds to PPAR alpha from mouse adipose tissue extract. This antibody detects some non-specific bands on NIH-3T3 cell lysates. The MA1-822 immunogen is purified recombinant PPAR alpha protein.
- Reactivity
- Human, Mouse, Rat
- Host
- Mouse
- Isotype
- IgG
- Antibody clone number
- 3B6/PPAR
- Vial size
- 100 µg
- Concentration
- 1 mg/mL
- Storage
- -20° C, Avoid Freeze/Thaw Cycles
Submitted references Modulatory Effects of Estradiol and Its Mixtures with Ligands of GPER and PPAR on MAPK and PI3K/Akt Signaling Pathways and Tumorigenic Factors in Mouse Testis Explants and Mouse Tumor Leydig Cells.
Protective Effects of Bariatric Surgery on Kidney Functions by Inhibiting Oxidative Stress Responses Through Activating PPARα in Rats With Diabetes.
Noise-Induced Cochlear Damage Involves PPAR Down-Regulation through the Interplay between Oxidative Stress and Inflammation.
Fat tissue regulates the pathogenesis and severity of cardiomyopathy in murine chagas disease.
SIRT1 promotes lipid metabolism and mitochondrial biogenesis in adipocytes and coordinates adipogenesis by targeting key enzymatic pathways.
Towards understanding leydigioma: do G protein-coupled estrogen receptor and peroxisome proliferator-activated receptor regulate lipid metabolism and steroidogenesis in Leydig cell tumors?
PPARα exacerbates necroptosis, leading to increased mortality in postinfluenza bacterial superinfection.
Inhibition of SREBP Improves Cardiac Lipidopathy, Improves Endoplasmic Reticulum Stress, and Modulates Chronic Chagas Cardiomyopathy.
Coagulopathy in Malnourished Mice Is Sexually Dimorphic and Regulated by Nutrient-Sensing Nuclear Receptors.
Adipose Tissue Regulates Pulmonary Pathology during TB Infection.
Ameliorative effects of pepsin-digested chicken liver hydrolysates on development of alcoholic fatty livers in mice.
Expression of the cannabinoid system in muscle: effects of a high-fat diet and CB1 receptor blockade.
Selective reversible inhibition of liver carnitine palmitoyl-transferase 1 by teglicar reduces gluconeogenesis and improves glucose homeostasis.
A mutant thyroid hormone receptor alpha antagonizes peroxisome proliferator-activated receptor alpha signaling in vivo and impairs fatty acid oxidation.
Inhibition of matrix metalloproteinases increases PPAR-alpha and IL-6 and prevents dietary-induced hepatic steatosis and injury in a murine model.
Peroxisome proliferator-activated receptor alpha physically interacts with CCAAT/enhancer binding protein (C/EBPbeta) to inhibit C/EBPbeta-responsive alpha1-acid glycoprotein gene expression.
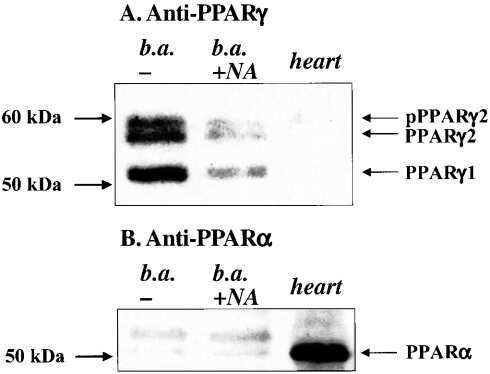
Noradrenaline represses PPAR (peroxisome-proliferator-activated receptor) gamma2 gene expression in brown adipocytes: intracellular signalling and effects on PPARgamma2 and PPARgamma1 protein levels.
Peroxisome proliferator-activated receptor alpha is downregulated in the failing human heart.
Evidence that peroxisome proliferator-activated receptor alpha is complexed with the 90-kDa heat shock protein and the hepatitis virus B X-associated protein 2.
Effect of stages of lactation on the concentration of a 90-kilodalton heat shock protein in bovine mammary tissue.
Gorowska-Wojtowicz E, Duliban M, Kotula-Balak M, Bilinska B
Biomedicines 2022 Jun 12;10(6)
Biomedicines 2022 Jun 12;10(6)
Protective Effects of Bariatric Surgery on Kidney Functions by Inhibiting Oxidative Stress Responses Through Activating PPARα in Rats With Diabetes.
Jiang HW, Zhou Y, Zhou PY, Zhang TY, Hu JY, Bai XT
Frontiers in physiology 2021;12:662666
Frontiers in physiology 2021;12:662666
Noise-Induced Cochlear Damage Involves PPAR Down-Regulation through the Interplay between Oxidative Stress and Inflammation.
Paciello F, Pisani A, Rolesi R, Escarrat V, Galli J, Paludetti G, Grassi C, Troiani D, Fetoni AR
Antioxidants (Basel, Switzerland) 2021 Jul 26;10(8)
Antioxidants (Basel, Switzerland) 2021 Jul 26;10(8)
Fat tissue regulates the pathogenesis and severity of cardiomyopathy in murine chagas disease.
Lizardo K, Ayyappan JP, Oswal N, Weiss LM, Scherer PE, Nagajyothi JF
PLoS neglected tropical diseases 2021 Apr;15(4):e0008964
PLoS neglected tropical diseases 2021 Apr;15(4):e0008964
SIRT1 promotes lipid metabolism and mitochondrial biogenesis in adipocytes and coordinates adipogenesis by targeting key enzymatic pathways.
Majeed Y, Halabi N, Madani AY, Engelke R, Bhagwat AM, Abdesselem H, Agha MV, Vakayil M, Courjaret R, Goswami N, Hamidane HB, Elrayess MA, Rafii A, Graumann J, Schmidt F, Mazloum NA
Scientific reports 2021 Apr 14;11(1):8177
Scientific reports 2021 Apr 14;11(1):8177
Towards understanding leydigioma: do G protein-coupled estrogen receptor and peroxisome proliferator-activated receptor regulate lipid metabolism and steroidogenesis in Leydig cell tumors?
Kotula-Balak M, Gorowska-Wojtowicz E, Milon A, Pawlicki P, Tworzydlo W, Płachno BJ, Krakowska I, Hejmej A, Wolski JK, Bilinska B
Protoplasma 2020 Jul;257(4):1149-1163
Protoplasma 2020 Jul;257(4):1149-1163
PPARα exacerbates necroptosis, leading to increased mortality in postinfluenza bacterial superinfection.
Tam VC, Suen R, Treuting PM, Armando A, Lucarelli R, Gorrochotegui-Escalante N, Diercks AH, Quehenberger O, Dennis EA, Aderem A, Gold ES
Proceedings of the National Academy of Sciences of the United States of America 2020 Jul 7;117(27):15789-15798
Proceedings of the National Academy of Sciences of the United States of America 2020 Jul 7;117(27):15789-15798
Inhibition of SREBP Improves Cardiac Lipidopathy, Improves Endoplasmic Reticulum Stress, and Modulates Chronic Chagas Cardiomyopathy.
Ayyappan JP, Lizardo K, Wang S, Yurkow E, Nagajyothi JF
Journal of the American Heart Association 2020 Feb 4;9(3):e014255
Journal of the American Heart Association 2020 Feb 4;9(3):e014255
Coagulopathy in Malnourished Mice Is Sexually Dimorphic and Regulated by Nutrient-Sensing Nuclear Receptors.
Preidis GA, Soni KG, Suh JH, Halder T, Kim KH, Choi JM, Li F, Devaraj S, Conner ME, Coarfa C, Jung SY, Moore DD
Hepatology communications 2020 Dec;4(12):1835-1850
Hepatology communications 2020 Dec;4(12):1835-1850
Adipose Tissue Regulates Pulmonary Pathology during TB Infection.
Ayyappan JP, Ganapathi U, Lizardo K, Vinnard C, Subbian S, Perlin DS, Nagajyothi JF
mBio 2019 Apr 16;10(2)
mBio 2019 Apr 16;10(2)
Ameliorative effects of pepsin-digested chicken liver hydrolysates on development of alcoholic fatty livers in mice.
Lin YL, Tai SY, Chen JW, Chou CH, Fu SG, Chen YC
Food & function 2017 May 24;8(5):1763-1774
Food & function 2017 May 24;8(5):1763-1774
Expression of the cannabinoid system in muscle: effects of a high-fat diet and CB1 receptor blockade.
Crespillo A, Suárez J, Bermúdez-Silva FJ, Rivera P, Vida M, Alonso M, Palomino A, Lucena MA, Serrano A, Pérez-Martín M, Macias M, Fernández-Llébrez P, Rodríguez de Fonseca F
The Biochemical journal 2011 Jan 1;433(1):175-85
The Biochemical journal 2011 Jan 1;433(1):175-85
Selective reversible inhibition of liver carnitine palmitoyl-transferase 1 by teglicar reduces gluconeogenesis and improves glucose homeostasis.
Conti R, Mannucci E, Pessotto P, Tassoni E, Carminati P, Giannessi F, Arduini A
Diabetes 2011 Feb;60(2):644-51
Diabetes 2011 Feb;60(2):644-51
A mutant thyroid hormone receptor alpha antagonizes peroxisome proliferator-activated receptor alpha signaling in vivo and impairs fatty acid oxidation.
Liu YY, Heymann RS, Moatamed F, Schultz JJ, Sobel D, Brent GA
Endocrinology 2007 Mar;148(3):1206-17
Endocrinology 2007 Mar;148(3):1206-17
Inhibition of matrix metalloproteinases increases PPAR-alpha and IL-6 and prevents dietary-induced hepatic steatosis and injury in a murine model.
Alwayn IP, Andersson C, Lee S, Arsenault DA, Bistrian BR, Gura KM, Nose V, Zauscher B, Moses M, Puder M
American journal of physiology. Gastrointestinal and liver physiology 2006 Dec;291(6):G1011-9
American journal of physiology. Gastrointestinal and liver physiology 2006 Dec;291(6):G1011-9
Peroxisome proliferator-activated receptor alpha physically interacts with CCAAT/enhancer binding protein (C/EBPbeta) to inhibit C/EBPbeta-responsive alpha1-acid glycoprotein gene expression.
Mouthiers A, Baillet A, Deloménie C, Porquet D, Mejdoubi-Charef N
Molecular endocrinology (Baltimore, Md.) 2005 May;19(5):1135-46
Molecular endocrinology (Baltimore, Md.) 2005 May;19(5):1135-46
Noradrenaline represses PPAR (peroxisome-proliferator-activated receptor) gamma2 gene expression in brown adipocytes: intracellular signalling and effects on PPARgamma2 and PPARgamma1 protein levels.
Lindgren EM, Nielsen R, Petrovic N, Jacobsson A, Mandrup S, Cannon B, Nedergaard J
The Biochemical journal 2004 Sep 1;382(Pt 2):597-606
The Biochemical journal 2004 Sep 1;382(Pt 2):597-606
Peroxisome proliferator-activated receptor alpha is downregulated in the failing human heart.
Karbowska J, Kochan Z, Smoleński RT
Cellular & molecular biology letters 2003;8(1):49-53
Cellular & molecular biology letters 2003;8(1):49-53
Evidence that peroxisome proliferator-activated receptor alpha is complexed with the 90-kDa heat shock protein and the hepatitis virus B X-associated protein 2.
Sumanasekera WK, Tien ES, Turpey R, Vanden Heuvel JP, Perdew GH
The Journal of biological chemistry 2003 Feb 14;278(7):4467-73
The Journal of biological chemistry 2003 Feb 14;278(7):4467-73
Effect of stages of lactation on the concentration of a 90-kilodalton heat shock protein in bovine mammary tissue.
Watanabe A, Miyamoto T, Katoh N, Takahashi Y
Journal of dairy science 1997 Oct;80(10):2372-9
Journal of dairy science 1997 Oct;80(10):2372-9
No comments: Submit comment
Supportive validation
- Submitted by
- Invitrogen Antibodies (provider)
- Main image

- Experimental details
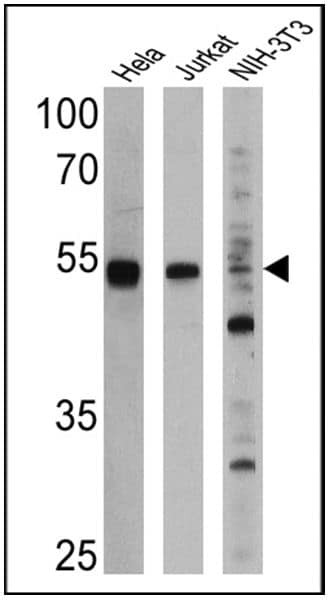
- Western blot analysis of PPAR alpha was performed by loading 25 µg of Hela (Lane 1), Jurkat (Lane 2), and NIH-3T3 cell lysates (Lane 3) and a molecular weight protein ladder onto an SDS polyacrylamide gel. Proteins were transferred to a PVDF membrane and blocked with a blocking buffer at 4ºC overnight. The membrane was probed with a PPAR alpha monoclonal antibody (Product # MA1-822) at a dilution of 1:1000 (Hela and Jurkat) and 1:500 (NIH-3T3) overnight at 4°C, washed in TBST, and probed with an HRP-conjugated secondary antibody for 1 hr at room temperature in the dark. Chemiluminescent detection was performed using Pierce ECL Plus Western Blotting Substrate (Product # 32132). Results show a band at 52 kDa in all three cell lines.
Supportive validation
- Submitted by
- Invitrogen Antibodies (provider)
- Main image

- Experimental details
- Immunofluorescence analysis of PPAR alpha was done on 70% confluent log phase HCT116 cells. The cells were fixed with 4% paraformaldehyde for 10 minutes, permeabilized with 0.1% Triton™ X-100 for 10 minutes, and blocked with 1% BSA for 1 hour at room temperature. The cells were labeled with PPAR alpha (3B6/PPAR) Mouse Monoclonal Antibody (Product # MA1-822) at 2 µg/mL in 0.1% BSA and incubated for 3 hours at room temperature and then labeled with Goat anti-Mouse IgG (H+L) Superclonal™ Secondary Antibody, Alexa Fluor® 488 conjugate (Product # A28175) at a dilution of 1:2000 for 45 minutes at room temperature (Panel a: green). Nuclei (Panel b: blue) were stained with SlowFade® Gold Antifade Mountant with DAPI (Product # S36938). F-actin (Panel c: red) was stained with Alexa Fluor® 555 Rhodamine Phalloidin (Product # R415, 1:300). Panel d is a merged image showing cytoplasmic and nuclear localization. Panel e is a no primary antibody control. The images were captured at 60X magnification.

Supportive validation
- Submitted by
- Invitrogen Antibodies (provider)
- Main image
- Experimental details
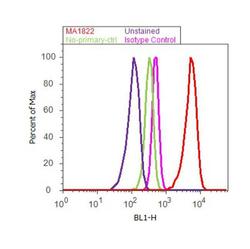
- Flow cytometry analysis of PPAR alpha was done on MCF7 cells. Cells were fixed with 70% ethanol for 10 minutes, permeabilized with 0.25% Triton™ X-100 for 20 minutes, and blocked with 5% BSA for 30 minutes at room temperature. Cells were labeled with PPAR alpha Mouse Monoclonal Antibody (MA1822, red histogram) or with mouse isotype control (pink histogram) at 3-5 ug/million cells in 2.5% BSA. After incubation at room temperature for 2 hours, the cells were labeled with Alexa Fluor® 488 Rabbit Anti-Mouse Secondary Antibody (A11059) at a dilution of 1:400 for 30 minutes at room temperature. The representative 10,000 cells were acquired and analyzed for each sample using an Attune® Acoustic Focusing Cytometer. The purple histogram represents unstained control cells and the green histogram represents no-primary-antibody control.

- Submitted by
- Invitrogen Antibodies (provider)
- Main image
- Experimental details
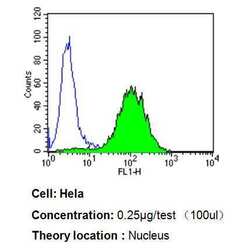
- Flow cytometry analysis of PPAR alpha in Hela cells compared to an isotype control (blue). Cells were harvested, adjusted to a concentration of 1-5x10^6 cells/mL, fixed with 2% paraformaldehyde, washed with PBS, and incubated with PPAR alpha monoclonal antibody (Product # MA1-822) at a dilution of 0.25 µg/test for 60 min at room temperature. Cells were then blocked in a solution of 2% BSA-PBS for 30 min at room temperature, incubated for 40 min at room temperature in the dark using a Dylight 488-conjugated goat anti-mouse IgG (H+L) secondary antibody, and re-suspended in PBS for FACS analysis.

- Submitted by
- Invitrogen Antibodies (provider)
- Main image

- Experimental details
- Flow cytometry analysis of PPAR alpha in Jurkat cells compared to an isotype control (blue). Cells were harvested, adjusted to a concentration of 1-5x10^6 cells/mL, fixed with 2% paraformaldehyde, washed with PBS, and incubated with PPAR alpha monoclonal antibody (Product # MA1-822) at a dilution of 0.25 µg/test for 60 min at room temperature. Cells were then blocked in a solution of 2% BSA-PBS for 30 min at room temperature, incubated for 40 min at room temperature in the dark using a Dylight 488-conjugated goat anti-mouse IgG (H+L) secondary antibody, and re-suspended in PBS for FACS analysis.

- Submitted by
- Invitrogen Antibodies (provider)
- Main image
- Experimental details
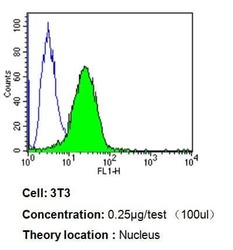
- Flow cytometry analysis of PPAR alpha in 3T3 cells compared to an isotype control (blue). Cells were harvested, adjusted to a concentration of 1-5x10^6 cells/mL, fixed with 2% paraformaldehyde, washed with PBS, and incubated with PPAR alpha monoclonal antibody (Product # MA1-822) at a dilution of 0.25 µg/test for 60 min at room temperature. Cells were then blocked in a solution of 2% BSA-PBS for 30 min at room temperature, incubated for 40 min at room temperature in the dark using a Dylight 488-conjugated goat anti-mouse IgG (H+L) secondary antibody, and re-suspended in PBS for FACS analysis.

Supportive validation
- Submitted by
- Invitrogen Antibodies (provider)
- Main image

- Experimental details
- NULL
- Submitted by
- Invitrogen Antibodies (provider)
- Main image

- Experimental details
- Figure 6 SIRT1-dependence of SREBF1c and PPARalpha signaling in 3T3-L1 adipocytes. ( a ) Quantitative analysis of the expression levels of SREBF1c and its downstream transcriptional targets in ShScrambled or SIRT1-depleted (ShSIRT1) adipocytes at Day 6 post-differentiation. ( b ) Quantitative analysis of the expression levels of PPARalpha and its downstream transcriptional targets in ShScrambled or SIRT1-depleted (ShSIRT1) adipocytes at Day 6 post-differentiation. Boxed region indicates the time-point at which PPARalpha protein levels were quantified. In ( a , b ), qPCR and western blot data were from 4 and 3 independent experiments, respectively. Statistical analysis of the dataset was performed using a Student''s t test (*P < 0.05; ****P < 0.0001; n.s. not significant).

- Submitted by
- Invitrogen Antibodies (provider)
- Main image

- Experimental details
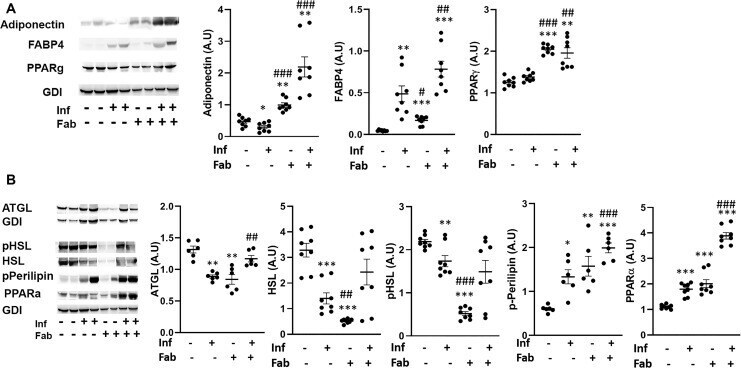
- Fig 4 T . cruzi infection and fat ablation alter adipogenesis and lipolysis in adipose tissue during chronic stage in the infected mice. A. Immunoblot analyses of (A) adipogenic markers (adiponectin, FABP4 and PPAR) and (B) lipid degradation markers such as lipases (ATGL, HSL and p-HSL), loss of lipid droplets (p-perilipin) and lipid oxidation (PPARalpha) in adipose tissue of indicated mice (infected or uninfected mice, fat-ablated (Fab +) or fat-unablated (Fab-) n = 8). The change in protein levels were normalized to the levels of Guanosine nucleotide dissociation inhibitor (GDI) and plotted column scatter graph. The error bars represent SEM. A.U. indicates arbitrary unit. *p
- Submitted by
- Invitrogen Antibodies (provider)
- Main image

- Experimental details
- Fig 6 Fat ablation increases adipogenic signaling and elevates lipid levels in the hearts during the early chronic stage in T . cruzi infected mice. Immunoblot analysis of (A) adipogenic markers (FABP4, PPARg and adiponectin), and (B) lipid metabolism (LDL and lipid metabolism markers (p-perilipin, PPARalpha, acyl-CoA ligase (ACSL) and acetyl Co-A carboxylase, CPT1, ABCA1 and CETP) in the hearts of indicated mice (infected or uninfected mice, fat-ablated (Fab +) or fat-unablated (Fab -) n = 8). The change in protein levels were normalized to the levels of Guanosine nucleotide dissociation inhibitor (GDI) and plotted column scatter graph. The error bars represent SEM. A.U. indicates arbitrary unit. *p

- Submitted by
- Invitrogen Antibodies (provider)
- Main image

- Experimental details
- Figure 4 Treatment with SREBP (sterol regulatory element-binding protein) inhibitor increases cardiac cholesterol efflux and reduces fatty acid synthesis in chronic Trypanosoma cruzi -infected mice. A , Immunoblot analysis of SREBP , LDL (low-density lipoprotein), FAS (fatty acid synthase), and acetyl CoA carboxylase proteins in the hearts of infected or uninfected mice treated or not with SREBP inhibitor at 120 days postinfection (DPI) . B , Bar graph showing fold changes in the protein levels of SREBP , LDL , FAS, and acetyl CoA carboxylase normalized to GDI expression. C , Immunoblot analysis of p erilipin, PPAR -alpha (peroxisome proliferator-activated receptor-alpha), and ABCA1 ( ATP -binding cassette transporter) proteins in the hearts of indicated mice at 120 DPI . D , Bar graph showing fold changes in the protein levels of perilipin, PPAR -alpha, and ABCA 1 normalized to GDI (guanosine nucleotide dissociation inhibitor) expression. The error bars represent SEM. A.U. indicates arbitrary unit; p-perilipin, phosphorylated perilipin. * P

- Submitted by
- Invitrogen Antibodies (provider)
- Main image

- Experimental details
- Figure 3 Noise exposure reduces PPARalpha and PPARgamma expression in the cochlea. ( A ): Western immunoblotting showing PPARalpha and PPARgamma reduction at 1, 3 and 7 days ( D ) after noise exposure. ( B , C ): Histograms show the decrease in PPARalpha/alpha-tubulin and PPARgamma/alpha-tubulin ratios after noise exposure (optical density, O.D.). Data are expressed as mean +- SEM from three independent experiments. Asterisks indicate significant differences between groups (* p < 0.05; ** p < 0.01). ( D - K ): Representative images of cochlear cryosections labeled for PPARalpha (green fluorescence, ( D - G )) and PPARgamma (red fluorescence, ( H - K )) and double-stained with DAPI in blue. Inserts in ( d1 - k3 ) indicate the distribution of fluorescence signal, analyzed in a pseudo-color rainbow scale for the principal cochlear structures. PPARalpha and PPARgamma fluorescence is marked in control samples and progressively decreases from day 1 to day 7 after noise exposure. StV: stria vascularis ; oC: organ of Corti; SGNs: spiral ganglion neurons. Scale bar: 100 muM.

- Submitted by
- Invitrogen Antibodies (provider)
- Main image

- Experimental details
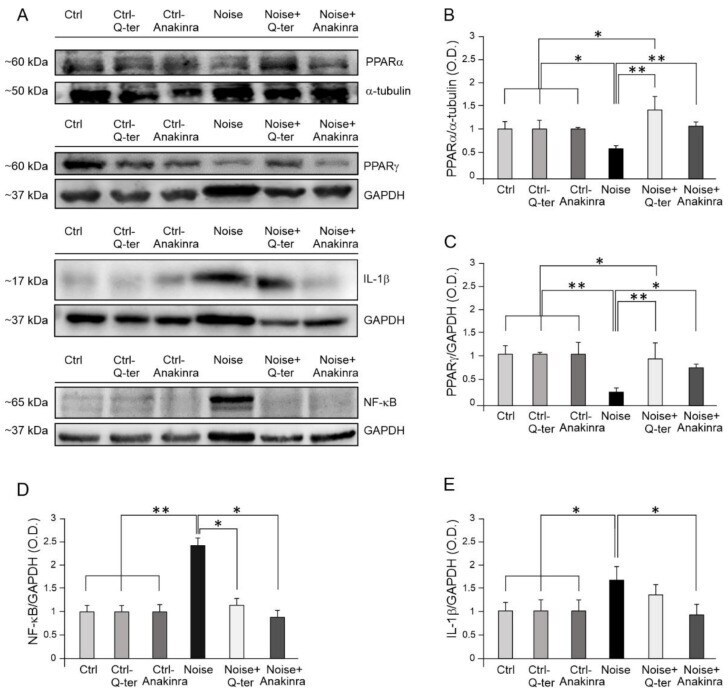
- Figure 6 Cochlear PPAR and inflammatory marker expression in Q-ter and Anakinra-treated samples. ( A ): Western immunoblotting showing cochlear expression of PPARalpha, PPARgamma, NF-kappaB and IL-1beta in animals exposed to noise and treated with Q-ter or Anakinra (day 7 after acoustic trauma). ( B - E ): Histograms showing densitometry evaluations (O.D., proteins/GAPDH ratios). Data are expressed as mean +- SEM from three independent experiments. Asterisks indicate significant differences between groups (* p < 0.05; ** p < 0.01).
- Submitted by
- Invitrogen Antibodies (provider)
- Main image

- Experimental details
- The effect of GPER agonist (ICI 182,780), GPER antagonist (G-15), PPARalpha antagonist (GW6471), PPARgamma antagonist (T00709072), and estradiol (E2) on GPER, PPARalpha, and PPARgamma protein expression levels in mouse testis explants ( A - D ). Representative blots of Western analysis ( A ) and relative expression of the proteins ( B - D ). Explants were harvested after 24 h. Untreated explants served as a control. Protein levels within control testis explants were given a value of 1. The cropped blots are displayed and the original blots are provided in Supplementary Materials (Figure S1) . The relative levels of the proteins were normalized to beta-actin which served as the internal protein loading control. The histograms are the quantitative representation of data (mean +- SD) of three independent experiments, each in triplicate ( B - D ). A plus sign (+) indicates the presence of the compound in the culture medium, a minus sign (-) indicates no compound in the culture medium. Asterisks indicate significant differences from control explants. Values are denoted as * p < 0.05, ** p < 0.01 and *** p < 0.001.

- Submitted by
- Invitrogen Antibodies (provider)
- Main image

- Experimental details
- 5 FIG. Malnutrition is associated with decreased FXR binding but not increased PPARalpha binding. (A) PPARalpha-ChIP-qPCR reveals no increased binding on the known PPARalpha targets Fgf21 , Acox1 , or Cyp4a14 nor on Fga or F11 , in mice fed the LPLFD (n = 3-4). This is in contrast to increased PPARalpha binding on all five genes in mice following a 24-hour fast (Supporting Fig. S6). (B) FXR-ChIP-qPCR reveals decreased binding on Fga and F11 in malnourished male but not female livers but no significant changes on the known FXR targets Abcb11 , Slc51b , and Nr0b2 (n = 3-4). Data are mean + SD. Student t test; ** P < 0.01 compared to control mice of the same sex.
