Antibody data
- Antibody Data
- Antigen structure
- References [5]
- Comments [0]
- Validations
- Western blot [1]
- Immunocytochemistry [1]
- Flow cytometry [1]
- Other assay [3]
Submit
Validation data
Reference
Comment
Report error
- Product number
- PA1-642 - Provider product page

- Provider
- Invitrogen Antibodies
- Product name
- Kinesin 5A Polyclonal Antibody
- Antibody type
- Polyclonal
- Antigen
- Synthetic peptide
- Description
- PA1-642 detects kinesin 5A from mouse, human, and bovine samples. This antibody is specific for kinesin 5A and does not detect other kinesin isotypes. PA1-642 has been successfully used in Western blot procedures. By Western blot, this antibody detects an ~110 kDa protein representing kinesin 5A from mouse neuronal cell lysate and human retinal extracts. The PA1-642 immunizing peptide corresponds to amino acid residues 1007-1027 from mouse kinesin 5A. This sequence is completely conserved in human. This peptide (Cat. # PEP-197) is available for use in neutralization and control experiments.
- Reactivity
- Human, Mouse, Bovine
- Host
- Rabbit
- Isotype
- IgG
- Vial size
- 100 µg
- Concentration
- 1 mg/mL
- Storage
- -20° C, Avoid Freeze/Thaw Cycles
Submitted references Truncated Tau Induces Mitochondrial Transport Failure Through the Impairment of TRAK2 Protein and Bioenergetics Decline in Neuronal Cells.
Disparate Regulatory Mechanisms Control Fat3 and P75NTR Protein Transport through a Conserved Kif5-Interaction Domain.
Neurochemical profile of dementia pugilistica.
APP anterograde transport requires Rab3A GTPase activity for assembly of the transport vesicle.
Conventional kinesin holoenzymes are composed of heavy and light chain homodimers.
Quintanilla RA, Tapia-Monsalves C, Vergara EH, Pérez MJ, Aranguiz A
Frontiers in cellular neuroscience 2020;14:175
Frontiers in cellular neuroscience 2020;14:175
Disparate Regulatory Mechanisms Control Fat3 and P75NTR Protein Transport through a Conserved Kif5-Interaction Domain.
Cheng H, Burroughs-Garcia J, Birkness JE, Trinidad JC, Deans MR
PloS one 2016;11(10):e0165519
PloS one 2016;11(10):e0165519
Neurochemical profile of dementia pugilistica.
Kokjohn TA, Maarouf CL, Daugs ID, Hunter JM, Whiteside CM, Malek-Ahmadi M, Rodriguez E, Kalback W, Jacobson SA, Sabbagh MN, Beach TG, Roher AE
Journal of neurotrauma 2013 Jun 1;30(11):981-97
Journal of neurotrauma 2013 Jun 1;30(11):981-97
APP anterograde transport requires Rab3A GTPase activity for assembly of the transport vesicle.
Szodorai A, Kuan YH, Hunzelmann S, Engel U, Sakane A, Sasaki T, Takai Y, Kirsch J, Müller U, Beyreuther K, Brady S, Morfini G, Kins S
The Journal of neuroscience : the official journal of the Society for Neuroscience 2009 Nov 18;29(46):14534-44
The Journal of neuroscience : the official journal of the Society for Neuroscience 2009 Nov 18;29(46):14534-44
Conventional kinesin holoenzymes are composed of heavy and light chain homodimers.
DeBoer SR, You Y, Szodorai A, Kaminska A, Pigino G, Nwabuisi E, Wang B, Estrada-Hernandez T, Kins S, Brady ST, Morfini G
Biochemistry 2008 Apr 15;47(15):4535-43
Biochemistry 2008 Apr 15;47(15):4535-43
No comments: Submit comment
Supportive validation
- Submitted by
- Invitrogen Antibodies (provider)
- Main image

- Experimental details
- Western blot analysis was performed on whole cell extracts (30 µg lysate) of U-87 MG (Lane 1), HT-29 (Lane 2) and C2C12 (lane 3). The blots were probed with Anti-Kinesin 5A Rabbit Polyclonal Antibody (Product # PA1-642, 0.5-2 µg/mL) and detected by chemiluminescence using Goat anti-Rabbit IgG (H+L) Superclonal™ Secondary Antibody, HRP conjugate (Product # A27036, 0.4 µg/mL, 1:2500 dilution). A 117 kDa corresponding to Kinesin 5A was observed across cell lines tested. Known quantity of protein samples were electrophoresed using Novex® NuPAGE® 10 % Bis-Tris gel (Product # NP0302BOX), XCell SureLock™ Electrophoresis System (Product # EI0002) and Novex® Sharp Pre-Stained Protein Standard (Product # LC5800). Resolved proteins were then transferred onto a nitrocellulose membrane with iBlot® 2 Dry Blotting System (Product # IB21001). The membrane was probed with the relevant primary and secondary Antibody following blocking with 5 % skimmed milk. Chemiluminescent detection was performed using Pierce™ ECL Western Blotting Substrate (Product # 32106).
Supportive validation
- Submitted by
- Invitrogen Antibodies (provider)
- Main image
- Experimental details
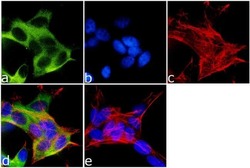
- Immunofluorescence analysis of Kinesin 5A was done on 70% confluent log phase SH-SY5Y cells. The cells were fixed with 4% paraformaldehyde for 15 minutes, permeabilized with 0.25% Triton™ X-100 for 10 minutes, and blocked with 5% BSA for 1 hour at room temperature. The cells were labeled with Kinesin 5A Rabbit Polyclonal Antibody (Product # PA1-642) at 1 µg/mL in 1% BSA and incubated for 3 hours at room temperature and then labeled with Goat anti-Rabbit IgG (H+L) Superclonal™ Secondary Antibody, Alexa Fluor® 488 conjugate (Product # A27034) at a dilution of 1:2000 for 45 minutes at room temperature (Panel a: green). Nuclei (Panel b: blue) were stained with SlowFade® Gold Antifade Mountant with DAPI (Product # S36938). F-actin (Panel c: red) was stained with Alexa Fluor® 555 Rhodamine Phalloidin (Product # R415, 1:300). Panel d is a merged image showing cytoplasmic localization. Panel e is a no primary antibody control. The images were captured at 60X magnification.
Supportive validation
- Submitted by
- Invitrogen Antibodies (provider)
- Main image
- Experimental details
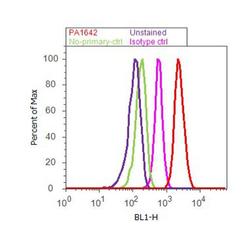
- Flow cytometry analysis of Kinesin 5A was done on SH-SY5Y cells. Cells were fixed with 70% ethanol for 10 minutes, permeabilized with 0.25% Triton™ X-100 for 20 minutes, and blocked with 5% BSA for 30 minutes at room temperature. Cells were labeled with Kinesin 5A Rabbit Polyclonal Antibody (PA1642, red histogram) or with rabbit isotype control (pink histogram) at 3-5 ug/million cells in 2.5% BSA. After incubation at room temperature for 2 hours, the cells were labeled with Alexa Fluor® 488 Goat Anti-Rabbit Secondary Antibody (A11008) at a dilution of 1:400 for 30 minutes at room temperature. The representative 10,000 cells were acquired and analyzed for each sample using an Attune® Acoustic Focusing Cytometer. The purple histogram represents unstained control cells and the green histogram represents no-primary-antibody control.
Supportive validation
- Submitted by
- Invitrogen Antibodies (provider)
- Main image
- Experimental details
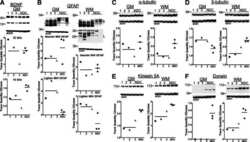
- NULL
- Submitted by
- Invitrogen Antibodies (provider)
- Main image
- Experimental details
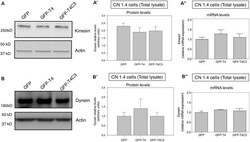
- Figure 3 Effects of caspase-cleaved tau on kinesin 1 and dynein expression in immortalized cortical neurons. Panels (A,B) show representative western blot images of CN 1.4 cells transfected with GFP, GFP-T4 (normal tau), and GFP-T4C3 (truncated tau) showing the relative kinesin 1 (KIF5) or dynein expression levels. Also, Panels (A',B') show a quantitative analysis of the relative expression levels of kinesin 1 (A') and dynein (B') in immortalized cells transfected with GFP and GFP-tau (s) forms. Data are mean +- SE, n = 3. Total RNA was extracted from immortalized cortical neurons transfected with GFP, GFP-T4 (full-length tau), and GFP-T4C3 (truncated tau), and mRNA expression levels of kinesin (A'') and dynein (B'') were measured by RT-PCR (Jara et al., ). Data represent mean +- SE, n = 4.
- Submitted by
- Invitrogen Antibodies (provider)
- Main image
- Experimental details
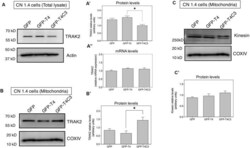
- Figure 6 Truncated tau reduces TRAK2 expression and increases its association with mitochondrial fraction in immortalized cortical neurons. (A) Representative western blot images of CN 1.4 cells transfected with GFP, GFP-T4 (normal tau), and GFP-T4C3 (truncated tau) indicating the relative TRAK2 expression levels. Caspase-cleaved tau decreases TRAK2 expression compared with cells that were expressing GFP or GFP-T4 (normal tau). (A') Quantitative analysis of the relative expression levels of TRAK2 in immortalized neurons transfected with indicated conditions. Data are mean +- SE, n = 5. * p < 0.05 indicates differences between groups calculated by ANOVA test. (A'') Total RNA was extracted from immortalized cortical neurons transfected with GFP, GFP-T4 (full-length tau), and GFP-T4C3 (truncated tau) and mRNA expression levels of TRAK2 were measured by RT-PCR. Data represent mean +- SE, n = 3. (B) Representative western blot images of CN 1.4 cells for mitochondrial extracts transfected with the conditions indicated. (B') Quantitative graph showing that caspase-cleaved tau expression increases TRAK2 presence in mitochondrial extracts compared with cells transfected with the full-length tau form (GFP-T4). Data are mean +- SE, n = 4. * p < 0.05 indicates differences between groups calculated by ANOVA test. (C) Representative western blot images and quantitative analysis (C') of kinesin 1 protein levels in mitochondrial extracts of CN 1.4 cells transfected with the conditions indica
 Explore
 Validate
 Learn
Learn Western blot