 Explore
 Validate
 Learn
Learn Flow cytometry
Antibody data
- Antibody Data
- Antigen structure
- References [12]
- Comments [0]
- Validations
- Flow cytometry [1]
- Other assay [9]
Submit
Validation data
Reference
Comment
Report error
- Product number
- 25-7049-82 - Provider product page

- Provider
- Invitrogen Antibodies
- Product name
- IL-4 Monoclonal Antibody (8D4-8), PE-Cyanine7, eBioscience™
- Antibody type
- Monoclonal
- Antigen
- Other
- Description
- Description: The 8D4-8 antibody reacts with human interleukin-4 (IL-4), a 15-19 kDa cytokine secreted by Th2 cells. Applications Reported:The 8D4-8 antibody has been reported for use as a capture antibody for human IL-4 ELISA and for intracellular staining for flow cytometric analysis. Applications Tested: Has been tested by intracellular flow cytometric analysis of stimulated normal human peripheral blood cells. This can be used at less than or equal to 0.25 µg per test. A test is defined as the amount (µg) of antibody that will stain a cell sample in a final volume of 100 µL. Cell number should be determined empirically but can range from 10^5 to 10^8 cells/test. It is recommended that the antibody be carefully titrated for optimal performance in the assay of interest. Light sensitivity: This tandem dye is sensitive photo-induced oxidation. Please protect this vial and stained samples from light. Fixation: Samples can be stored in IC Fixation Buffer (Product # 00-8222-49) (100 µL cell sample + 100 µL IC Fixation Buffer) or 1-step Fix/Lyse Solution (Product # 00-5333-57) for up to 3 days in the dark at 4°C with minimal impact on brightness and FRET efficiency/compensation. Some generalizations regarding fluorophore performance after fixation can be made, but clone specific performance should be determined empirically. Excitation: 488-561 nm; Emission: 775 nm; Laser: Blue Laser, Green Laser, Yellow-Green Laser. Filtration: 0.2 µm post-manufacturing filtered.
- Reactivity
- Human
- Host
- Mouse
- Isotype
- IgG
- Antibody clone number
- 8D4-8
- Vial size
- 100 µg
- Concentration
- 0.2 mg/mL
- Storage
- 4° C, store in dark, DO NOT FREEZE!
Submitted references Cord Blood T Cells Expressing High and Low PKCζ Levels Develop into Cells with a Propensity to Display Th1 and Th9 Cytokine Profiles, Respectively.
A multiclade env-gag VLP mRNA vaccine elicits tier-2 HIV-1-neutralizing antibodies and reduces the risk of heterologous SHIV infection in macaques.
Th2 Biased Immunity With Altered B Cell Profiles in Circulation of Patients With Sporotrichosis Caused by Sporothrix globosa.
Platelet-Derived GARP Induces Peripheral Regulatory T Cells-Potential Impact on T Cell Suppression in Patients with Melanoma-Associated Thrombocytosis.
CD4 T cell loss and Th2 and Th17 bias are associated with the severity of severe fever with thrombocytopenia syndrome (SFTS).
Imbalance between subsets of CD8(+) peripheral blood T cells in patients with chronic obstructive pulmonary disease.
Altered expression and editing of miRNA-100 regulates iTreg differentiation.
A SnoRNA-derived piRNA interacts with human interleukin-4 pre-mRNA and induces its decay in nuclear exosomes.
Regulatory T cells produce profibrotic cytokines in the skin of patients with systemic sclerosis.
Galectin-9 activates and expands human T-helper 1 cells.
Natural and inducible TH17 cells are regulated differently by Akt and mTOR pathways.
Programmed death-1+ T cells and regulatory T cells are enriched in tumor-involved lymph nodes and associated with aggressive features in papillary thyroid cancer.
Perveen K, Quach A, McPhee A, Prescott SL, Barry SC, Hii CS, Ferrante A
International journal of molecular sciences 2021 May 5;22(9)
International journal of molecular sciences 2021 May 5;22(9)
A multiclade env-gag VLP mRNA vaccine elicits tier-2 HIV-1-neutralizing antibodies and reduces the risk of heterologous SHIV infection in macaques.
Zhang P, Narayanan E, Liu Q, Tsybovsky Y, Boswell K, Ding S, Hu Z, Follmann D, Lin Y, Miao H, Schmeisser H, Rogers D, Falcone S, Elbashir SM, Presnyak V, Bahl K, Prabhakaran M, Chen X, Sarfo EK, Ambrozak DR, Gautam R, Martin MA, Swerczek J, Herbert R, Weiss D, Misamore J, Ciaramella G, Himansu S, Stewart-Jones G, McDermott A, Koup RA, Mascola JR, Finzi A, Carfi A, Fauci AS, Lusso P
Nature medicine 2021 Dec;27(12):2234-2245
Nature medicine 2021 Dec;27(12):2234-2245
Th2 Biased Immunity With Altered B Cell Profiles in Circulation of Patients With Sporotrichosis Caused by Sporothrix globosa.
Zu J, Yao L, Song Y, Cui Y, Guan M, Chen R, Zhen Y, Li S
Frontiers in immunology 2020;11:570888
Frontiers in immunology 2020;11:570888
Platelet-Derived GARP Induces Peripheral Regulatory T Cells-Potential Impact on T Cell Suppression in Patients with Melanoma-Associated Thrombocytosis.
Zimmer N, Krebs FK, Zimmer S, Mitzel-Rink H, Kumm EJ, Jurk K, Grabbe S, Loquai C, Tuettenberg A
Cancers 2020 Dec 5;12(12)
Cancers 2020 Dec 5;12(12)
CD4 T cell loss and Th2 and Th17 bias are associated with the severity of severe fever with thrombocytopenia syndrome (SFTS).
Li MM, Zhang WJ, Weng XF, Li MY, Liu J, Xiong Y, Xiong SE, Zou CC, Wang H, Lu MJ, Yang DL, Peng C, Zheng X
Clinical immunology (Orlando, Fla.) 2018 Oct;195:8-17
Clinical immunology (Orlando, Fla.) 2018 Oct;195:8-17
Imbalance between subsets of CD8(+) peripheral blood T cells in patients with chronic obstructive pulmonary disease.
Chen L, Chen G, Zhang MQ, Xiong XZ, Liu HJ, Xin JB, Zhang JC, Wu JH, Meng ZJ, Sun SW
PeerJ 2016;4:e2301
PeerJ 2016;4:e2301
Altered expression and editing of miRNA-100 regulates iTreg differentiation.
Negi V, Paul D, Das S, Bajpai P, Singh S, Mukhopadhyay A, Agrawal A, Ghosh B
Nucleic acids research 2015 Sep 18;43(16):8057-65
Nucleic acids research 2015 Sep 18;43(16):8057-65
A SnoRNA-derived piRNA interacts with human interleukin-4 pre-mRNA and induces its decay in nuclear exosomes.
Zhong F, Zhou N, Wu K, Guo Y, Tan W, Zhang H, Zhang X, Geng G, Pan T, Luo H, Zhang Y, Xu Z, Liu J, Liu B, Gao W, Liu C, Ren L, Li J, Zhou J, Zhang H
Nucleic acids research 2015 Dec 2;43(21):10474-91
Nucleic acids research 2015 Dec 2;43(21):10474-91
Regulatory T cells produce profibrotic cytokines in the skin of patients with systemic sclerosis.
MacDonald KG, Dawson NAJ, Huang Q, Dunne JV, Levings MK, Broady R
The Journal of allergy and clinical immunology 2015 Apr;135(4):946-955.e9
The Journal of allergy and clinical immunology 2015 Apr;135(4):946-955.e9
Galectin-9 activates and expands human T-helper 1 cells.
Gooden MJ, Wiersma VR, Samplonius DF, Gerssen J, van Ginkel RJ, Nijman HW, Hirashima M, Niki T, Eggleton P, Helfrich W, Bremer E
PloS one 2013;8(5):e65616
PloS one 2013;8(5):e65616
Natural and inducible TH17 cells are regulated differently by Akt and mTOR pathways.
Kim JS, Sklarz T, Banks LB, Gohil M, Waickman AT, Skuli N, Krock BL, Luo CT, Hu W, Pollizzi KN, Li MO, Rathmell JC, Birnbaum MJ, Powell JD, Jordan MS, Koretzky GA
Nature immunology 2013 Jun;14(6):611-8
Nature immunology 2013 Jun;14(6):611-8
Programmed death-1+ T cells and regulatory T cells are enriched in tumor-involved lymph nodes and associated with aggressive features in papillary thyroid cancer.
French JD, Kotnis GR, Said S, Raeburn CD, McIntyre RC Jr, Klopper JP, Haugen BR
The Journal of clinical endocrinology and metabolism 2012 Jun;97(6):E934-43
The Journal of clinical endocrinology and metabolism 2012 Jun;97(6):E934-43
No comments: Submit comment
Supportive validation
- Submitted by
- Invitrogen Antibodies (provider)
- Main image

- Experimental details
- Surface staining of normal human peripheral blood cells stimulated with PMA/Ionomycin in the presence of Brefeldin A with Anti-Human CD4 FITC (Product # 11-0048-42), followed by intracellular staining with Mouse IgG1 K Isotype Control PE-Cyanine7 (Product # 25-4714-80) (left) or Anti-Human IL-4 PE-Cyanine7 (right).

Supportive validation
- Submitted by
- Invitrogen Antibodies (provider)
- Main image
- Experimental details
- NULL

- Submitted by
- Invitrogen Antibodies (provider)
- Main image

- Experimental details
- Figure 6. piR30840 regulates the development of Th2 lymphocytes. ( A and B ) Human CD4 naive cells were cultured in a conditioned medium for Th2 development and then transfected with an s30840 (A) or piR30840 inhibitor (B). IL-4 expression was detected by qRT-PCR and western blotting analyses. P < 0.01. The data represents three independent experiments. ( C ) Detection of IL-4 expression in human PBMCs isolated from humanized NOG mice. IL-4 expression was detected by qRT-PCR analysis. The data was expressed as the mean of three independent experiments. Wilcoxon test was used to calculate the P -value. P < 0.05. ( D ) CD4 naive cells were cultured in the conditioned medium for Th2 development and transfected with s30840 or control. After 7 days, the Th2 T-lymphocytes (intracellular stained as IL-4 + IFN-gamma - ) were detected with FACS analysis. The data was shown as a mean of six independent experiments. P < 0.01. ( E ) The CD4 naive cells were cultured in a conditioned medium for Th2 development with or without the transfection of inhibitor. We adoptively transferred the naive cells into the irradiated NOG mice which were first humanized. After 7 days, Th2 T-lymphocytes (intracellularly stained as IL-4 + IFNgamma - ) were detected by using FACS analysis. The data were expressed as the mean of six independent experiments. Statistical significance between two samples was determined by using the student's t -test. P < 0.01.

- Submitted by
- Invitrogen Antibodies (provider)
- Main image

- Experimental details
- Figure 5 Blockade of transforming growth factor (TGF)-beta I-III did in part prevent regulatory T cells (Treg) induction. ( A ) CFSE-labeled CD4 + CD25 - T cells were cocultured with platelets in the ratio of 1:50 and were stimulated with anti-CD3 mAb (0.5 ug/mL) and anti-CD28 mAb (1.0 ug/mL) in the presence of either anti-TGF-beta I-III (10 ug/mL) or anti-TGF-beta receptor II (10 ug/mL) antibodies. Antibodies were added at day 0. The expression of Foxp3 and GARP and cell proliferation were determined on day 3 via flow cytometry. ( B ) Production of IL-2 and IFN-gamma was assessed by intracellular flow cytometry on day 6. The graphs show cells cultured in the presence of platelets normalized to CD4 + CD25 - T cells without platelets. Dot plots show one representative result of 10 independent experiments ( n = 10, box and whiskers, medians +- min/max, * p < 0.05, ** p

- Submitted by
- Invitrogen Antibodies (provider)
- Main image

- Experimental details
- Figure 6 Combining blockade of TGF-beta signaling and GARP led to a complete inhibition of platelet effects. ( A ) CFSE-labeled CD4 + CD25 - T cells were cocultured with platelets in the ratio of 1:50 and were stimulated with anti-CD3 mAb (0.5 ug/mL) and anti-CD28 mAb (1.0 ug/mL). CD4 + CD25 - T cells were incubated for 15 min with TGF-beta receptor II (10 ug/mL) antibody prior to coculture, as indicated. Excess antibody was removed. Pre-treated CD4 + CD25 - T cells were cultured in the presence of either anti-TGF-beta I-III (10 ug/mL) and/or anti-GARP Ab (10 ug/mL) antibodies. Antibodies were added at day 0. The expression of Foxp3, GARP and cell proliferation were determined on day 3 via flow cytometry. ( B ) Production of IL-2 and IFN-gamma was assessed by intracellular flow cytometry on day 6. The graphs show cells cultured in the presence of platelets normalized to CD4 + CD25 - T cells without platelets. Dot plots show 1 representative result of 10 independent experiments ( n = 3, means +- SD, * p < 0.05, ** p

- Submitted by
- Invitrogen Antibodies (provider)
- Main image

- Experimental details
- Figure 7 Platelet-conditioned medium (PCM) inhibited IFN-gamma production, but failed to induce a Treg phenotype. ( A ) CD4 + CD25 - T cells were cultured in X-Vivo 15 (Lonza, Basel, Switzerland) with 60% PCM content, with or without 10 ug/mL anti-GARP Ab and stimulated with 0.5 ug/mL anti-CD3 mAb and 1.0 ug/mL anti-CD28 mAb. Antibodies were added at day 0. The expression of Foxp3, GARP and cell proliferation were determined at day 3 with flow cytometry. ( B ) Cytokine production of IL-2 and IFN-gamma was measured by intracellular flow cytometry on day 6. Dot plots show one representative result of five independent experiments ( n = 5, box and whiskers, medians +- min/max, * p < 0.05, ** p

- Submitted by
- Invitrogen Antibodies (provider)
- Main image

- Experimental details
- Figure A4 Thrombin-activated platelets induced a regulatory phenotype in CD4 + CD25 - T cells. 1 x 10 6 CD4 + CD25 - T cells were stimulated with 0.5 ug/mL anti-CD3 mAb and 1.0 ug/mL anti-CD28 mAb with or without 50 x 10 6 platelets for 6 days and treated with or without 10 U/mL thrombin. ( A ) Foxp3 and GARP expression and proliferation were determined at day 3 via flow cytometry. ( B ) Using intracellular flow cytometry, we analyzed cytokine production of IL-2 and IFN-gamma on day 6. Dot plots show one representative result of five independent experiments ( n = 5, box and whiskers, medians +- min/max, * p < 0.05, ** p

- Submitted by
- Invitrogen Antibodies (provider)
- Main image

- Experimental details
- Figure A5 TRAP-6-activated platelets induced a regulatory phenotype in CD4 + CD25 - T cells. 1 x 10 6 CD4 + CD25 - T cells were stimulated with 0.5 ug/mL anti-CD3 mAb and 1.0 ug/mL anti-CD28 mAb with or without 50 x 10 6 platelets for 6 days and treated with or without 5 uM TRAP-6. ( A ) Foxp3 and GARP expression and proliferation were determined at day 3 via flow cytometry. ( B ) Using intracellular flow cytometry, we analyzed cytokine production of IL-2 and IFN-gamma on day 6. Dot plots show one representative result of five independent experiments ( n = 5, box and whiskers, medians +- min/max, * p < 0.05, ** p

- Submitted by
- Invitrogen Antibodies (provider)
- Main image

- Experimental details
- Figure 1 Comparison of proliferation and cytokine production in naive cord blood T cells (CBTC) in Protein Kinase C zeta (PKCzeta) low or high group. ( a ) Comparison of PKCzeta between cord blood (CB) and adult blood (AB) T cells, n = 24 for each AB or CB. ( b ) Shows lymphoproliferation as a Stimulation index (SI) and disintegrations per minute (DPM) in 3 H-thymidine pulsed cultures stimulated with Phytohaemagglutinin (PHA) and Phorbol myristate acetate (PMA) ( c ) Purified CBCTs were stained with Carboxyfluorescein succinimidyl ester (CFSE) dye and stimulated with immobilized anti-CD3/-CD28 antibodies for 3 days. Gating and representative histogram for CFSE dilution after exclusion of doublets and dead cells. Overlaid histograms for stained unstimulated and unstained stimulated samples were used as control and for gating the non-proliferating cells and for auto-fluorescence, respectively. ( d ) Naive CB CD3 + T cells were stimulated with PHA/PMA (18 h) and percentage of CD3 + T cells producing interleukin-4 (IL-4) and Interferon-gamma (IFN-gamma) and median fluorescent intensity (MFI) were examined by flow cytometry assays. ( e ) On day 5 of CFSE stained culture (anti-CD3/-CD28), cells were re-stimulated with PHA/PMA (18 h) for detection of intracellular cytokine. Representative flow dot plots and data for CFSE dye dilution and IFN-gamma producing cells in high and low PKCzeta group. Data mean +- SD of n = 3 for of low and n = 4 high PKCzeta group. ** p < 0.01. ns: not sig

- Submitted by
- Invitrogen Antibodies (provider)
- Main image

- Experimental details
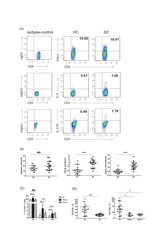
- Fig. 3 Changes in the percentages and absolute numbers of Th1 and Th2 cells in SFTS patients. (A): Th1 cells (CD4 + IFN-gamma+) and Th2 cells (CD4 + IL-4+) by flow cytometry in the healthy controls, surviving SFTS patients, and deceased SFTS patients, as defined by flow cytometry. The cells were gated on the CD3 + CD4+ population within the single-cell lymphocyte gate. (B), (D): The percentages and numbers of Th1 and Th2 cells in the healthy controls (n = 11) and the surviving patients with SFTS in the acute phase (n = 30) and SFTS in the recovery phase (n = 30). (C), (E): The percentages and numbers of Th1 and Th2 cells at admission in the surviving patients (n = 30) and the deceased patients (n = 12). (F), (G): Dynamic changes in the percentages and numbers of Th1 and Th2 cells in the surviving patients (n = 30) and the deceased patients (n = 12). These parameters were monitored at indicated time points for the entire hospital stay of the patients, and the dashed line represents the median of the uninfected controls. The data are shown as the median +- 95% CI. Statistical analysis was performed using the Mann-Whitney U test or the Wilcoxon matched pair test. The level of significance is indicated as follows: ns, not significant; *p < .05; **p < .01; ***p < .001; ****p < .0001; Fig. 3
