Explore
 Validate
 Learn
Learn Western blot
 Immunocytochemistry
Antibody data
- Antibody Data
- Antigen structure
- References [0]
- Comments [0]
- Validations
- Immunocytochemistry [2]
- Immunohistochemistry [7]
- Other assay [14]
Submit
Validation data
Reference
Comment
Report error
- Product number
- 53-9003-82 - Provider product page

- Provider
- Invitrogen Antibodies
- Product name
- Pan Cytokeratin Monoclonal Antibody (AE1/AE3), Alexa Fluor™ 488, eBioscience™
- Antibody type
- Monoclonal
- Antigen
- Other
- Description
- Description: The monoclonal antibodies AE1 and AE3 recognize many of the acidic and basic cytokeratin family members. Cytokeratins are intermediate filament proteins comprising one component of the cytoskeleton. There are two large families of cytokeratins, acidic and basic, but all contain the same basic domains (i.e. an alpha-helical core with an N- and C-terminal domain). The proteins are expressed in epithelial cells, but are developmentally regulated. Many tumors also express these proteins and their expression can help identify the origin of a neoplasm. The AE3 monoclonal antibody recognizes the 65 to 67 triplet, 64, 59, 58, 56, 54 and 52kD proteins also known as cytokeratin 1, 2, 3, 4, 5, 6, 7, and 8 while the AE1 antibody recognizes 56.5, 54', 50, 50', 48, and 40 kDa proteins (also known as CK10, 14, 15, 16 and 19). These antibodies can be used on a wide array of tissue samples from mouse, human, rat, primates (cynomolgus and rhesus), dog, cat, rabbit, and chicken. Applications Reported: This AE1/AE3 antibody has been reported for use in immunohistochemical staining, immunocytochemistry, immunohistochemical staining of frozen tissue sections, and immunohistochemical staining of formalin-fixed paraffin embedded tissue sections. Applications Tested: This AE1/AE3 antibody has been tested by immunofluorescent staining of formaldehyde-fixed and permeabilized or methanol-fixed MCF7 cells and can be used at less than or equal to 1 µg/mL. It is recommended that the antibody be carefully titrated for optimal performance in the assay of interest. Excitation: 488 nm; Emission: 519 nm; Laser: Blue Laser. Filtration: 0.2 µm post-manufacturing filtered.
- Reactivity
- Human, Mouse, Canine, Rabbit
- Host
- Mouse
- Conjugate
- Green dye
- Isotype
- IgG
- Antibody clone number
- AE1/AE3
- Vial size
- 100 μg
- Concentration
- 0.5 mg/mL
- Storage
- 4°C, store in dark, DO NOT FREEZE!
No comments: Submit comment
Supportive validation
- Submitted by
- Invitrogen Antibodies (provider)
- Main image

- Experimental details
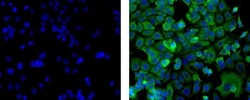
- Immunocytochemistry of fixed and permeabilized MCF-7 cells using 1 µg/mL of Mouse IgG1 K Isotype Control Alexa Fluor® 488 (left) or 1 µg/mL of Anti-Pan Cytokeratin (AE1/AE3) Alexa Fluor® 488 (right). Nuclei are stained with DAPI.
- Conjugate
- Green dye

- Submitted by
- Invitrogen Antibodies (provider)
- Main image
- Experimental details
- Immunocytochemistry of fixed and permeabilized MCF-7 cells using 1 µg/mL of Mouse IgG1 K Isotype Control Alexa Fluor® 488 (left) or 1 µg/mL of Anti-Pan Cytokeratin (AE1/AE3) Alexa Fluor® 488 (right). Nuclei are stained with DAPI.

Supportive validation
- Submitted by
- Invitrogen Antibodies (provider)
- Main image
- Experimental details
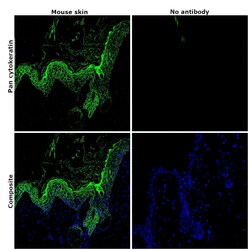
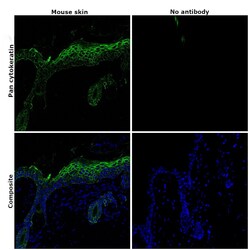
- Immunohistochemical analysis of pan Cytokeratin was performed using formalin-fixed paraffin-embedded mouse skin tissue sections. To expose the target protein, heat-induced epitope retrieval was performed on de-paraffinized sections using eBioscience™ IHC Antigen Retrieval Solution - Low pH (10X) (Product # 00-4955-58) diluted to 1X solution in water in a microwave oven at 110 degree Celsius for 10 minutes. Following antigen retrieval, the sections were blocked with 2% normal goat serum in 1X PBS for 45 minutes at room temperature and then probed with or without Pan Cytokeratin Monoclonal Antibody (AE1/AE3), Alexa Fluor 488, eBioscience™ (Product # 53-9003-82) at 1:100 dilution in 0.1% normal goat serum overnight at 4 degree Celsius in a humidified chamber. ReadyProbes™ Tissue Autofluorescence Quenching Kit (Product # R37630) was used to quench autofluorescence from the tissues. Nuclei were stained with DAPI (Product # D1306) and the sections were mounted using ProLong™ Glass Antifade Mountant (Product # P36984). The images were captured on EVOS™ M7000 Imaging System (Product # AMF7000) at 20X magnification and externally deconvoluted.

- Submitted by
- Invitrogen Antibodies (provider)
- Main image
- Experimental details
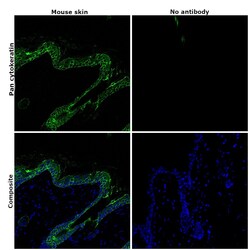
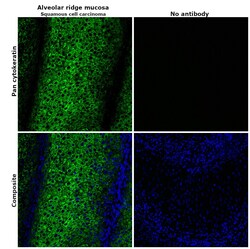
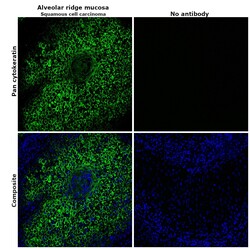
- Immunohistochemical analysis of pan cytokeratin was performed using formalin-fixed paraffin-embedded alveolar ridge mucosa (squamous cell carcinoma) tissue sections. To expose the target protein, heat-induced epitope retrieval was performed on de-paraffinized sections using eBioscience™ IHC Antigen Retrieval Solution - High pH (10X) (Product # 00-4956-58) diluted to 1X solution in water in a decloaking chamber at 110 degree Celsius for 15 minutes. Following antigen retrieval, the sections were blocked with 2% normal goat serum in 1X PBS for 45 minutes at room temperature and then probed with or without Pan Cytokeratin Monoclonal Antibody (AE1/AE3), Alexa Fluor 488, eBioscience™ (Product # 53-9003-82) at 1:100 dilution in 0.1% normal goat serum overnight at 4 degree Celsius in a humidified chamber. ReadyProbes™ Tissue Autofluorescence Quenching Kit (Product # R37630) was used to quench autofluorescence from the tissues. Nuclei were stained with DAPI (Product # D1306) and the sections were mounted using ProLong™ Glass Antifade Mountant (Product # P36984). The images were captured on EVOS™ M7000 Imaging System (Product # AMF7000) at 20X magnification and deconvoluted externally.

- Submitted by
- Invitrogen Antibodies (provider)
- Main image
- Experimental details
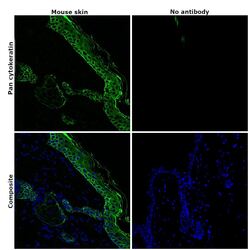
- Immunohistochemical analysis of pan Cytokeratin was performed using formalin-fixed paraffin-embedded mouse skin tissue sections. To expose the target protein, heat-induced epitope retrieval was performed on de-paraffinized sections using eBioscience™ IHC Antigen Retrieval Solution - Low pH (10X) (Product # 00-4955-58) diluted to 1X solution in water in a microwave oven at 110 degree Celsius for 10 minutes. Following antigen retrieval, the sections were blocked with 2% normal goat serum in 1X PBS for 45 minutes at room temperature and then probed with or without Pan Cytokeratin Monoclonal Antibody (AE1/AE3), Alexa Fluor 488, eBioscience™ (Product # 53-9003-82) at 1:100 dilution in 0.1% normal goat serum overnight at 4 degree Celsius in a humidified chamber. ReadyProbes™ Tissue Autofluorescence Quenching Kit (Product # R37630) was used to quench autofluorescence from the tissues. Nuclei were stained with DAPI (Product # D1306) and the sections were mounted using ProLong™ Glass Antifade Mountant (Product # P36984). The images were captured on EVOS™ M7000 Imaging System (Product # AMF7000) at 20X magnification and externally deconvoluted.

- Submitted by
- Invitrogen Antibodies (provider)
- Main image
- Experimental details
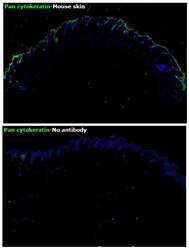
- Immunohistochemical analysis of pan cytokeratin was performed using formalin-fixed paraffin-embedded alveolar ridge mucosa (squamous cell carcinoma) tissue sections. To expose the target protein, heat-induced epitope retrieval was performed on de-paraffinized sections using eBioscience™ IHC Antigen Retrieval Solution - Low pH (10X) (Product # 00-4955-58) diluted to 1X solution in water in a decloaking chamber at 110 degree Celsius for 15 minutes. Following antigen retrieval, the sections were blocked with 2% normal goat serum in 1X PBS for 45 minutes at room temperature and then probed with or without Pan Cytokeratin Monoclonal Antibody (AE1/AE3), Alexa Fluor 488, eBioscience™ (Product # 53-9003-82) at 1:100 dilution in 0.1% normal goat serum overnight at 4 degree Celsius in a humidified chamber. ReadyProbes™ Tissue Autofluorescence Quenching Kit (Product # R37630) was used to quench autofluorescence from the tissues. Nuclei were stained with DAPI (Product # D1306) and the sections were mounted using ProLong™ Glass Antifade Mountant (Product # P36984). The images were captured on EVOS™ M7000 Imaging System (Product # AMF7000) at 20X magnification and deconvoluted externally.

Supportive validation
- Submitted by
- Invitrogen Antibodies (provider)
- Main image

- Experimental details
- NULL
- Conjugate
- Green dye
- Submitted by
- Invitrogen Antibodies (provider)
- Main image
- Experimental details
- NULL
- Conjugate
- Green dye
- Submitted by
- Invitrogen Antibodies (provider)
- Main image
- Experimental details
- NULL
- Conjugate
- Green dye
- Submitted by
- Invitrogen Antibodies (provider)
- Main image
- Experimental details
- NULL
- Conjugate
- Green dye
- Submitted by
- Invitrogen Antibodies (provider)
- Main image
- Experimental details
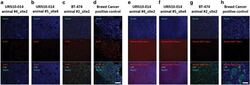
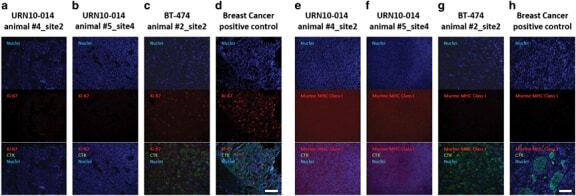
- Figure 2 Immunofluorescent staining for human-specific Ki-67, human-specific cytokeratin, and murine major histocompatibility complex (MHC) Class I. Nuclei were stained with DAPI. Observed neoplasms in the URN10-014 group were negative for human Ki-67+ and human-specific cytokeratin (columns a , b ), but stained positively for murine-specific MHC Class I ( e , f ). A BT474 xenograft ( c , g ) and a human metastatic breast cancer control ( d , h ) were positive for human cytokeratin and Ki-67, but negative for murine MHC Class I antigen. Scale bar (white)=100 mum.
- Conjugate
- Green dye
- Submitted by
- Invitrogen Antibodies (provider)
- Main image
- Experimental details
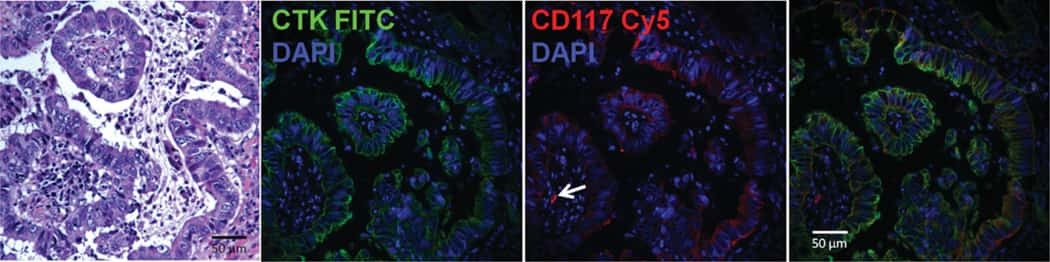
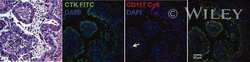
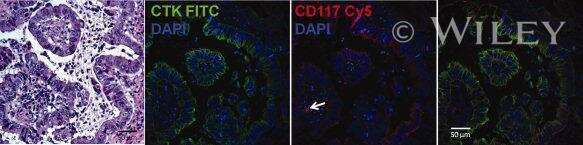
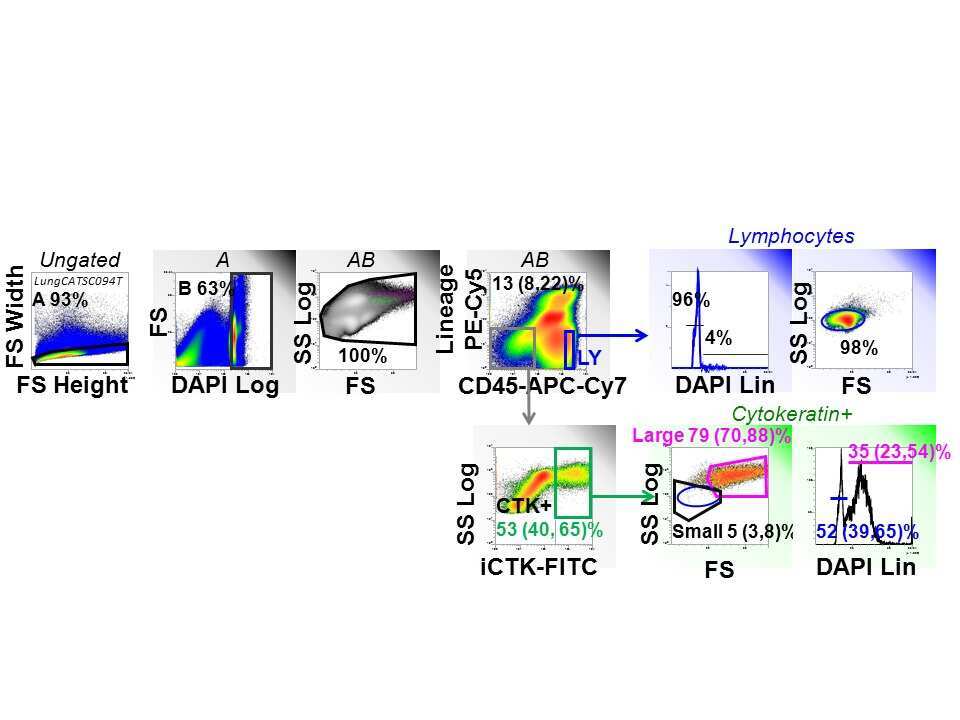
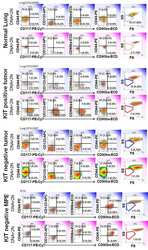
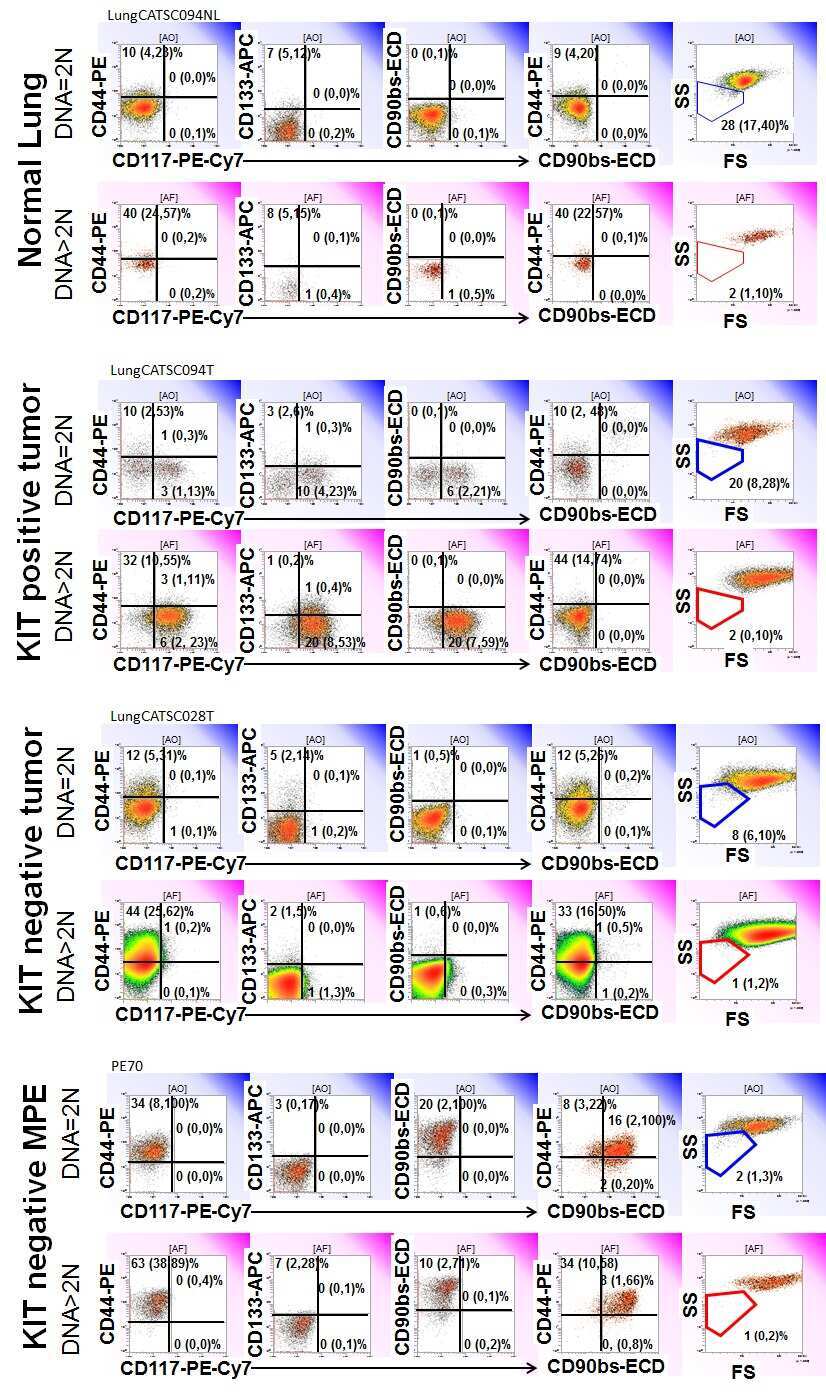
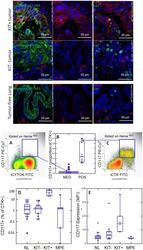
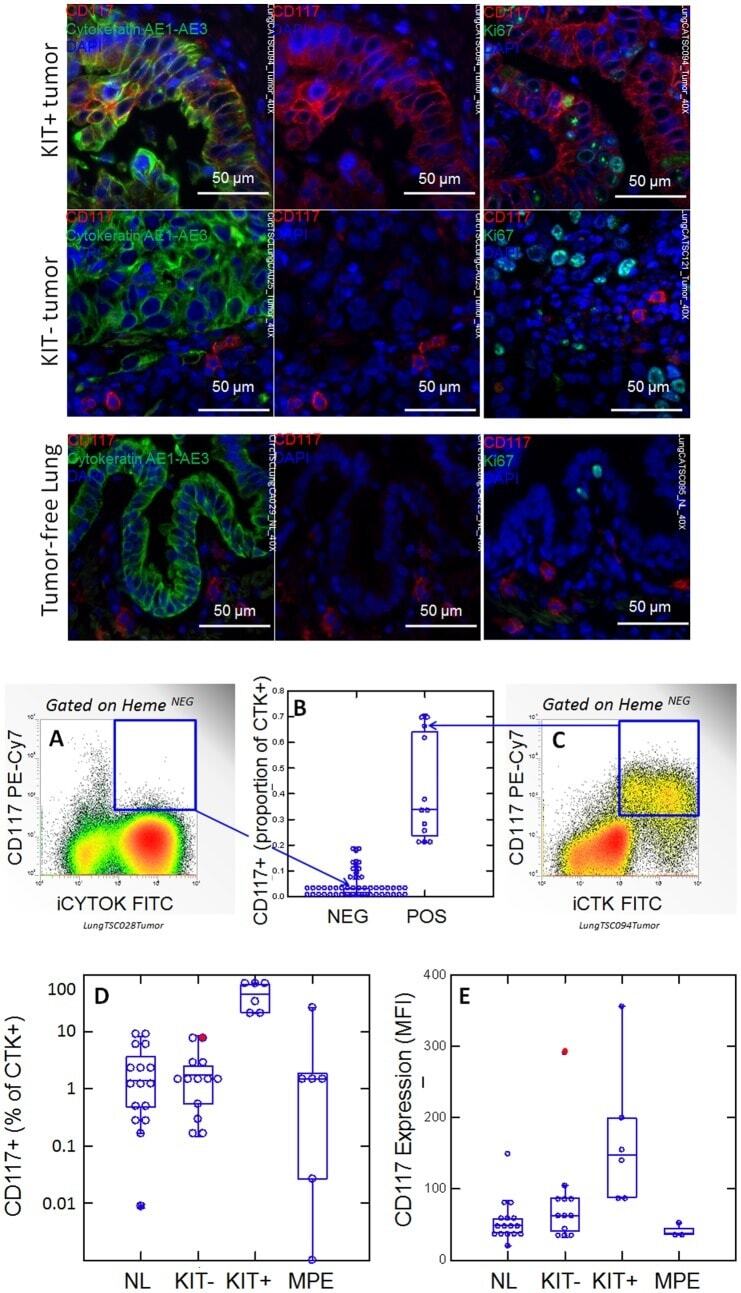
- Figure 1 CD117 expression in normal lung (NL) and NSCLC. Photomicrographs: Expression of CD117 and Ki-67 in NSC lung cancer and normal lung. The left columns show sections stained with CD117 (red), cytokeratin (green) and DAPI (blue). Sections in the center column show CD117 (red) and DAPI (blue) only, in order to reveal CD117 staining obscured by bright cytokeratin expression. Sections in the right column shows CD117 (red), the proliferation marker Ki67 (green) and DAPI (blue). Tumors were classified as KIT+ or negative on the basis of CD117 immunofluorescent staining of FFPE. In KIT+ tumors (top photomicrographs) CD117 (red stain, center and right panels) was expressed in virtually all cytokeratin+ tumor cells (green stain, left panels). Ki-67+ proliferating cells (green stain, right panels) were frequently seen among CD117+ tumor cells. In KIT negative tumors (center row of photomicrographs), only solitary CD117+ mast cells were detected (red stain, center and right panels). Proliferating Ki-67+ cells were frequent among cytokeratin+ CD117 negative tumor cells. Normal tumor-adjacent lung also appeared to lack CD117 expression among cytokeratin+ airway cells (bottom photomicrographs). Proliferating Ki-67+ cells were infrequent and confined to the basal layer of airway epithelium. When all NSCLC tumors are considered together, flow cytometry revealed bimodal CD117 expression (center panels A-C). Cells were gated on hematopoietic lineage negative singlet events with DNA conte
- Conjugate
- Green dye
- Submitted by
- Invitrogen Antibodies (provider)
- Main image
- Experimental details
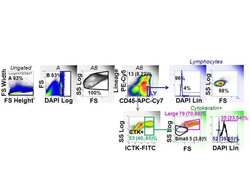
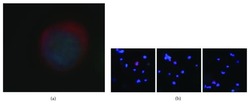
- Figure 1 (a) A circulating tumor cell prepared from a 7.5 ml blood sample from a 79-year-old male with no previous history of cancer. The cell is stained for cytokeratin (red) and for the cell nucleus (blue), typical of epithelial cells. Epithelial cells should not normally be present in the blood. The cell was negative for CD45, that is, not an immune cell. The cell nucleus has a large size typical of transcriptionally active cells, such as cancer cells, and the rounded shape of a cell in suspension, rather than the angular shape and cell sheath context of a normal solid tissue epithelium cell. (b) Three additional examples of circulating tumor cells stained for cytokeratin (red) and for the cell nucleus (blue). The lower magnification also shows the residual leucocytes surrounding the circulating tumor cells (blue nuclei, with no cytokeratin (red). The samples were enriched about 7500-fold for CTCs, with about 10,000 DAPI and CD45-positive leucocytes left in the sample after enrichment.
- Conjugate
- Green dye

- Submitted by
- Invitrogen Antibodies (provider)
- Main image
- Experimental details
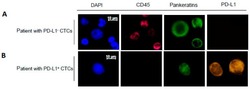
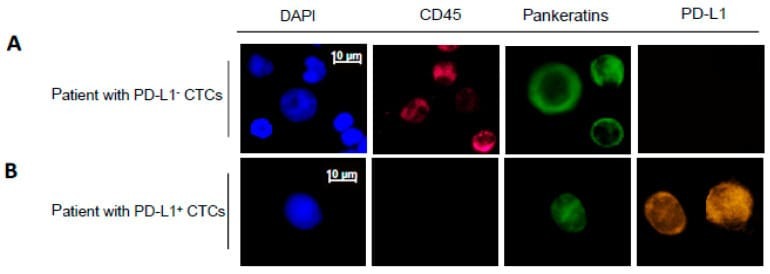
- Figure 2 Representative images of CTCs detected and subjected to immunostaining with DAPI, CD45, Pankeratins and PD-L1. Example images of CTCs from a patient with PD-L1 - CTCs ( A ) and PD-L1 + CTCs ( B ) are shown. The scale bar of 10 mum was applied to all pictures. ( C ) Number of CTCs and PD-L1 status isolated from blood samples from 38 patients (P1 through P38) with detectable PD-L1 status. ""P1"" stands for patient 1. Red bar represents the number of CK(+)/PD-L1(+) CTCs. Blue bar represents the number of CK(+)/PD-L1(-) CTCs.
- Conjugate
- Green dye
- Submitted by
- Invitrogen Antibodies (provider)
- Main image
- Experimental details
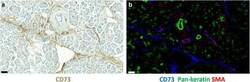
- Fig. 1 CD73 expression in normal pancreas. a Immunoperoxidase staining of normal pancreas for CD73 (brown). b Multicolour immunofluorescence staining of a consecutive section of normal pancreas for CD73 (blue), pan-cytokeratin (green) and alpha-smooth muscle actin (red). Bars, 50 mum
- Conjugate
- Green dye

- Submitted by
- Invitrogen Antibodies (provider)
- Main image
- Experimental details
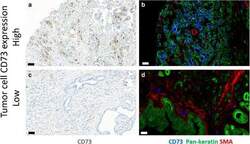
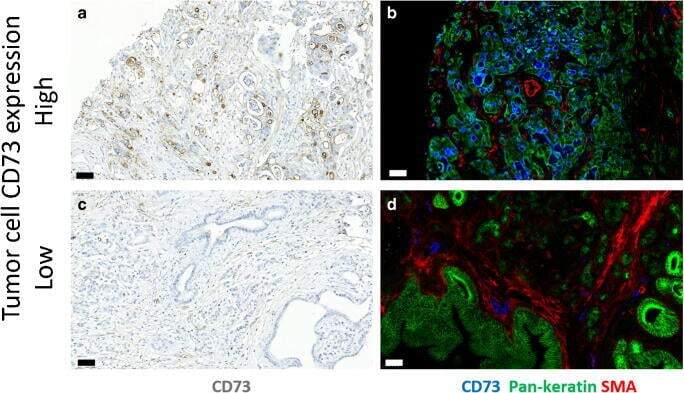
- Fig. 2 CD73 expression in adenocarcinoma of pancreas. Representative immunoperoxidase stainings (a and c) for CD73 (brown) and multicolour immunofluorescence stainings (b, d) for CD73 (blue), pan-cytokeratin (green) and alpha-smooth muscle actin (red). Bars, 50 mum
- Conjugate
- Green dye
- Submitted by
- Invitrogen Antibodies (provider)
- Main image
- Experimental details
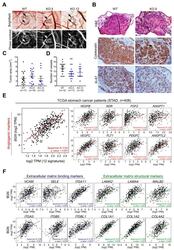
- Figure 6 Effect of biglycan in in vivo angiogenesis. ( A ) Representative images of tumors formed in the in vivo CAM by MKN74 cell models (WT and biglycan KO clones-KO.5 and KO.12). Phase contrast was used to better visualize tumor foci and vessels. MKN74 form multiple tumor foci (arrows/circles). Magnification at 20x. ( B ) Histological images of the formed tumors, cytokeratin staining confirming the presence of human epithelial tumors in the CAM. Ki-67 expression analysis was used to assess tumor aggressiveness. Histologically, tumors formed by KO cells present a less cohesive-like tumor mass with increased extracellular matrix stiffness. Hematoxilin & Eosin (H&E) staining images at 100X magnification, cytokeration and Ki-67 images at 200x magnification. ( C ) Quantification of the tumor area (mm 2 ) with no significant differences in the tumors being derived from the different cell lines. ( D ) Number of new vessels (less than 20 mum in diameter) formed towards the inoculation site. biglycan KO inoculated cells showed less capacity to form new vessels when compared to WT biglycan-positive tumors. ( E ) In silico gene analysis in GC tissues samples (TCGA, n = 408) showing that BGN was strongly positively correlated with angiogenic markers ( VEGFB, VEGFC, KDR, FLT1, FGF2, PDGFC, ANGPT1, ANGPT2, ANGPTL2, ANGPTL1, ANGPTL4, and ANGPTL7 ) . ( F ) In silico analysis demonstrating that BGN is positively correlated with ECM binding ( VCAM1, SELE, ITGA11, ITGA5, ITGB5, ITGBL1 ) and
- Conjugate
- Green dye

- Submitted by
- Invitrogen Antibodies (provider)
- Main image
- Experimental details
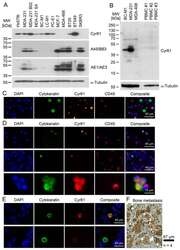
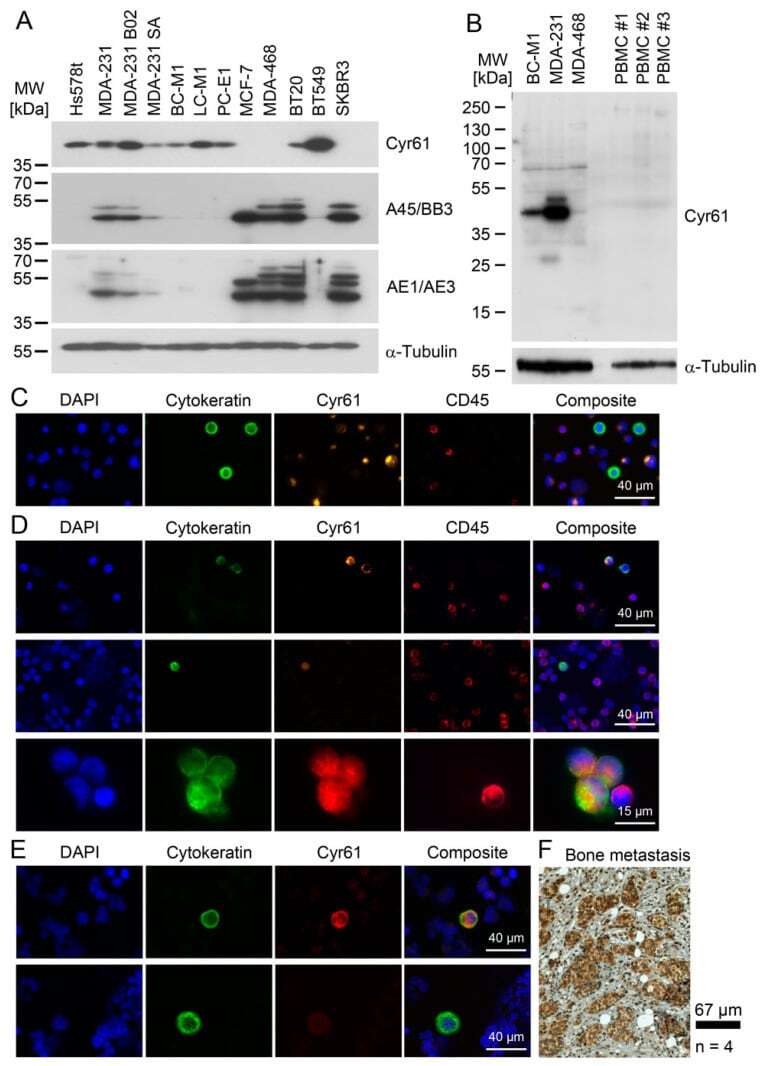
- Figure 5 Cyr61 detection in breast cancer cells. ( A ) Comparison of the cytoplasmic Cyr61 levels with cytokeratin levels, as analysed by the pan-cytokeratin antibody cocktails A45/BB3 and AE1/AE3 by Western blot analysis. ( B ) A comparison of the Cyr61 levels in the peripheral blood mononuclear cells (PBMC) of healthy women with the Cyr61 levels in breast cancer cell lines. ( C ) Cyr61 detection in BC-M1 and MDA-MB-468 spiked into blood samples from healthy women by immunocytochemical double staining. ( D ) Cyr61 detection in CTC from the peripheral blood of breast cancer patients (details: Table 1 ). ( E ) Detection of Cyr61 in the DTC from the bone marrow of breast cancer patients. The upper row shows a Cyr61-positive DTC, and the bottom row shows a Cyr61-negative DTC. ( F ) An immunohistochemical Cyr61 detection in the bone metastases of breast cancer patients. ( C - E ) The composite images are overlays of the Cytokeratin, Cyr61, Dapi and CD45 (if applied) signals, n biol : 3 ( A , C , E ), 4 ( F ).
- Conjugate
- Green dye
- Submitted by
- Invitrogen Antibodies (provider)
- Main image
- Experimental details
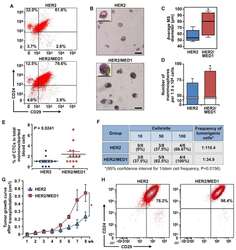
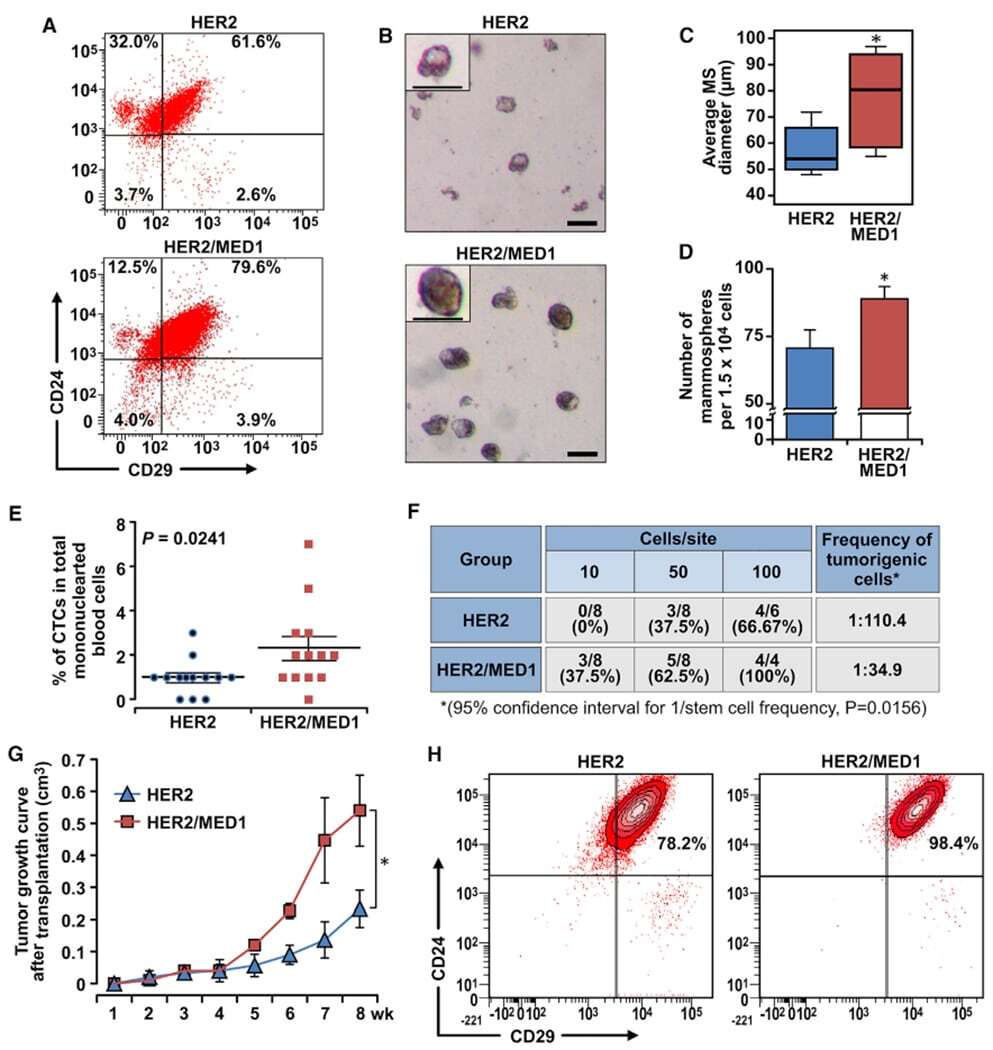
- Figure 4. MED1 overexpression promotes MMTV-HER2 CSC formation (A) FACS analyses of MMTV-HER2 and MMTV-HER2/MMTV-MED1 CSCs using antibodies against cell surface markers Lin, CD24, and CD29. (B) Mammosphere assays using FACS-sorted tumor cells in (A). Scale bar: 100 mum. (C and D) Average diameters (C) and numbers (D) of mammospheres formed in (B). (E) Statistics of flow cytometry analysis of CD45 - CK18 + EpCAM hi circulating tumor cells (CTCs) in mononuclear blood cells from MMTV-HER2 and MMTV-HER2/MMTV-MED1 tumor-bearing mice (n = 13). (F) Limiting dilution analyses of tumor-initiating cells in MMTV-HER2 and MMTV-HER2/MMTV-MED1 bulk tumors. (G) Growth curves of orthotopic MMTV-HER2 and MMTV-HER2/MMTV-MED1 tumor xenografts (n = 6). (H) FACS analyses of the grafted tumors using cell surface markers Lin (CD31, CD45, and Ter119), CD24, and CD29. The values are obtained from three independent experiments and shown as mean +- SD. *p < 0.05.
- Conjugate
- Green dye
- Submitted by
- Invitrogen Antibodies (provider)
- Main image
- Experimental details
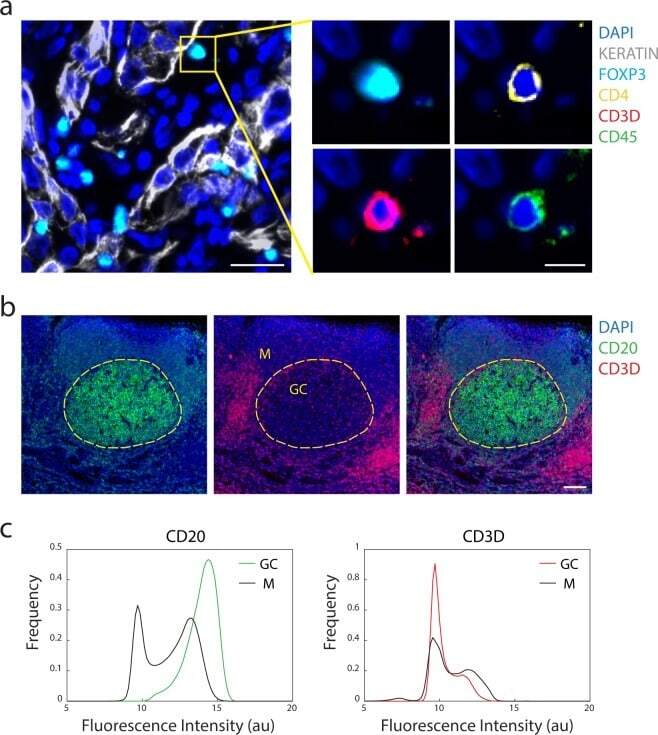
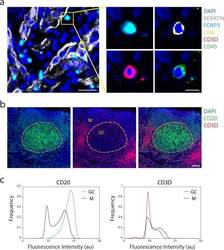
- Fig. 3 Antibody staining quality. ( a ) Immunofluorescence image from LUNG-3-PR showing epithelial tumor cells marked by Keratin (white) and a regulatory T cell marked by FOXP3 (cyan), CD4 (yellow), CD3D (red), and CD45 (green) (scale bar: 25 um; inset scale bar: 10 um). ( b ) A region of TONSIL-1 showing CD20 (green) and CD3D (red) expression. Area inside yellow dashed circle denotes germinal center (GC), and area outside denotes the mantle (M) region (scale bar: 100 um). ( c ) Probability density function of fluorescence signal intensity of every pixel in the germinal center (n = 1,446,450 pixels) and mantle (n = 4,369,358 pixels) for CD20 and CD3D within the region shown in ( b ). X-axis is fluorescence intensity (log2 au) and y-axis is frequency of pixels.
- Conjugate
- Green dye