 Explore
 Validate
 Learn
Learn Flow cytometry
Antibody data
- Antibody Data
- Antigen structure
- References [15]
- Comments [0]
- Validations
- Flow cytometry [2]
- Other assay [11]
Submit
Validation data
Reference
Comment
Report error
- Product number
- 46-0116-42 - Provider product page

- Provider
- Invitrogen Antibodies
- Product name
- CD11c Monoclonal Antibody (3.9), PerCP-eFluor™ 710, eBioscience™
- Antibody type
- Monoclonal
- Antigen
- Other
- Description
- Description: The 3.9 monoclonal antibody reacts with human CD11c, the 150 kDa integrin alphaX chain. CD11c non-covalently associates with beta2 integrin to form the CD11c/CD18 heterodimer. This complex is expressed on monocytes, granulocytes, macrophages, NK, dendritic cells and subset of T and B lymphocytes. CD11c/CD18 binds to CD54, iC3b and fibrinogen and plays a role in leukocyte adhesive interactions. Applications Reported: This 3.9 antibody has been reported for use in flow cytometric analysis. Applications Tested: This 3.9 antibody has been pre-titrated and tested by flow cytometric analysis of normal human peripheral blood cells. This can be used at 5 µL (1 µg) per test. A test is defined as the amount (µg) of antibody that will stain a cell sample in a final volume of 100 µL. Cell number should be determined empirically but can range from 10^5 to 10^8 cells/test. PerCP-eFluor® 710 emits at 710 nm and is excited with the blue laser (488 nm); it can be used in place of PerCP-Cyanine5.5. We recommend using a 710/50 bandpass filter, however, the 695/40 bandpass filter is an acceptable alternative. Please make sure that your instrument is capable of detecting this fluorochrome. Fixation: Samples can be stored in IC Fixation Buffer (Product # 00-822-49) (100 µL cell sample + 100 µL IC Fixation Buffer) or 1-step Fix/Lyse Solution (Product # 00-5333-54) for up to 3 days in the dark at 4°C with minimal impact on brightness and FRET efficiency/compensation. Some generalizations regarding fluorophore performance after fixation can be made, but clone specific performance should be determined empirically. Excitation: 488 nm; Emission: 710 nm; Laser: Blue Laser. Filtration: 0.2 µm post-manufacturing filtered.
- Reactivity
- Human
- Host
- Mouse
- Isotype
- IgG
- Antibody clone number
- 3.9
- Vial size
- 100 Tests
- Concentration
- 5 μL/Test
- Storage
- 4°C, store in dark, DO NOT FREEZE!
Submitted references Aluminum hydroxide adjuvant diverts the uptake and trafficking of genetically detoxified pertussis toxin to lysosomes in macrophages.
Isolevuglandins disrupt PU.1-mediated C1q expression and promote autoimmunity and hypertension in systemic lupus erythematosus.
Upregulation of CD3ζ and L-selectin in antigen-specific cytotoxic T lymphocytes by eliminating myeloid-derived suppressor cells with doxorubicin to improve killing efficacy of neuroblastoma cells in vitro.
Increased TNF-α Initiates Cytoplasmic Vacuolization in Whole Blood Coculture with Dengue Virus.
The long non-coding RNA Cancer Susceptibility 15 (CASC15) is induced by isocitrate dehydrogenase (IDH) mutations and maintains an immature phenotype in adult acute myeloid leukemia.
Human and Mouse Transcriptome Profiling Identifies Cross-Species Homology in Pulmonary and Lymph Node Mononuclear Phagocytes.
Simian-Human Immunodeficiency Virus SHIV.CH505 Infection of Rhesus Macaques Results in Persistent Viral Replication and Induces Intestinal Immunopathology.
Autophagosome-based strategy to monitor apparent tumor-specific CD8 T cells in patients with prostate cancer.
AG490 reverses phenotypic alteration of dendritic cells by bladder cancer cells.
Genetic Architecture of Adaptive Immune System Identifies Key Immune Regulators.
dNP2 is a blood-brain barrier-permeable peptide enabling ctCTLA-4 protein delivery to ameliorate experimental autoimmune encephalomyelitis.
Pharmacological targeting of miR-155 via the NEDD8-activating enzyme inhibitor MLN4924 (Pevonedistat) in FLT3-ITD acute myeloid leukemia.
Towards programming immune tolerance through geometric manipulation of phosphatidylserine.
Targeting CDK1 promotes FLT3-activated acute myeloid leukemia differentiation through C/EBPα.
Negative selection by IgM superantigen defines a B cell central tolerance compartment and reveals mutations allowing escape.
Jaldin-Fincati J, Moussaoui S, Gimenez MC, Ho CY, Lancaster CE, Botelho R, Ausar F, Brookes R, Terebiznik M
Molecular microbiology 2022 May;117(5):1173-1195
Molecular microbiology 2022 May;117(5):1173-1195
Isolevuglandins disrupt PU.1-mediated C1q expression and promote autoimmunity and hypertension in systemic lupus erythematosus.
Patrick DM, de la Visitación N, Krishnan J, Chen W, Ormseth MJ, Stein CM, Davies SS, Amarnath V, Crofford LJ, Williams JM, Zhao S, Smart CD, Dikalov S, Dikalova A, Xiao L, Van Beusecum JP, Ao M, Fogo AB, Kirabo A, Harrison DG
JCI insight 2022 Jul 8;7(13)
JCI insight 2022 Jul 8;7(13)
Upregulation of CD3ζ and L-selectin in antigen-specific cytotoxic T lymphocytes by eliminating myeloid-derived suppressor cells with doxorubicin to improve killing efficacy of neuroblastoma cells in vitro.
Xu W, Li S, Li M, Zhou H, Yang X
Journal of clinical laboratory analysis 2022 Jan;36(1):e24158
Journal of clinical laboratory analysis 2022 Jan;36(1):e24158
Increased TNF-α Initiates Cytoplasmic Vacuolization in Whole Blood Coculture with Dengue Virus.
Satria RD, Huang TW, Jhan MK, Shen TJ, Tseng PC, Wang YT, Yang ZY, Hsing CH, Lin CF
Journal of immunology research 2021;2021:6654617
Journal of immunology research 2021;2021:6654617
The long non-coding RNA Cancer Susceptibility 15 (CASC15) is induced by isocitrate dehydrogenase (IDH) mutations and maintains an immature phenotype in adult acute myeloid leukemia.
Grasedieck S, Ruess C, Krowiorz K, Lux S, Pochert N, Schwarzer A, Klusmann JH, Jongen-Lavrencic M, Herold T, Bullinger L, Pollack JR, Rouhi A, Kuchenbauer F
Haematologica 2020 Sep 1;105(9):e448-453
Haematologica 2020 Sep 1;105(9):e448-453
Human and Mouse Transcriptome Profiling Identifies Cross-Species Homology in Pulmonary and Lymph Node Mononuclear Phagocytes.
Leach SM, Gibbings SL, Tewari AD, Atif SM, Vestal B, Danhorn T, Janssen WJ, Wager TD, Jakubzick CV
Cell reports 2020 Nov 3;33(5):108337
Cell reports 2020 Nov 3;33(5):108337
Simian-Human Immunodeficiency Virus SHIV.CH505 Infection of Rhesus Macaques Results in Persistent Viral Replication and Induces Intestinal Immunopathology.
Bar KJ, Coronado E, Hensley-McBain T, O'Connor MA, Osborn JM, Miller C, Gott TM, Wangari S, Iwayama N, Ahrens CY, Smedley J, Moats C, Lynch RM, Haddad EK, Haigwood NL, Fuller DH, Shaw GM, Klatt NR, Manuzak JA
Journal of virology 2019 Sep 15;93(18)
Journal of virology 2019 Sep 15;93(18)
Autophagosome-based strategy to monitor apparent tumor-specific CD8 T cells in patients with prostate cancer.
van de Ven R, Hilton TL, Hu HM, Dubay CJ, Haley D, Paustian C, Puri S, Urba WJ, Curti BD, Aung S, Fox BA
Oncoimmunology 2018;7(12):e1466766
Oncoimmunology 2018;7(12):e1466766
AG490 reverses phenotypic alteration of dendritic cells by bladder cancer cells.
Xiu W, Ma J, Lei T, Zhang M
Oncology letters 2018 Sep;16(3):2851-2856
Oncology letters 2018 Sep;16(3):2851-2856
Genetic Architecture of Adaptive Immune System Identifies Key Immune Regulators.
Lagou V, Garcia-Perez JE, Smets I, Van Horebeek L, Vandebergh M, Chen L, Mallants K, Prezzemolo T, Hilven K, Humblet-Baron S, Moisse M, Van Damme P, Boeckxstaens G, Bowness P, Dubois B, Dooley J, Liston A, Goris A
Cell reports 2018 Oct 16;25(3):798-810.e6
Cell reports 2018 Oct 16;25(3):798-810.e6
dNP2 is a blood-brain barrier-permeable peptide enabling ctCTLA-4 protein delivery to ameliorate experimental autoimmune encephalomyelitis.
Lim S, Kim WJ, Kim YH, Lee S, Koo JH, Lee JA, Yoon H, Kim DH, Park HJ, Kim HM, Lee HG, Yun Kim J, Lee JU, Hun Shin J, Kyun Kim L, Doh J, Kim H, Lee SK, Bothwell ALM, Suh M, Choi JM
Nature communications 2015 Sep 15;6:8244
Nature communications 2015 Sep 15;6:8244
Pharmacological targeting of miR-155 via the NEDD8-activating enzyme inhibitor MLN4924 (Pevonedistat) in FLT3-ITD acute myeloid leukemia.
Khalife J, Radomska HS, Santhanam R, Huang X, Neviani P, Saultz J, Wang H, Wu YZ, Alachkar H, Anghelina M, Dorrance A, Curfman J, Bloomfield CD, Medeiros BC, Perrotti D, Lee LJ, Lee RJ, Caligiuri MA, Pichiorri F, Croce CM, Garzon R, Guzman ML, Mendler JH, Marcucci G
Leukemia 2015 Oct;29(10):1981-92
Leukemia 2015 Oct;29(10):1981-92
Towards programming immune tolerance through geometric manipulation of phosphatidylserine.
Roberts RA, Eitas TK, Byrne JD, Johnson BM, Short PJ, McKinnon KP, Reisdorf S, Luft JC, DeSimone JM, Ting JP
Biomaterials 2015 Dec;72:1-10
Biomaterials 2015 Dec;72:1-10
Targeting CDK1 promotes FLT3-activated acute myeloid leukemia differentiation through C/EBPα.
Radomska HS, Alberich-Jordà M, Will B, Gonzalez D, Delwel R, Tenen DG
The Journal of clinical investigation 2012 Aug;122(8):2955-66
The Journal of clinical investigation 2012 Aug;122(8):2955-66
Negative selection by IgM superantigen defines a B cell central tolerance compartment and reveals mutations allowing escape.
Duong BH, Ota T, Aoki-Ota M, Cooper AB, Ait-Azzouzene D, Vela JL, Gavin AL, Nemazee D
Journal of immunology (Baltimore, Md. : 1950) 2011 Dec 1;187(11):5596-605
Journal of immunology (Baltimore, Md. : 1950) 2011 Dec 1;187(11):5596-605
No comments: Submit comment
Supportive validation
- Submitted by
- Invitrogen Antibodies (provider)
- Main image

- Experimental details
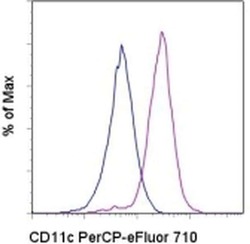
- Staining of normal human peripheral blood cells with Mouse IgG1 K Isotype Control PerCP-eFluor® 710 (Product # 46-4714-82) (blue histogram) or Anti-Human CD11c PerCP-eFluor® 710 (purple histogram). Cells in the monocyte gate were used for analysis.

- Submitted by
- Invitrogen Antibodies (provider)
- Main image
- Experimental details
- Staining of normal human peripheral blood cells with Mouse IgG1 K Isotype Control PerCP-eFluor® 710 (Product # 46-4714-82) (blue histogram) or Anti-Human CD11c PerCP-eFluor® 710 (purple histogram). Cells in the monocyte gate were used for analysis.

Supportive validation
- Submitted by
- Invitrogen Antibodies (provider)
- Main image
- Experimental details
- NULL

- Submitted by
- Invitrogen Antibodies (provider)
- Main image

- Experimental details
- NULL

- Submitted by
- Invitrogen Antibodies (provider)
- Main image

- Experimental details
- NULL

- Submitted by
- Invitrogen Antibodies (provider)
- Main image

- Experimental details
- Figure 4 Immune profiling in DENV-treated whole blood cells 24 h postincubation. Following DENV (MOI = 1) coculture in 100 mu l of WB ex vivo for 24 h, (a) representative flow cytometric analysis and gating of various cells obtained from five cases, performed by staining for specific cell surface markers (CD4, CD8, CD11c, CD14, CD16, CD19, CD25, CD56, CD62L, and HLA-DR), in the DENV-infected and mock groups showed (b) the changes in the expression of specific immune cell populations as noted. (c) The results are shown as a percentage of the mean +- SD obtained from five cases. * p < 0.05, ** p < 0.01, and *** p < 0.001, compared to the mock group. R: region; WBC: white blood cell; bri: bright.

- Submitted by
- Invitrogen Antibodies (provider)
- Main image

- Experimental details
- Figure 1. Gating Strategy to Sort Human and Mouse Mononuclear Phagocytes for RNA Isolation (A and B) Fluorescence-activated cell sorting (FACS) gating strategy used to isolate human (A) or mouse (B) mononuclear phagocytes (MPs, labeled in red) from the indicated tissues. Before sorting, cell suspensions were magnetically enriched as indicated and gated to select Live; Single; CD45 + ; Lineage - cells as shown in Figures S1 and S2 . Arrows indicate where further analysis is performed on the specified subpopulation. The data presented are representative of 3-6 replicates per sort. (C) Table illustrating cell surface marker expression by MP subsets in human (top) and mouse (bottom). - or lo signifies no or little expression, + or ++ indicates expression or strong expression, -/+ indicates heterogeneous expression of marker proteins.

- Submitted by
- Invitrogen Antibodies (provider)
- Main image

- Experimental details
- FIGURE 1 Extraction, identification, and purification of myeloid-derived suppressor cell and cultivation of dendritic cell. (A) Cells were extracted from the bone marrow of BALB/c mice and stained by monoclonal antibodies. Under flow cytometry, the expressive rate of Gr-1 + MDSC, CD11b + MDSC, CD11c + MDSC, CD80 + MDSC, F4/80 + MDSC, and MHC-II + MDSC were 70.4%, 3.5%, 4.8%, 1.2%, 0.3%, 2.1% respectively. (B) The expressive rate of Gr-1 + CD11b + MDSC was 22.6%. (C) After MACS by CD11b magnetic bead, purification of Gr-1 + CD11b + MDSC reached 84.6%. (D) Most non-antigen-loaded dendritic cells grew adherently, with different sizes, star or spindle shape, and stretching tubers, but some of the cells seemed to have adopted a half-adherent state with rough surface. The expressive rates of CD11c, CD86, and MHC-II on DCs were 10.9%, 3.8%, and 27.9%, respectively, by flow cytometry. (E) On the 7th day, DCs were stimulated and activated by tumor antigens. DCs in the half-adherent state increased obviously with radial spikes and bigger shape. The expressive rates of CD11c, CD86, and MHC-II were 74.8%, 50.3%, and 49.8%, respectively, by flow cytometry. IgG FITC, a homotypic control antibody, was used to set the gate strategy. Scale bar = 100 mumol/liter. MDSC, myeloid-derived suppressor cell; MACS, magnetic-activated cell sorting; DC, dendritic cell; CD, cluster of differentiation

- Submitted by
- Invitrogen Antibodies (provider)
- Main image

- Experimental details
- 5 FIGURE Impact of particle size on aluminum adjuvant internalization. (a) U-937 cells were incubated with AlOOH-lumo (control) or AlOOH-lumo previously subjected to freeze/thaw cycles (freeze/thaw) to increase the size of the particles, as described in experimental procedures. The cells were incubated at 37degC for 4 h and subsequently processed for flow cytometry analysis. Differentiated macrophages were classified using anti-CD11c antibodies. Cell nuclei were labeled with DAPI. Cell populations encircled by a dotted line have not internalized AlOOH-Lumo and cells that have internalized AlOOH-Lumo are encircled by a solid line. (b) U-937 cells were incubated with control or freeze/thaw AlOOH-lumo preparations as described above and subsequently fixed and F-Actin stained with blue phalloidin (pseudocolored gray). Red arrowheads in the right panel point to small, internalized adjuvant particles. Spinning disk confocal images represent a merge of z-stacks. Images are representative of three independent trials. Fifty cells per trial per condition were analyzed. Scale bars, 5 mum. (c) U-937 cells were incubated with control or freeze/thaw AlOOH-lumo preparations and processed as described in (b). The percentage of cells with intracellular AlOOH particles were calculated for three independent trials and the mean represented in the bar graph. * p

- Submitted by
- Invitrogen Antibodies (provider)
- Main image

- Experimental details
- IsoLG adducts are enriched in monocytes of patients with SLE. ( A ) Representative FACS plots displaying isoLG adduct containing CD11c + PBMCs from a representative control and patient with SLE. Representative histograms displaying the distribution of isoLG adducts in ( B ) CD11c + and ( C ) CD11c + CD86 + cells. Quantitation of IsoLG adduct-containing cells as a percentage of ( D ) CD11c + , ( E ) CD11c + CD86 + , and ( F ) CD14 + cells. For B - F data were analyzed using 1-tailed Student's t test or Mann-Whitney U test ( n = 10-11, *P < 0.05). ( G ) Stable isotope dilution multiple reaction monitoring for mass spectrometry analysis of isoLG-lysine-lactam adduct in DCs. Representative liquid chromatography/mass spectrometry chromatographs from a representative patient. The top row shows multiple reaction monitoring chromatographs for isoLG lysine lactam in samples, while the bottom row shows multiple reaction monitoring chromatograph for [13C615N2] internal standard for the same samples. cps, counts per second; Rt, retention time. ( H ) Quantitation of isoLG-lysine in monocytes from a subset of SLE patients and controls. ( I ) Monocytes from SLE patients and controls were sorted. Superoxide was detected using HPLC to monitor conversion of dihydroethidium to the superoxide oxidation adduct 2-hydroxyethidium (2-HO-ET) and ethidium. ( J ) Quantitation of 2-HO-ET from SLE patients and controls. For H and J , comparisons were made with a 1-tailed Student's t test ( n = 4-6, *P

- Submitted by
- Invitrogen Antibodies (provider)
- Main image

- Experimental details
- Figure 2 Protein delivery efficiency of dNP2 in primary mouse and human immune cells. ( a , b ) Mouse primary splenocytes were isolated from 6-week-old female C57BL/6 mice and the cells were incubated with 5 muM EGFP, TAT- and dNP2-EGFP for 2 h. Intracellular fluorescence was analysed by flow cytometry and the data are represented as dot plots or mean fluorescence intensity (MFI) of the cells. ( c , d ) Human PBMCs were isolated from healthy donor blood and the cells were incubated with 5 muM EGFP, TAT-, dNP2-EGFP for 2 h. The data were analysed as described above. ( e ) Total splenocytes were incubated with 1 muM EGFP, TAT-, and dNP2-EGFP for 2 h. Cells were gated using markers specific for CD4 T cells (CD4 + ), B cells (CD19 + ), macrophages (CD11c lo CD11b hi F480 + ) and DCs (CD11c hi MHCII hi ). The EGFP signal in each cell population was then analysed by flow cytometric analysis. The relative MFI value was normalization to PBS treated cells. The red line indicates relative MFI of PBS-treated cells. ( f ) Total PBMCs were incubated with 1 muM EGFP, TAT-, and dNP2-EGFP for 2 h. Cells were gated with markers specific for CD4 T cells (CD4 + ), B cells (CD19 + ), macrophages (CD11b + ) and DCs (CD11c + ) and the data were then analysed as described above. ( g ) Time-lapse images of mouse CD4 T cells incubated with 1 muM EGFP, TAT- and dNP2-EGFP were acquired for 2 h (Scale bar, 15 mum) and ( h ) the average fluorescence intensities of 10 cells from each sample were calculate

- Submitted by
- Invitrogen Antibodies (provider)
- Main image

- Experimental details
- Figure 2. Percentage of purified DC samples in all experiments. DCs were labeled with the Non-DC Depletion Cocktail for negative selection. Next, DCs were labeled with DC Enrichment Cocktail for positive selection. The expression of CD11c and CD86 was tested by flow cytometery. The percentages of purified DC are presented in the top of each panel. DCs, dendritic cells; CD, cluster of differentiation.

- Submitted by
- Invitrogen Antibodies (provider)
- Main image

- Experimental details
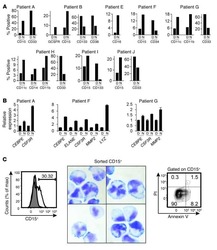
- Figure 1. CASC15 -KO promotes the differentiation of acute myeloid leukemia cells. (A) Apoptosis in CASC15 -KO and empty vector-transduced (control) OCI-AML5 cell lines after 24 h of depletion of granulocyte-macrophage colony-stimulating factor (annexin-FITC/Sytox blue flow cytometry). (B) Expression of SOX4 during in vitro differentiation of CASC15 -KO and control OCI-AML5 cell lines. All cells were treated with 0.1 mM all- trans retinoic acid (ATRA) and 1 nM 12-O-tetradecanoylphorbol-13-acetate (TPA) over 72 h in three independent experiments. Total RNA was extracted before, after 24 h and after 72 h of treatment, DNase-digested and transcribed to cDNA. A quantitative real-time polymerase chain reaction (qRT-PCR) was performed using SYBR green chemistry with subsequent melting curve analysis in technical triplicates. The 2-ddCt was calculated relative to the pre-determined housekeeping gene encoding succinate dehydrogenase complex subunit C ( SDHC ). (C) Baseline expression of the monocyte/macrophage markers CD11b (integrin subunit alpha M, ITGAM), CD11c (integrin subunit alpha X, ITGAX), and CD14, the granulocyte marker CD15 (fucosyltransferase 4, FUT4), and the general myeloid marker CD13 (aminopeptidase N, APN) in CASC15 -KO and control cells. The percentages of positive cells, quantified by flow cytometry after 72 h, are shown. (D-F) Growth rate and CD11c myeloid cell surface marker expression of CASC15 and control cell lines during drug-induced in vitro differentiation
