 Explore
 Validate
 Learn
Learn Western blot
 ELISA
ELISAAntibody data
- Antibody Data
- Antigen structure
- References [0]
- Comments [0]
- Validations
- Western blot [1]
- Immunohistochemistry [2]
- Other assay [9]
Submit
Validation data
Reference
Comment
Report error
- Product number
- PA1-26204 - Provider product page

- Provider
- Invitrogen Antibodies
- Product name
- Collagen I Polyclonal Antibody
- Antibody type
- Polyclonal
- Antigen
- Purifed from natural sources
- Description
- Some class-specific anti-collagens are specific for three-dimensional epitopes, resulting in diminished reactivity with denatured collagen or formalin-fixed, paraffin embedded tissues. This antibody reacts with most mammalian Type I collagens and has negligible cross-reactivity with Type II, III, IV, V or VI collagens. Cross-reactivity with other human serum proteins and non-collagen extracellular matrix proteins is neglible.|Western blot: this preparation results in a native conformation of the protein. It is recommend not to add 2-ME or DTT in lysis buffer and not boiling the sample.
- Reactivity
- Human, Mouse, Rat, Bovine
- Host
- Rabbit
- Isotype
- IgG
- Vial size
- 100 µg
- Concentration
- 1.15 mg/mL
- Storage
- Store at 4°C short term. For long term storage, store at -20°C, avoiding freeze/thaw cycles.
No comments: Submit comment
Supportive validation
- Submitted by
- Invitrogen Antibodies (provider)
- Main image
- Experimental details
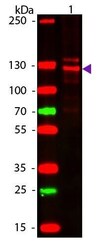
- Western blot analysis of Human Collagen Type I was performed by loading 50 ng of Human Collagen Type 1 onto a membrane and blotting with a Collagen I Polyclonal Antibody (Product # PA1-26204) at a dilution of 1:1,000 overnight at 4°C. Secondary antibody: rabbit secondary antibody at 1:20,000 for 30 min at RT. Block for 30 min at RT. Predicted/Observed size: 139 & 130 kDa.

Supportive validation
- Submitted by
- Invitrogen Antibodies (provider)
- Main image

- Experimental details
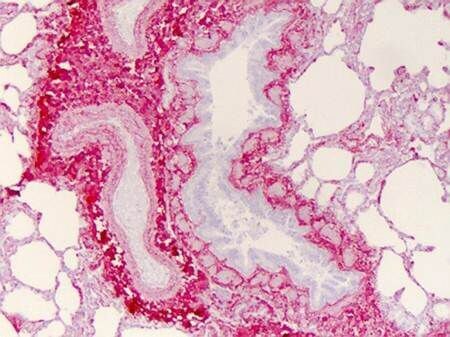
- Immunohistochemistry of Collagen I was performed in formalin fixed, paraffin embedded human lung tissue using Collagen I Polyclonal Antibody (Product # PA1-26204) at a dilution of 1:400. A peroxidase goat anti-rabbit was used as a secondary antibody at 1:10,000 for 45 min at RT. Localization: Strong staining was observed in the extracellular matrix of the lung. Epithelial cells were negative Staining: antibody as precipitated red signal with a hematoxylin purple nuclear counterstain.
- Submitted by
- Invitrogen Antibodies (provider)
- Main image
- Experimental details
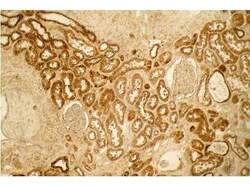
- Immunohistochemistry of Collagen I was performed in formalin fixed, paraffin embedded normal kidney using Collagen I Polyclonal Antibody (Product # PA1-26204) at a dilution of 1:100 for 4 hours at room temperature. A peroxidase goat anti-rabbit was used as a secondary antibody at 1:10,000 for 45 min at RT. Localization: Distal tubules in normal kidney tissue. Note the absence of staining of glomeruli. Staining: antibody as precipitated red signal with a hematoxylin purple nuclear counterstain. Antigen retrieval: No antigen retrieval was performed.

Supportive validation
- Submitted by
- Invitrogen Antibodies (provider)
- Main image
- Experimental details
- NULL

- Submitted by
- Invitrogen Antibodies (provider)
- Main image

- Experimental details
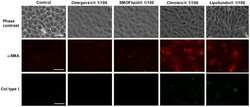
- Figure 9 Omegaven(r) inhibits myofibroblast markers induced by TGFbeta1. Human liver epithelial cell line THLE-3 was incubated in presence or absence of lipid emulsions Omegaven(r) 10%, Lipofundin MCT/LCT(r) 20%, ClinOleic(r) 20% or SMOFlipid(r) 20% at different dilutions, for 30 min followed by TGFbeta1 5 ng/mL stimulation for additional 72 hours. (A) Visible morphology and immunofluorescence for alpha smooth muscle actin (alphaSMA) and collagen type I (col type I) distribution and expression. B) Expression of mRNA of alphaSMA and col type I . Scale bar: 10 um. Results are expressed as means +- SEM of six independent experiments. * p

- Submitted by
- Invitrogen Antibodies (provider)
- Main image

- Experimental details
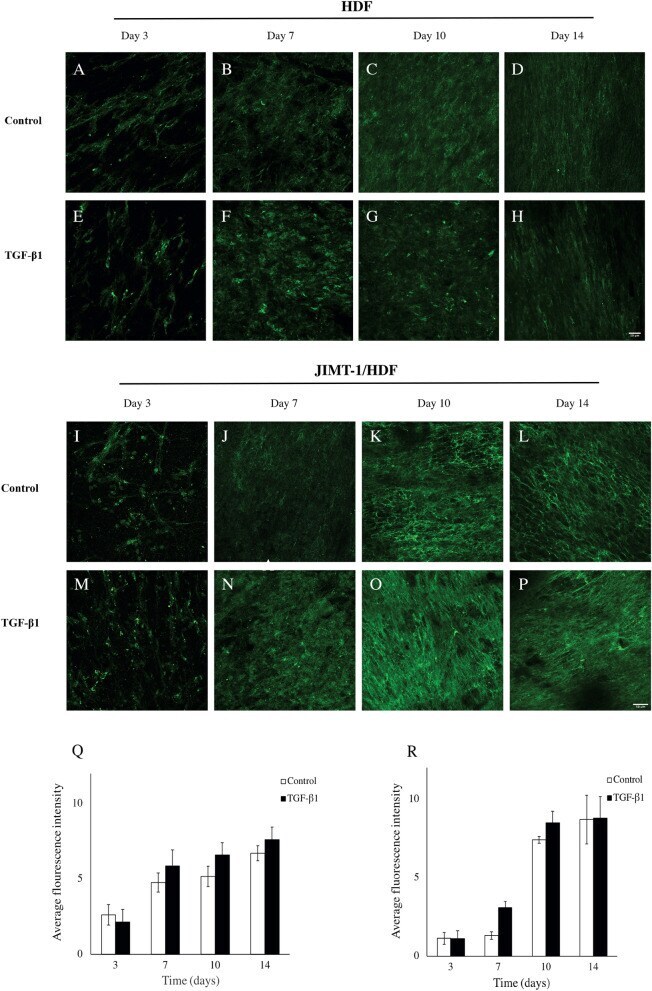
- Figure 2 Collagen I deposition, localization, and quantification in decellularized scaffolds of HDF and JIMT-1/HDF 3D cultures. ( A - P ) Single confocal plane images of collagen I deposition taken in the centre of decellularized 3D cultures incubated in the absence (control) or presence of 5 ng/ml TGF-beta1. The 3D cultures were decellularized, fixed in 3.7% formaldehyde and stained to visualize fibronectin (green) at 3, 7, 10, and 14 days of culturing. All images are representative of 3 independent experiments. Scale bar is 50 mum. Quantification of fluorescence intensity using ImageJ in images taken by epifluorescence microscopy in HDF decellularized scaffolds ( Q ) and JIMT-1/HDF decellularized scaffolds ( R ). The columns are represented as mean +- SEM (n = 3).
- Submitted by
- Invitrogen Antibodies (provider)
- Main image

- Experimental details
- Fig. 10 Intercellular transfer of miR-133 by H/R-induced EPC-derived exosomes inhibits fibroblast MEndoT. a Endothelial markers CD31, VE-cadherin, and vWF and fibrosis markers alpha-SMA, N-cadherin, vimentin, and collagen I were measured by western blotting in fibroblasts treated with H/R, H/R+ov-NC, H/R+si-YBX1+miR-133 inhibitor, and H/R+ ov-YBX1+miR-133 inhibitor-induced EPC-derived exosomes. b - h The bar graph represents quantification of endothelial markers CD31 ( b ), VE-cadherin ( c ), and vWF ( d ) and fibrosis markers alpha-SMA ( e ), N-cadherin ( f ), vimentin ( g ), and collagen I ( h ) expression per group. *** P < 0.001

- Submitted by
- Invitrogen Antibodies (provider)
- Main image

- Experimental details
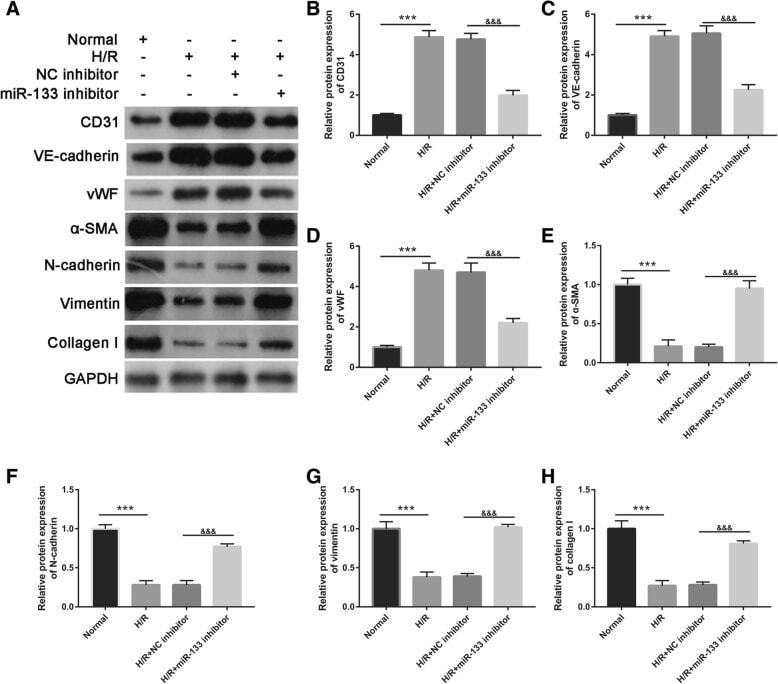
- Fig. 5 Intercellular transfer of miR-133 by H/R-induced EPC-derived exosomes inhibits fibroblast MEndoT. a Endothelial markers CD31, VE-cadherin, and vWF and fibrosis markers alpha-SMA, N-cadherin, vimentin, and collagen I were measured by western blotting in fibroblasts treated with normal cultured EPC-derived exosomes, H/R-induced EPC-derived exosomes, H/R+NC inhibitor-induced EPC-derived exosomes, and H/R+miR-133 inhibitor-induced EPC-derived exosomes. b - h The bar graph represents quantification of endothelial markers CD31 ( b ), VE-cadherin ( c ), and Vwf ( d ) and fibrosis markers alpha-SMA ( e ), N-cadherin ( f ), vimentin ( g ), and collagen I ( h ) expression per group. *** P < 0.001, &&& P < 0.001
- Submitted by
- Invitrogen Antibodies (provider)
- Main image

- Experimental details
- FIG. 4. IHC comparison of protein expression between bioprinted tissues and native human skin show comparable morphology. Tight junction proteins ZO-1, Claudin I, and E-Cadherin. Epidermal differentiation proteins Keratin 1, Filaggrin, and Cytokeratin 15. ECM proteins Collagen I and Collagen VII and cell proliferation marker Ki67. Scale bar, 100 mum. ECM, extracellular matrix; IHC, immunohistochemistry.

- Submitted by
- Invitrogen Antibodies (provider)
- Main image

- Experimental details
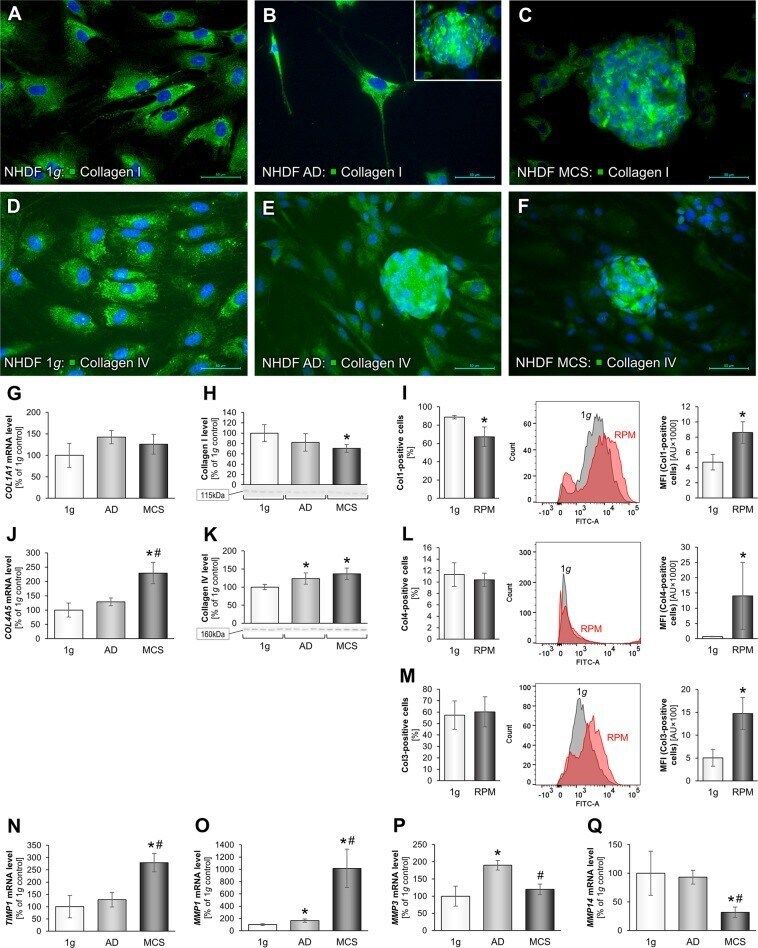
- Figure 7 Alterations in collagen levels of juvenile NDHF cells following a 3-day exposure to microgravity: Immunofluorescence images of 1 g -control cells, RPM-AD and RPM-MCS of collagen-I ( A - C ) and collagen-IV ( D - F ). Transcriptional and translational collagen type I analysis: Quantitative gene expression levels of COL1A1 ( G ), intracellular collagen-I levels ( H ) and flow cytometric analysis of collagen type I-labeled cells ( I ). Quantitative gene expression levels of COL4A5 ( J ), intracellular collagen-I levels ( K ) and flow cytometric analysis of fibronectin-labeled cells ( L ). Flow cytometric analysis of collagen type III-labeled cells ( M ). Quantitative gene expression levels of TIMP1 ( N ), MMP1 ( O ), MMP3 ( P ) and MMP14 ( Q ). Full-length blots of cropped Western blot images are presented in Supplementary Fig. S6 . *p < 0.05 1 g vs. RPM; # p < 0.05 AD vs. MCS. Scale bars: 50 um.
- Submitted by
- Invitrogen Antibodies (provider)
- Main image
- Experimental details
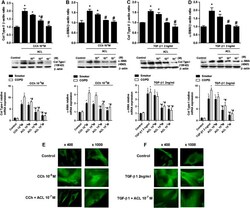
- Figure 2 Carbachol (CCh) and transforming growth factor beta1 (TGF-beta1)-induced collagen type I (col type I) and alpha-smooth muscle actin (alpha-SMA) expression is inhibited by aclidinium (ACL). Human lung fibroblasts from smokers (black bars) or patients with chronic obstructive pulmonary disease (COPD) (white bars) were stimulated with CCh (A, B) or TGF-beta1 (C, D) for 48 h. Aclidinium was added to the medium at the indicated concentrations 30 min before CCh (A, B) or TGF-beta1 stimulation (C, D). Total protein and RNA were extracted after the incubation period. The top graphs represent values of densitometry of col type I (A, C) or alpha-SMA (B, D) protein expression relative to beta-actin and normalised to solvent controls. Representative western blots of col type I (A, C) or alpha-SMA (B, D) are shown. The bottom graphs show RT-PCR for col type I (A, C) or alpha-SMA (B, D). (E, F) Fibroblasts were seeded into 12-well plates, each containing a glass coverslip and incubated with CCh (E) or TGF-beta1 (F) in the presence or absence of aclidinium. Cells were then fixed, permeabilised and immunostained with anti-alpha-SMA followed by secondary anti-FITC. Fluorescence images are representative of three independent experiments per condition at x400 and x1000 magnification. Each graph represents the mean of three experiments for western blots and eight experiments for RNA experiments. One-way repeated measures analysis of variance (ANOVA): p

- Submitted by
- Invitrogen Antibodies (provider)
- Main image
- Experimental details
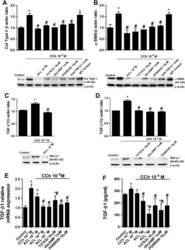
- Figure 3 Carbachol (CCh)-induced expression of collagen type I (col type I) and alpha-smooth muscle actin (alpha-SMA) is partially mediated by transforming growth factor-beta1 (TGF-beta1). Human lung fibroblasts were stimulated with CCh for 48 h. (A, B) Aclidinium (ACL), Rho kinase inhibitor (Y27632), dibutyryl cyclic AMP analogue (dbcAMP), ERK1/2 inhibitor (PD98059), anti-TGF-beta1 antibody (4 mug/ml) or their IgG isotypes were added to the medium 30 min before CCh stimulation. After incubation, total protein was extracted and western blots were performed for col type I (A) and alpha-SMA (B). Graphs from (A) and (B) represent values of densitometry of col type I (A) and alpha-SMA (B) protein expression relative to beta-actin and normalised to solvent controls. Representative western blots show col type I (A) and alpha-SMA (B) protein expression. In other experiments, cells were stimulated with CCh in the presence or absence of ACL (C, E, F), Y27632 (D, E, F), PD98059 (D, E, F) or dbcAMP (D, E, F). After incubation, total protein (C, D), RNA (E) or cell culture supernatants were collected and TGF-beta1 protein (C, D), mRNA (E) as well as the active form of TGF-beta1 present in the culture medium (F) were quantified by western blot, RT-PCR and ELISA, respectively. Each graph represents the mean of three (A-D) or six (E, F) experiments. One-way repeated measures analysis of variance (ANOVA): p
