 Explore
 Validate
 Learn
Learn Flow cytometry
Antibody data
- Antibody Data
- Antigen structure
- References [21]
- Comments [0]
- Validations
- Flow cytometry [1]
- Other assay [29]
Submit
Validation data
Reference
Comment
Report error
- Product number
- 61-7179-42 - Provider product page

- Provider
- Invitrogen Antibodies
- Product name
- IL-17A Monoclonal Antibody (eBio64DEC17), PE-eFluor™ 610, eBioscience™
- Antibody type
- Monoclonal
- Antigen
- Other
- Description
- Description: The eBio64DEC17 antibody reacts with human IL-17A. The eBio64DEC17 antibody is a neutralizing antibody. Interleukin-17A (IL-17A) is a CD4+ T cell-derived cytokine that promotes inflammatory responses in cell lines and is elevated in rheumatoid arthritis, asthma, multiple sclerosis, psoriasis, and transplant rejection. The cDNA encoding human IL-17A was isolated from a library of CD4+ T cells; the encoded protein exhibits 72 percent amino acid identity with HVS13, an open reading frame from a T lymphotropic Herpesvirus saimiri, and 63 percent with mouse CTLA-8 (cytotoxic T-lymphocyte associated antigen-8). Human IL-17A exists as glycosylated 20-30 kD homodimers. High levels of IL-17A homodimer are produced by activated peripheral blood CD4+ T-cells. IL-17A enhances expression of the intracellular adhesion molecule-1 (ICAM-1) in human fibroblasts. Human IL-17A also stimulates epithelial, endothelial, or fibroblastic cells to secrete IL-6, IL-8, G-CSF, and PGE2. In the presence of human IL-17A, fibroblasts can sustain the proliferation of CD34+ hematopoietic progenitors and induce maturation into neutrophils. Mouse, rat, and human IL-17A can induce IL-6 secretion in mouse stromal cells, indicating that all homologs can recognize the mouse IL-17A receptor. IL-23-dependent, IL-17A-producing CD4+ T cells (Th-17 cells) have been identified as a unique subset of Th cells that develops along a pathway that is distinct from the Th1- and Th2- cell differentiation pathways. The hallmark effector molecules of Th1 and Th2 cells, e.g., IFN gamma and IL-4, have each been found to negatively regulate the generation of these Th-17 cells. Intracellular staining by eBio64DEC17 antibody identifies the same cell population as the eBio64CAP17 antibody, as can be seen in co-staining experiments using both antibodies. Applications Reported: This eBio64DEC17 antibody has been reported for use in intracellular staining followed by flow cytometric analysis. Applications Tested: This eBio64DEC17 antibody has been pre-titrated and tested by intracellular staining and flow cytometric analysis of stimulated normal human peripheral blood cells using the Intracellular Fixation and Permeabilization Buffer Set (Product # 88-8824-00) and protocol. Please refer to Best Protocols: Protocol A: Two step protocol for (cytoplasmic) intraceelular proteins located under the Resources Tab online. This can be used at 5 µL (0.25 µg) per test. A test is defined as the amount (µg) of antibody that will stain a cell sample in a final volume of 100 µL. Cell number should be determined empirically but can range from 10^5 to 10^8 cells/test. PE-eFluor® 610 can be excited with laser lines from 488-561 nm and emits at 607 nm. We recommend using a 610/20 band pass filter (equivalent to PE-Texas Red®). Please make sure that your instrument is capable of detecting this fluorochome. Light sensitivity: This tandem dye is sensitive to photo-induced oxidation. Please protect this vial and stained samples from light. Fixation: Samples can be stored in IC Fixation Buffer (Product # 00-8222-49) (100 µL of cell sample + 100 µL of IC Fixation Buffer) or 1-step Fix/Lyse Solution (Product # 00-5333-57) for up to 3 days in the dark at 4°C with minimal impact on brightness and FRET efficiency/compensation. Some generalizations regarding fluorophore performance after fixation can be made, but clone specific performance should be determined empirically. Excitation: 488-561 nm; Emission: 607 nm; Laser: Blue Laser, Green Laser, Yellow-Green Laser. Filtration: 0.2 µm post-manufacturing filtered.
- Reactivity
- Human
- Host
- Mouse
- Isotype
- IgG
- Antibody clone number
- eBio64DEC17
- Vial size
- 100 Tests
- Concentration
- 5 µL/Test
- Storage
- 4° C, store in dark, DO NOT FREEZE!
Submitted references Small molecule allosteric inhibitors of RORγt block Th17-dependent inflammation and associated gene expression in vivo.
YY1 regulation by miR-124-3p promotes Th17 cell pathogenicity through interaction with T-bet in rheumatoid arthritis.
FABP4 facilitates inflammasome activation to induce the Treg/Th17 imbalance in preeclampsia via forming a positive feedback with IL-17A.
Baricitinib treatment resolves lower-airway macrophage inflammation and neutrophil recruitment in SARS-CoV-2-infected rhesus macaques.
Baricitinib treatment resolves lower airway inflammation and neutrophil recruitment in SARS-CoV-2-infected rhesus macaques.
Senolytics prevent mt-DNA-induced inflammation and promote the survival of aged organs following transplantation.
CXCL4 is a novel inducer of human Th17 cells and correlates with IL-17 and IL-22 in psoriatic arthritis.
Accumulation of T-helper 22 cells, interleukin-22 and myeloid-derived suppressor cells promotes gastric cancer progression in elderly patients.
Transcriptional signature of human pro-inflammatory T(H)17 cells identifies reduced IL10 gene expression in multiple sclerosis.
Berberine exerts an anti-inflammatory role in ocular Behcet's disease.
Single-cell profiling reveals GPCR heterogeneity and functional patterning during neuroinflammation.
Enhancing the toolbox to study IL-17A in cattle and sheep.
CD16(+) Monocyte Subset Was Enriched and Functionally Exacerbated in Driving T-Cell Activation and B-Cell Response in Systemic Lupus Erythematosus.
Interaction among activated lymphocytes and mesenchymal cells through podoplanin is critical for a high IL-17 secretion.
Interleukin-25 Mediates Transcriptional Control of PD-L1 via STAT3 in Multipotent Human Mesenchymal Stromal Cells (hMSCs) to Suppress Th17 Responses.
An ACT1 mutation selectively abolishes interleukin-17 responses in humans with chronic mucocutaneous candidiasis.
Increased frequencies of Th22 cells as well as Th17 cells in the peripheral blood of patients with ankylosing spondylitis and rheumatoid arthritis.
Gain-of-function human STAT1 mutations impair IL-17 immunity and underlie chronic mucocutaneous candidiasis.
Interleukin-12 is the optimum cytokine to expand human Th17 cells in vitro.
Interleukins 1beta and 6 but not transforming growth factor-beta are essential for the differentiation of interleukin 17-producing human T helper cells.
Distinct regulation of interleukin-17 in human T helper lymphocytes.
Saenz SA, Local A, Carr T, Shakya A, Koul S, Hu H, Chourb L, Stedman J, Malley J, D'Agostino LA, Shanmugasundaram V, Malona J, Schwartz CE, Beebe L, Clements M, Rajaraman G, Cho J, Jiang L, Dubrovskiy A, Kreilein M, Shimanovich R, Hamann LG, Escoubet L, Ellis JM
PloS one 2021;16(11):e0248034
PloS one 2021;16(11):e0248034
YY1 regulation by miR-124-3p promotes Th17 cell pathogenicity through interaction with T-bet in rheumatoid arthritis.
Lin J, Tang J, Lin J, He Y, Yu Z, Jiang R, Yang B, Ou Q
JCI insight 2021 Nov 22;6(22)
JCI insight 2021 Nov 22;6(22)
FABP4 facilitates inflammasome activation to induce the Treg/Th17 imbalance in preeclampsia via forming a positive feedback with IL-17A.
Chang GP, Yang XL, Liu W, Lin S, Yang SL, Zhao MY
Molecular therapy. Nucleic acids 2021 Jun 4;24:743-754
Molecular therapy. Nucleic acids 2021 Jun 4;24:743-754
Baricitinib treatment resolves lower-airway macrophage inflammation and neutrophil recruitment in SARS-CoV-2-infected rhesus macaques.
Hoang TN, Pino M, Boddapati AK, Viox EG, Starke CE, Upadhyay AA, Gumber S, Nekorchuk M, Busman-Sahay K, Strongin Z, Harper JL, Tharp GK, Pellegrini KL, Kirejczyk S, Zandi K, Tao S, Horton TR, Beagle EN, Mahar EA, Lee MYH, Cohen J, Jean SM, Wood JS, Connor-Stroud F, Stammen RL, Delmas OM, Wang S, Cooney KA, Sayegh MN, Wang L, Filev PD, Weiskopf D, Silvestri G, Waggoner J, Piantadosi A, Kasturi SP, Al-Shakhshir H, Ribeiro SP, Sekaly RP, Levit RD, Estes JD, Vanderford TH, Schinazi RF, Bosinger SE, Paiardini M
Cell 2021 Jan 21;184(2):460-475.e21
Cell 2021 Jan 21;184(2):460-475.e21
Baricitinib treatment resolves lower airway inflammation and neutrophil recruitment in SARS-CoV-2-infected rhesus macaques.
Hoang TN, Pino M, Boddapati AK, Viox EG, Starke CE, Upadhyay AA, Gumber S, Busman-Sahay K, Strongin Z, Harper JL, Tharp GK, Pellegrini KL, Kirejczyk S, Zandi K, Tao S, Horton TR, Beagle EN, Mahar EA, Lee MY, Cohen J, Jean SM, Wood JS, Connor-Stroud F, Stammen RL, Delmas OM, Wang S, Cooney KA, Sayegh MN, Wang L, Weiskopf D, Filev PD, Waggoner J, Piantadosi A, Kasturi SP, Al-Shakhshir H, Ribeiro SP, Sekaly RP, Levit RD, Estes JD, Vanderford TH, Schinazi RF, Bosinger SE, Paiardini M
bioRxiv : the preprint server for biology 2020 Sep 16;
bioRxiv : the preprint server for biology 2020 Sep 16;
Senolytics prevent mt-DNA-induced inflammation and promote the survival of aged organs following transplantation.
Iske J, Seyda M, Heinbokel T, Maenosono R, Minami K, Nian Y, Quante M, Falk CS, Azuma H, Martin F, Passos JF, Niemann CU, Tchkonia T, Kirkland JL, Elkhal A, Tullius SG
Nature communications 2020 Aug 27;11(1):4289
Nature communications 2020 Aug 27;11(1):4289
CXCL4 is a novel inducer of human Th17 cells and correlates with IL-17 and IL-22 in psoriatic arthritis.
Affandi AJ, Silva-Cardoso SC, Garcia S, Leijten EFA, van Kempen TS, Marut W, van Roon JAG, Radstake TRDJ
European journal of immunology 2018 Mar;48(3):522-531
European journal of immunology 2018 Mar;48(3):522-531
Accumulation of T-helper 22 cells, interleukin-22 and myeloid-derived suppressor cells promotes gastric cancer progression in elderly patients.
Chen X, Wang Y, Wang J, Wen J, Jia X, Wang X, Zhang H
Oncology letters 2018 Jul;16(1):253-261
Oncology letters 2018 Jul;16(1):253-261
Transcriptional signature of human pro-inflammatory T(H)17 cells identifies reduced IL10 gene expression in multiple sclerosis.
Hu D, Notarbartolo S, Croonenborghs T, Patel B, Cialic R, Yang TH, Aschenbrenner D, Andersson KM, Gattorno M, Pham M, Kivisakk P, Pierre IV, Lee Y, Kiani K, Bokarewa M, Tjon E, Pochet N, Sallusto F, Kuchroo VK, Weiner HL
Nature communications 2017 Nov 17;8(1):1600
Nature communications 2017 Nov 17;8(1):1600
Berberine exerts an anti-inflammatory role in ocular Behcet's disease.
Yang Y, Wang Q, Xie M, Liu P, Qi X, Liu X, Li Z
Molecular medicine reports 2017 Jan;15(1):97-102
Molecular medicine reports 2017 Jan;15(1):97-102
Single-cell profiling reveals GPCR heterogeneity and functional patterning during neuroinflammation.
Tischner D, Grimm M, Kaur H, Staudenraus D, Carvalho J, Looso M, Günther S, Wanke F, Moos S, Siller N, Breuer J, Schwab N, Zipp F, Waisman A, Kurschus FC, Offermanns S, Wettschureck N
JCI insight 2017 Aug 3;2(15)
JCI insight 2017 Aug 3;2(15)
Enhancing the toolbox to study IL-17A in cattle and sheep.
Wattegedera SR, Corripio-Miyar Y, Pang Y, Frew D, McNeilly TN, Palarea-Albaladejo J, McInnes CJ, Hope JC, Glass EJ, Entrican G
Veterinary research 2017 Apr 8;48(1):20
Veterinary research 2017 Apr 8;48(1):20
CD16(+) Monocyte Subset Was Enriched and Functionally Exacerbated in Driving T-Cell Activation and B-Cell Response in Systemic Lupus Erythematosus.
Zhu H, Hu F, Sun X, Zhang X, Zhu L, Liu X, Li X, Xu L, Shi L, Gan Y, Su Y
Frontiers in immunology 2016;7:512
Frontiers in immunology 2016;7:512
Interaction among activated lymphocytes and mesenchymal cells through podoplanin is critical for a high IL-17 secretion.
Noack M, Ndongo-Thiam N, Miossec P
Arthritis research & therapy 2016 Jun 23;18:148
Arthritis research & therapy 2016 Jun 23;18:148
Interleukin-25 Mediates Transcriptional Control of PD-L1 via STAT3 in Multipotent Human Mesenchymal Stromal Cells (hMSCs) to Suppress Th17 Responses.
Wang WB, Yen ML, Liu KJ, Hsu PJ, Lin MH, Chen PM, Sudhir PR, Chen CH, Chen CH, Sytwu HK, Yen BL
Stem cell reports 2015 Sep 8;5(3):392-404
Stem cell reports 2015 Sep 8;5(3):392-404
An ACT1 mutation selectively abolishes interleukin-17 responses in humans with chronic mucocutaneous candidiasis.
Boisson B, Wang C, Pedergnana V, Wu L, Cypowyj S, Rybojad M, Belkadi A, Picard C, Abel L, Fieschi C, Puel A, Li X, Casanova JL
Immunity 2013 Oct 17;39(4):676-86
Immunity 2013 Oct 17;39(4):676-86
Increased frequencies of Th22 cells as well as Th17 cells in the peripheral blood of patients with ankylosing spondylitis and rheumatoid arthritis.
Zhang L, Li YG, Li YH, Qi L, Liu XG, Yuan CZ, Hu NW, Ma DX, Li ZF, Yang Q, Li W, Li JM
PloS one 2012;7(4):e31000
PloS one 2012;7(4):e31000
Gain-of-function human STAT1 mutations impair IL-17 immunity and underlie chronic mucocutaneous candidiasis.
Liu L, Okada S, Kong XF, Kreins AY, Cypowyj S, Abhyankar A, Toubiana J, Itan Y, Audry M, Nitschke P, Masson C, Toth B, Flatot J, Migaud M, Chrabieh M, Kochetkov T, Bolze A, Borghesi A, Toulon A, Hiller J, Eyerich S, Eyerich K, Gulácsy V, Chernyshova L, Chernyshov V, Bondarenko A, Grimaldo RM, Blancas-Galicia L, Beas IM, Roesler J, Magdorf K, Engelhard D, Thumerelle C, Burgel PR, Hoernes M, Drexel B, Seger R, Kusuma T, Jansson AF, Sawalle-Belohradsky J, Belohradsky B, Jouanguy E, Bustamante J, Bué M, Karin N, Wildbaum G, Bodemer C, Lortholary O, Fischer A, Blanche S, Al-Muhsen S, Reichenbach J, Kobayashi M, Rosales FE, Lozano CT, Kilic SS, Oleastro M, Etzioni A, Traidl-Hoffmann C, Renner ED, Abel L, Picard C, Maródi L, Boisson-Dupuis S, Puel A, Casanova JL
The Journal of experimental medicine 2011 Aug 1;208(8):1635-48
The Journal of experimental medicine 2011 Aug 1;208(8):1635-48
Interleukin-12 is the optimum cytokine to expand human Th17 cells in vitro.
Nady S, Ignatz-Hoover J, Shata MT
Clinical and vaccine immunology : CVI 2009 Jun;16(6):798-805
Clinical and vaccine immunology : CVI 2009 Jun;16(6):798-805
Interleukins 1beta and 6 but not transforming growth factor-beta are essential for the differentiation of interleukin 17-producing human T helper cells.
Acosta-Rodriguez EV, Napolitani G, Lanzavecchia A, Sallusto F
Nature immunology 2007 Sep;8(9):942-9
Nature immunology 2007 Sep;8(9):942-9
Distinct regulation of interleukin-17 in human T helper lymphocytes.
Chen Z, Tato CM, Muul L, Laurence A, O'Shea JJ
Arthritis and rheumatism 2007 Sep;56(9):2936-46
Arthritis and rheumatism 2007 Sep;56(9):2936-46
No comments: Submit comment
Supportive validation
- Submitted by
- Invitrogen Antibodies (provider)
- Main image

- Experimental details
- Normal human peripheral blood lymphocytes were stimulated with Cell Stimulation Cocktail (Product # 00-4975-03) in the presence of Protein Transport Inhibitor Cocktail (Product # 00-4980-03). Cells were fixed and stained intracellularly with Anti-Human CD4 APC (Product # 17-0049-42) and Mouse IgG1 K Isotype Control PE-eFluor® 610 (Product # 61-4714-82) (left) or Anti-Human IL-17A PE-eFluor® 610 (right) using the Fixation and Permeabilization Buffers set (Product # 88-8824-00). Viable cells the lymphocyte gate, as determined by Fixable Viability Dye eFluor® 450 (Product # 65-0863-14), were used for analysis.

Supportive validation
- Submitted by
- Invitrogen Antibodies (provider)
- Main image

- Experimental details
- NULL

- Submitted by
- Invitrogen Antibodies (provider)
- Main image

- Experimental details
- NULL

- Submitted by
- Invitrogen Antibodies (provider)
- Main image

- Experimental details
- NULL

- Submitted by
- Invitrogen Antibodies (provider)
- Main image

- Experimental details
- NULL

- Submitted by
- Invitrogen Antibodies (provider)
- Main image

- Experimental details
- NULL

- Submitted by
- Invitrogen Antibodies (provider)
- Main image

- Experimental details
- NULL

- Submitted by
- Invitrogen Antibodies (provider)
- Main image

- Experimental details
- Figure 1. Effect of BBR on PBMC IL-17 production and cell viability. (A) The expression of IL-17 in PBMCs derived from HC (n=6) and patients with active OBD (n=6) was significantly decreased in the presence of BBR (5 uM) compared with DMSO, as determined by flow cytometry analysis. (B) No significant difference in PBMC cell viability was observed between HC (n=6) and OBD (n=6) groups. Data are presented as the mean +- standard deviation. BBR, berberine; IL-17, interleukin 17; PBMC, peripheral blood mononuclear cells; HC, healthy control; OBD, ocular Behcet's disease; DMSO, dimethyl sulfoxide.

- Submitted by
- Invitrogen Antibodies (provider)
- Main image

- Experimental details
- Figure 4 Evaluation of commercial antibodies for the intracellular detection of recombinant bovine and ovine IL-17A. The eight commercial antibodies listed in Table 1 were tested against fixed, permeabilised untransfected (UTF) CHO cells and CHO cells transfected with cDNA encoding bovIL-17A or ovIL-17A for their capacity to detect intracellular recombinant IL-17A by flow cytometry. Results are shown for one polyclonal antibody (pab) produced against bovIL-17A ( A ) and seven monoclonal antibodies (mabs) produced against human or mouse IL-17A ( B - D ). Profiles of the relevant control antibodies listed in Table 2 are included in the overlapping histograms. Events were acquired on the MacsQuant according to the gating strategy described previously (in brief) and shown in Additional file 2 . Line colours representing different antibody treatments are given in parentheses: A Primary rabbit anti-bovine IL-17A pab PB0274B-100 at 1 mug/mL (A.1, red) or negative control primary anti-bovine CD34 pab (in-house) at an estimated 1 mug/mL equivalent (a, black) then detected with a secondary goat anti-rabbit alexafluor 488 at 1 mug/mL; B Directly conjugated mouse anti-human IL-17A eBio64DEC17-phycoerythrin (PE) mab (IgG1) at 2.5 mug/mL (B.1, red) and control IgG1 VPM21 mab (in-house) at an estimated 2.5 mug/mL equivalent (b, black) and detected with goat anti-mouse PE at 1 mug/mL; C Primary mouse anti-human IL-17A mabs MT44.6 (C.1, blue), MT241 (C.2, green), MT2770 (C.3, brown) and MT504

- Submitted by
- Invitrogen Antibodies (provider)
- Main image

- Experimental details
- Figure 5 Intracellular expression of IL-17A and IFN-gamma by activated bovine T cell subsets. PBMC from four cattle were stimulated with phorbol 12-myristate 13 acetate, ionomycin and brefeldin A in RPMI culture medium for 4 h. Cells were harvested and stained for viability and with mabs specific for cell-surface phenotypic markers and intracellular cytokines as described in Table 3 and "" Expression of intracellular IL-17A and IFN-gamma by bovine and ovine T cell subsets section "". Cells were stained for CD4 with mab CC8-PE at 1:20 dilution ( A , D ), for CD8beta with mab CC58-PE at 1:20 dilution ( B , D ) and for WC-1 (gammadelta T cells) with mab CC15-PE at 1:200 ( C , E ). Intracellular cytokine staining for IL-17A was conducted using mab eBioDEC17-APC at a 1:20 dilution ( A - C ) and for IFN-gamma using mab CC302-Alexafluor 647 at a 1:200 dilution ( D - F ). Data are shown for PBMC from one representative animal of four.

- Submitted by
- Invitrogen Antibodies (provider)
- Main image

- Experimental details
- Figure 6 Intracellular expression of IL-17A and IFN-gamma by activated ovine T cell subsets. PBMC from four sheep were stimulated with phorbol 12-myristate 13 acetate, ionomycin and brefeldin A in RPMI culture medium for 4 h. Cells were harvested and stained for viability and with mabs specific for cell-surface phenotypic markers and intracellular cytokines as described in Table 3 and "" Expression of intracellular IL-17A and IFN-gamma by bovine and ovine T cell subsets section "". Cells were then stained for CD4 with mab 44.38-PE at 1:20 dilution ( A , D ), CD8beta with mab CC58-PE at 1:20 dilution ( B , D ) and WC-1 (gammadelta) with mab CC15-PE at 1:200 ( C , E ). Intracellular cytokine staining for IL-17A was conducted using mab eBio64DEC17-APC a 1:20 dilution ( A - C ) and for IFN-gamma using mab CC302-alexafluor 647 at a 1:200 dilution ( D - F ). Data shown is for one representative animal out of four.

- Submitted by
- Invitrogen Antibodies (provider)
- Main image

- Experimental details
- Additional file 2. Gating strategy used for the evaluation of commercial antibodies to bind intracellular recombinant bovine and ovine IL-17A in fixed cells. Cells were acquired for flow cytometric analyses using the MacsQuant flow cytometer and analysed using the MacsQuantify Software. 20 000-50 000 events were collected and the following gating strategy was followed. Cells in the plot of Forward Scatter-Area (FSC-A) against the high dynamic range over time (HDR-T) are gated in P1 to exclude any non-specific artefacts ( A ). The P1/P2 gate represents Side Scatter-Area (SSC-A) plotted against FSC-A set to identify the main cell population and exclude debris ( B ). Single cells were gated (P1/P2/P3) using FSC-Height (H) vs FSC-A for doublet discrimination ( C ). Finally, the cells of interest were identified in the phycoerythrin or alexafluor 488 channel vs SSC-A (P1/P2/P3/P4) where regions were set using the isotype or equivalent control for each CHO cell line to establish threshold gates ( D ). Overlaying histogram plots of phycoerythrin or alexafluor 488 using (P1/P2/P3) gating strategy selecting for all cells in the region (equivalent to cells above and below region boundary in plot D ) ( E ) were used to compare anti-IL-17A antibodies with appropriate isotype or equivalent controls presented in Figure 4 . Gated percentage numbers above the region boundary (P1/P2/P3/P4) and median fluorescence region values (P1/P2/P3) were measured for each antibody in the relevant fluoroc

- Submitted by
- Invitrogen Antibodies (provider)
- Main image
- Experimental details
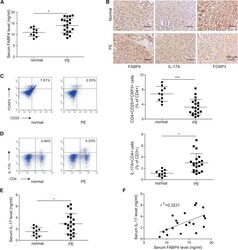
- Figure 1 Elevation of FABP4 is accompanied with Treg/Th17 imbalance in PE (A) The serum level of FABP4 was determined by ELISA (normal pregnant women, n = 10; PE, n = 20). (B) The immunoreactivities of FABP4, IL-17A, and FOXP3 in placental tissues were monitored by IHC analysis. (C and D) The percentages of Treg (C) and Th17 cells (D) in peripheral blood were assessed by FACS (normal pregnant women, n = 10; PE, n = 20). (E) The serum level of IL-17A was determined by ELISA (normal pregnant women, n = 10; PE, n = 20). (F) Pearson's correlation analysis between IL-17A and FABP4 expression. Data were representative images. *p < 0.05.

- Submitted by
- Invitrogen Antibodies (provider)
- Main image

- Experimental details
- Figure 4. Impaired development and function of IL-17- and IL-22-producing T cells ex vivo in patients with AD CMCD and STAT1 mutations. Each symbol represents a value from a healthy control individual (black circles), a patient bearing a STAT1 gain-of-function (GOF) allele (red upright triangles), or a patient bearing one or two STAT1 loss-of-function (LOF) alleles (black upside-down triangles). (A and B) Percentage of CD3 + /IL-17A + (A) and CD3 + /IL-22 + (B) cells, as determined by flow cytometry, in nonadherent PBMCs activated by incubation for 12 h with PMA and ionomycin. (C-E) Secretion of IL-17F (C), IL-17A (D) and IL-22 (E) by whole blood cells, as determined by ELISA, in the absence of stimulation (open symbols) and after stimulation with PMA and ionomycin for 48 h (closed symbols). Horizontal bars represent medians. The p-values for the nonparametric Wilcoxon test, between patients with STAT1 GOF mutations ( n = 18) and controls ( n = 28) and patients with STAT1 LOF mutations ( n = 6) are indicated. All differences between healthy controls and patients with STAT1 LOF alleles were not significant. (F) Secretion of IL-12p70 by whole blood cells, as determined by ELISA, in the absence of stimulation (open symbols), after stimulation with BCG (lightly colored symbols), or BCG + IFN-gamma for 48 h (closed symbols). Horizontal bars represent medians. The p-values for differences between patients with STAT1 GOF mutations ( n = 15) and controls ( n = 23) and patients with S

- Submitted by
- Invitrogen Antibodies (provider)
- Main image

- Experimental details
- Figure 1 CXCL4 increases the percentage of IL-17 producing cells in CD3/CD28-stimulated human CD4 + T cells. CD4 + T cells were isolated from healthy donors and cultured with CD3/CD28 coated Dynabeads and CXCL4 for five days. (A, B) The effect of CXCL4 on IL-17 production by CD4 + T cells was assessed by (A) flow cytometric intracellular cytokine staining and (B) enzyme-linked immunosorbent assay. (C) The percentage of of IFN-gamma-, IL-4- and IL-22-producing CD4 + T cells were measured by flow cytometry. (D, E) The amount of IL-17 producing cells co-expressing IFN-gamma (D) or IL-22 (E) were measured by flow cytometry. Cells were gated on live, single cells. Means (bars) and values from each donor are shown. Data are pooled from two to four independent experiments, except for panel B from 14 independent experiments, with one to four donor samples per experiment. Each dot on the bar graphs represent a single donor and paired t -test was used for statistical analysis. * p

- Submitted by
- Invitrogen Antibodies (provider)
- Main image

- Experimental details
- Figure 2 CXCL4 induces IL-17 producing cells differentiated from naive human CD4 + T cells. Naive CD4 + T cells were purified by fluorescence-activated cell sorting and cultured with CD3/CD28 coated Dynabeads and CXCL4 for seven days. (A, B) The effect of CXCL4 on IL-17 production by CD4 + T cells was assessed by (A) flow cytometric intracellular cytokine staining and (B) enzyme-linked immunosorbent assay. (C) The levels of IFN-gamma-, IL-4-, IL-22-, and IL-17/IFN-gamma-producing CD4 + T cells were measured by flow cytometry. (D) The amount of IL-17 producing cells co-expressing or IL-22 was measured by flow cytometry. Cells were gated on live, single cells. Means (bars) and values from each donor are shown. Data are pooled from four to 10 independent experiments, with one to two donor samples per experiment. Each dot on the bar graphs represents a single donor and paired t -test was used for statistical analysis. * p

- Submitted by
- Invitrogen Antibodies (provider)
- Main image

- Experimental details
- Figure 4 CXCL4-differentiated monocyte-derived dendritic cells enhance pro-inflammatory cytokine production and proliferation by CD4 + T cells. Monocytes from healthy donors were isolated and differentiated into dendritic cells in the absence or presence of CXCL4 (moDCs or CXCL4-moDCs). moDCs were then co-cultured with autologous CD4 + T cells in the presence of superantigen from Staphylococcal Enterotoxin B (SEB) for three days and restimulated with PMA and ionomycin. (A-C) Comparison of co-culture with moDC or CXCL4-moDC on IL-17 or IFN-gamma production by CD4 + T cells was assessed by (A, C) intracellular cytokine staining and (B) enzyme-linked immunosorbent assay are shown. (D) Intracellular cytokine staining was performed for the measurement of IL-4 + , IL-10 + , IL-22 + , and IL-17 + IFN-gamma + cells gated on live CD4 + T cells. (E) The amount of IL-17 producing cells co-expressing IL-22 as measured by flow cytometry. (F) CD4 + T cells were labeled with CellTrace Violet prior co-culture and proliferation was analyzed as division index. Cells were gated on live, single, CD4 + T cells. Means (bars) and values from each donor are shown. Data are pooled from two to three independent experiments, with two to three donor samples per experiment. Each dot on the bar graphs represent a single donor and paired t -test was used for statistical analysis. * p

- Submitted by
- Invitrogen Antibodies (provider)
- Main image

- Experimental details
- Figure 1 Increased pTh17 cells have potential relationship with YY1 expression in RA. ( A and B ) Representative images of flow cytometry results for the proportion of CD4 + IL-17A + IFN-gamma + cells and CD4 + IL-17A + GM-CSF + cells in PBMCs of patients with RA and OA as well as HDs. Data presented as mean +- SD ( n = 11). * P < 0.05 (ANOVA). ( C ) The relative gene expression levels of YY1 in PBMCs of patients with RA ( n = 33) and OA ( n = 24) as well as HDs ( n = 32). Data presented as box-and-whisker plot (The line within the box and the bounds of the box represent median and interquartile range, respectively. The whiskers denote the 25th percentile minus 1.5 interquartile range and 75th percentile plus 1.5 interquartile range. The points, which are outside the whisker, represent outliers). *** P < 0.001, **** P < 0.0001 (ANOVA). ( D and E ) Analysis of the correlation of IL-17A or IL-22 mRNA and YY1 mRNA in PBMCs of RA patients ( n = 41, Pearson correlation). ( F ) The relative gene expression levels of YY1 in purified CD4 + T cells of patients with RA ( n = 36) and HD ( n = 18). Data presented as box-and-whisker plot (The meaning of the symbols is the same as C ). *** P < 0.001 (Student's t test). ( G and H ) Analysis of the correlation of IL-17A or IL-22 mRNA and YY1 mRNA in purified CD4 + T cells of RA patients ( n = 36, Pearson correlation).

- Submitted by
- Invitrogen Antibodies (provider)
- Main image

- Experimental details
- Figure 2 YY1 is involved in pTh17 cell differentiation. ( A ) Representative Western blots of YY1 in an ex vivo Th17 subset differentiation system including unpolarized, non-pTh17-polarized, and pTh17-polarized groups (at least 3 independent experiments). ( B ) Representative fluorescence images for transfection efficiency of the sh-YY1 lentivirus (scale bars = 100 mum, at least 3 independent experiments). ( C ) The relative expression levels of YY1 for knockdown effect of the sh-YY1 lentivirus ( n = 3 independent experiments). ( D ) Representative Western blots of YY1 for knockdown effect of the sh-YY1 lentivirus (at least 3 independent experiments). ( E and F ) Representative images of flow cytometry results for the proportion of CD4 + IL-17A + IFN-gamma + cells and CD4 + IL-17A + GM-CSF + cells in the pTh17-polarized group treated with the sh-YY1 lentivirus. All data presented as mean +- SEM ( n = 3 of independent experiments). ** P < 0.01, * P < 0.05 (ANOVA).

- Submitted by
- Invitrogen Antibodies (provider)
- Main image

- Experimental details
- Figure 4 YY1 specifically regulates pTh17 cell differentiation through affecting T-bet. ( A ) Heatmap of clustering analysis of differentially expressed genes of cells treated with the sh-YY1 lentiviruses in pTh17-polarized conditions. ( B ) The relative gene expressions of pTh17-related transcription factors and cytokines in cells from YY1-knockdown pTh17-polarized group. Data presented as mean +- SEM ( n = 6). *** P < 0.001, **** P < 0.0001 (Student's t test). ( C ) Representative Western blots of T-bet in an ex vivo Th17 subset differentiation system including unpolarized, non-pTh17-polarized, and pTh17-polarized (at least 3 independent experiments). ( D and E ) Representative images of flow cytometry results for the proportion of CD4 + IL-17A + IFN-gamma + cells and CD4 + IL-17A + GM-CSF + cells in pTh17-polarized group treated with the sh-YY1 lentivirus or cotransfected with sh-YY1 lentivirus and T-bet-overexpressing lentivirus. Data presented as mean +- SEM ( n = 3 independent experiments). ** P < 0.01, * P < 0.05 (ANOVA). ( F and G ) Representative images of flow cytometry results for the proportion of CD4 + IL-17A + IFN-gamma + cells in Th1-polarized group treated with the sh-YY1 lentivirus. Data presented as mean +- SEM ( n = 3 independent experiments). * P < 0.05 (ANOVA).

- Submitted by
- Invitrogen Antibodies (provider)
- Main image

- Experimental details
- Figure 7 miR-124-3p is involved in the pathogenicity of Th17 cells. ( A and B ) Representative images of flow cytometry results for the proportion of CD4 + IL-17A + IFN-gamma + cells and CD4 + IL-17A + GM-CSF + cells in pTh17-polarized group transfected with miR-124-3p mimics, inhibitors, or control plasmid. Data presented as mean +- SEM ( n = 3 independent experiments). * P < 0.05 (ANOVA). ( C - F ) Analysis of the correlation of miR-124-3p and anti-CCP, RF, CRP, and ESR in purified CD4 + T cells of patients with RA ( n = 36. C , E , and F using Pearson correlation, D using Spearman correlation). ( G ) Sketch of miR-124-3p and YY1 in differentiation of pTh17 cells in RA.

- Submitted by
- Invitrogen Antibodies (provider)
- Main image

- Experimental details
- 10.1371/journal.pone.0248034.g003 Fig 3 RORgammat-mediated inhibition of IL-17A production in human Th17 cell cultures. Schematic of human Th17 differentiation (A) or Th17 maintenance (B) assays. Representative flow cytometry plots of intracellular cytokine staining from cultures from (A) including Th0 cell nonpolarizing condition (C) . IL-17A cytokine production from enriched naive CD4 + T cells from healthy donor PBMC cultured under Th17 cell conditions for 6 days (D) or from enriched human Th17 cells from healthy donor PBMC cultured with IL-23 and IL-1beta, for 4 days (E) , in the presence of the indicated RORgammat inhibitors Compounds 1-3 . Data are normalized to and represented as percent inhibition compared to DMSO controls. Error bars are representative of 4 individual donors, from 2 independent experiments.

- Submitted by
- Invitrogen Antibodies (provider)
- Main image

- Experimental details
- Figure 1 Multipotent Human Mesenchymal Stromal Cells (hMSCs) Suppress Th17 Responses (A-D) Human peripheral blood CD3 + leukocytes (PBLs) (A, representative data; B, pooled data of 17 PBL donors co-cultured with all three hMSC donors) or CD3 + CD4 T cells (C, representative data; D, pooled data of 11 PBL donors co-cultured with all three hMSC donors) were co-cultured without (left) or with (right) hMSCs ex vivo, followed by PMA/ionomycin stimulation for 6 hr. (E-H) IL-17A production in ex-vivo-cultured CD3 + T cells was assessed by intracellular staining. IL-17A and IFN-gamma production in CD3 + PBLs (E, representative data; F, pooled data) or CD3 + CD4 T cells (G, representative data; H, pooled data) without and with co-culture of hMSCs was analyzed by flow cytometry. Representative intracellular staining is shown for IL-17A + IFN-gamma - - CD3 + T cells (R3 region) and IL-17A + IFN-gamma + (R5 region) CD3 + T cells, and pooled data from PBLs (n = 4) or CD4 T cells (n = 4) co-cultured with two hMSC donors (donors A and B) are provided in (F) and (H), respectively. Gray bars represent the percentages of IL-17A + IFN-gamma - - CD3 + T cells, whereas white bars represent the percentages of IL-17A + IFN-gamma + T cells. (I and J) IL-22 production in four donors of CD3 + CD4 T cells (I, representative data; J, pooled data) without and with co-culture of two donors of hMSCs (donors A and B) was assessed by intracellular staining. Cell percentages are denoted in the dotplot quadran

- Submitted by
- Invitrogen Antibodies (provider)
- Main image

- Experimental details
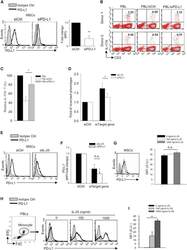
- Figure 3 IL-25 Silencing in hMSCs Reverses Th17 Responses In Vitro and In Vivo (A-D) Freshly isolated human PBLs (A) or CD4 T cells (C) were co-cultured without (left) or with either siCtrl hMSCs (middle) or siIL-25 hMSCs (right) for 3 days, followed by PMA/ionomycin stimulation for 6 hr. IL-17A production in CD3 + T cells was assessed by intracellular staining. Numbers in the top right quadrants represent the percentages of IL-17A-producing CD3 + T cells. Pooled data from PBLs (n = 3) or CD4 T cells (n = 3) and two hMSC donors (donors A and B) are provided in (B) and (D), respectively. Data are shown as mean +- SD. * p < 0.05, ** p < 0.01. (E) Experimental strategy for establishing in vivo inflammatory conditions in wild-type C57BL/6J mice with expansion of Th17 cells and adoptive transfer of hMSCs is shown. (F) On day 3 after LPS (100 mug/mouse) challenge, IL-17A production in activated CD4 T cells in splenocytes from control mice, PBS-treated mice, siCtrl-hMSC-treated mice, or siIL-25-hMSC-treated mice was assessed by intracellular staining. (G and H) Calculated (G) and relative (H) mean percentage of IL-17A-expressing CD4 T cells among control mice, PBS-treated mice, siCtrl-hMSC-treated mice, or siIL-25-hMSC-treated mice (n = 6). Data are shown as mean +- SD. * p < 0.05, ** p < 0.01, *** p < 0.005.

- Submitted by
- Invitrogen Antibodies (provider)
- Main image

- Experimental details
- Figure 4 Exogenous IL-25 Alone Is Insufficient to Significantly Suppress Th17 Responses, with Cell Contact Required as well for hMSC-Mediated Inhibition of Th17 Responses (A) Human CD4 T cells were treated with indicated doses of rhIL-25 for 18 hr, followed by PMA/ionomycin stimulation for 6 hr. IL-17A production in CD3 + T cells was assessed by intracellular staining. Numbers in the top right quadrants represent the percentages of IL-17A-producing CD3 + T cells. (B) Pooled data of five PBL donors are shown. (C) Human CD4 T cells (n = 4) were co-cultured without or with hMSCs (two donors, B and C) in the absence or presence of transwell barriers. (D) Pooled data from healthy donors are shown. Data are shown as mean +- SD. ** p < 0.01; n.s., not significant.

- Submitted by
- Invitrogen Antibodies (provider)
- Main image
- Experimental details
- Figure 5 IL-25 Induces PD-L1 Surface Expression on hMSCs and Human Monocytes (A) PD-L1 in siCtrl MSCs (left) and siPD-L1 MSCs (right) was analyzed by surface staining. (B) Freshly isolated human PBLs were co-cultured without (left) or with siCtrl MSCs (middle) or siPD-L1 MSCs (right) for 3 days, followed by PMA/ionomycin stimulation for 6 hr. IL-17A production in CD3 + T cells was assessed by intracellular staining. Representative data are shown with numbers in the top right quadrants representing the percentages of IL-17A-producing CD3 + T cells. (C) Pooled data from PBLs (n = 4) and two hMSC donors (donors A and B) are shown. (D) Folds of reversed phenotypes of siIL-25 and siPD-L1 are shown. (E) PD-L1 expression on siCtrl hMSCs (left) and siIL-25 hMSCs (right) was assessed by cell surface staining. Filled histograms represent isotype control; unfilled histograms represent PD-L1 antibody staining. (F) Pooled data of PD-L1 expression (indicated by fold change in MFI) on siIL-25 hMSCs and siPD-L1 hMSCs (all three donors) are shown. PD-L1 expression levels were compared between hMSCs silenced for the target gene (IL-25 or PD-L1) and the respective siCtrl. (G) hMSCs were treated with the indicated doses of rhIL-25 for 18 hr and assessed for cell surface PD-L1 expression by cell surface staining. Pooled data (all three donors) are shown in chart to the right with bars representing MFI. (H) Human PBLs were treated with the indicated doses of rhIL-25 for 18 hr and assessed for cell

- Submitted by
- Invitrogen Antibodies (provider)
- Main image

- Experimental details
- Figure 4 CD16 + monocytes promoted T-cell-mediated inflammation in SLE . CD16 + or CD16 - monocytes were cocultured with CD4 + T cells isolated from freshly collected SLE blood or blood bank collected HC blood buffy coat for 5 days in the presence of anti-CD3 (1 mug/mL) and anti-CD28 (1 mug/mL) antibodies and M-CSF (50 ng/mL). Intracellular IFN-gamma, IL-4, and IL-17A expression was detected by flow cytometry after PMA (50 ng/mL), ionomycin (1 mug/mL), and BFA (10 mug/mL) stimulation for 5 h on day 5. The percentage of Treg (CD4 + Foxp3 + ) was also analyzed. Representative pseudocolor dots depicted Th1 (A) , Th2 (B) , Th17 (C) , and Treg (D) frequencies in CD4 + T cells after coculture with each monocyte subset from one patient and one control donor. The proportion of Th1, Th2, Th17, and Treg cells was calculated after coculture of CD4 + T cells with each monocyte. The percentage increases in T-cell subsets in cocultures of monocytes and T cells compared with CD4 + T cells cultured alone were compared between 7 healthy individuals and 10 patients with SLE. Data were expressed as mean +- SD and analyzed by non-parametric paired t test and Mann-Whitney U test. * P < 0.05, ** P < 0.01; NS, no significance.

- Submitted by
- Invitrogen Antibodies (provider)
- Main image

- Experimental details
- Figure 1. Flow cytometric analysis was used to determine the distribution of Th22, Th17 and Th1 cells in EGC, HE and HY ( Fig. 1 ). Flow cytometric analysis of Th22, Th17 and Th1 cells in peripheral whole blood from EGC (n=39), HE (n=32) and HY (n=31). (A) Lymphocytes were gated in P1 using flow cytometry. CD4 + IFN-gamma - lymphocytes were gated in P2 using flow cytometry, and representative results of flow cytometric analyses for (B) Th1 (CD4 + IFN-gamma + ), (C) Th22 (CD4 + IFN-gamma - IL-17 - IL-22 + ) and Th17 (CD4 + IFN-gamma - IL-17 + IL-22 - ) cells in the three groups of subjects are presented. The number of cells stained in EGC, HE and HY in P2 were 2,654, 4,696 and 5,185, respectively. The proportion of (D) Th22, (E) Th17 and (F) Th1 cells in the three groups of subjects. The proportion of (G) Th22 and (H) Th17 cells in peripheral whole blood derived from patients with early (n=13) or advanced (n=26) gastric cancer. The association between the proportion of (I) Th22 and Th17 cells, (J) Th22 and Th1 cells, and (K) Th17 and Th1 cells, in peripheral whole blood of all subjects. *P

- Submitted by
- Invitrogen Antibodies (provider)
- Main image

- Experimental details
- Fig. 1 Dendritic cells from old mice exhibit an activated phenotype and promote Th1 and Th17 T cell responses. Single cell suspensions of lymph nodes and spleens from old and young C57BL/6 mice were labeled with anti-CD11c, anti-CD11b, anti-MHC class II, anti-CD40, anti-CD80, and anti-CD86. a The frequency of CD11b + CD11c + DCs in lymph nodes ( p = 0.0006) and spleens ( p = 0.0023), and b the expression of costimulatory molecules (MHC-II: p = 0.0005/CD40: p < 0.0001/CD80: p = 0.0035/CD86: p = 0.0007) by splenic DCs were assessed by flow cytometry. c Proliferative capacities of CD4 + ( p = 0.0079) and CD8 + T cells ( p = 0.0079) co-cultured with DCs from old and young mice were determined using CFSE dilution and viability assessed using propidium iodide ( d ) CD4 + T cells from young mice were co-cultured with CD11b + CD11c + DCs isolated from young and old mice and ( e ) pro-inflammatory cytokine expression was assessed by flow cytometry (IL-17: p = 0.0002/IFN-gamma: p = 0.0013) and ELISA (Il-17: p = 0.004/IFN-gamma: p = 0.0079); ( n = 7 biologically independent animals), results are representative of at least three independent experiments. Column plots display mean with standard deviation. Statistical significance was determined by using two-tailed Mann-Whitney-test. Asterisks indicate p values * p

- Submitted by
- Invitrogen Antibodies (provider)
- Main image

- Experimental details
- Fig. 6 Senolytics decrease the number of senescent cells, reduce cf-mt-DNA levels, alleviate systemic inflammatory immune response after IRI, and prolong cardiac allograft survival. a Old C57/B6 mice were treated with senolytics (D and Q, or either D or Q in b ) on 3 successive days/week. After 1 month, kidney, heart, and skin were procured, stained, and the percentage of senescent cells assessed as described in Fig. 4 , ( p = 0.0079); Column plots display mean +- SD, ( n = 5 biologically independent animals). b Systemic levels of p16 Ink4a and cf-mt-DNA were measured by real-time PCR and calculated relative to GAPDH expression (old vs. old + D and Q: p = 0.0317); Column plots display mean +- SEM, ( n = 6 biologically independent animals). c Young and old C57BL/6 mice were treated with senolytics for 3 successive days/week for 1 month. Subsequently, IRI was induced in young and old animals; IL-17 and IFN-gamma expression of CD4 + and CD8 + T cells were assessed by flow cytometry (old control vs. old treated: CD4 + IL-17 + ( p = 0.0087)/CD4 + IFN-gamma + ( p = 0.0022)/CD8 + IFN-gamma + ( p = 0.0022); column plots display mean +- SD, ( n = 6 biologically independent animals). d Old and young donor C57BL/6 mice were treated with D and Q or PBS prior to fully mismatched cardiac transplantation and allograft survival was monitored by daily palpation ( p = 0.0012); ( n = 8 biologically independent animals). e Old and young donor C57BL/6 mice were treated with D and Q or PBS prior t
