 Explore
 Validate
 Learn
Learn Western blot
Antibody data
- Antibody Data
- Antigen structure
- References [15]
- Comments [0]
- Validations
- Western blot [5]
- Immunocytochemistry [8]
- Immunohistochemistry [1]
- Flow cytometry [1]
- Chromatin Immunoprecipitation [1]
- Other assay [7]
Submit
Validation data
Reference
Comment
Report error
- Product number
- PA1-861 - Provider product page

- Provider
- Invitrogen Antibodies
- Product name
- HDAC2 Polyclonal Antibody
- Antibody type
- Polyclonal
- Antigen
- Synthetic peptide
- Description
- PA1-861 detects histone deacetylase 2 (HDAC2) from canine, hamster, human, mouse, non-human primate, rat tissues and cells.
- Concentration
- 1 mg/mL
Submitted references Neuronal activity-induced BRG1 phosphorylation regulates enhancer activation.
Effects of Manipulation of Noradrenergic Activities on the Expression of Dopaminergic Phenotypes in Aged Rat Brains.
Class I lysine deacetylases promote glucocorticoid-induced transcriptional repression through functional interaction with LSD1.
Loss of Asxl2 leads to myeloid malignancies in mice.
Histone deacetylases meet microRNA-associated MMP-9 expression regulation in glucocorticoid-sensitive and -resistant cell lines.
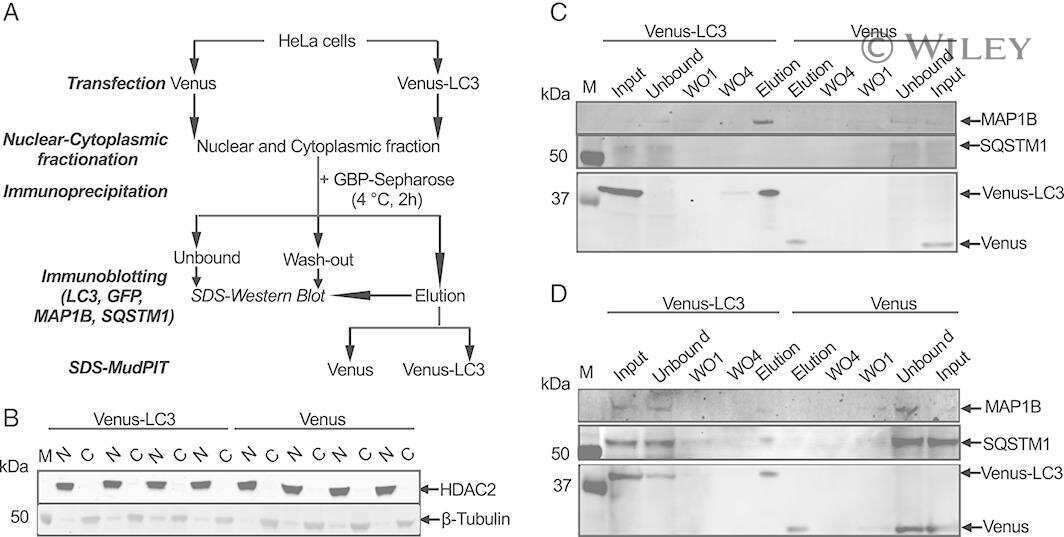
Nuclear LC3 Associates with Slowly Diffusing Complexes that Survey the Nucleolus.
RNA-dependent dynamic histone acetylation regulates MCL1 alternative splicing.
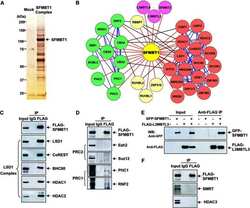
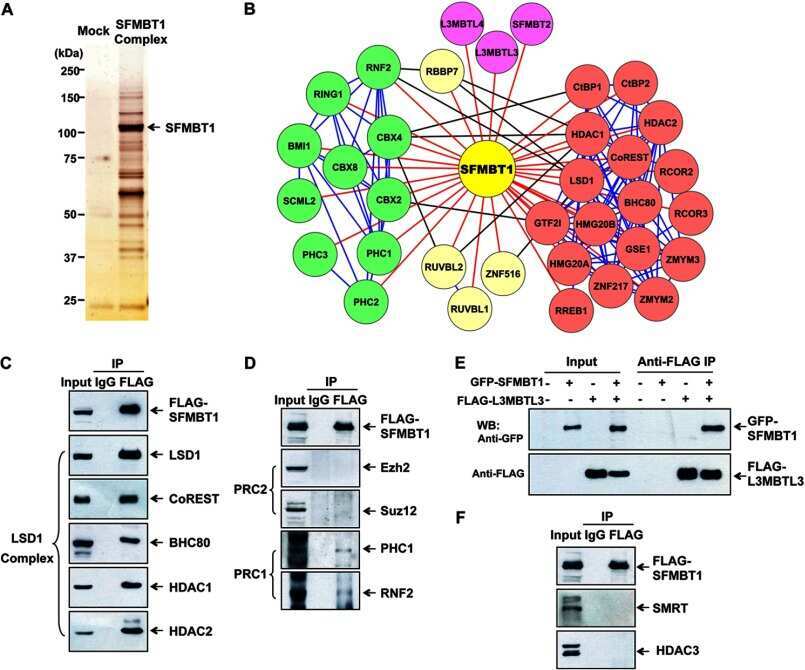
Proteomic and functional analyses reveal the role of chromatin reader SFMBT1 in regulating epigenetic silencing and the myogenic gene program.
Protein kinase CK2 regulates the dimerization of histone deacetylase 1 (HDAC1) and HDAC2 during mitosis.
Differential intranuclear organization of transcription factors Sp1 and Sp3.
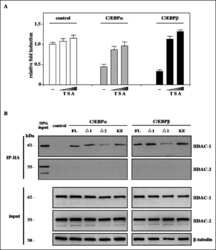
Transcriptional repression of peroxisome proliferator-activated receptor beta/delta in murine keratinocytes by CCAAT/enhancer-binding proteins.
Modification of de novo DNA methyltransferase 3a (Dnmt3a) by SUMO-1 modulates its interaction with histone deacetylases (HDACs) and its capacity to repress transcription.
The transcriptional repressor Sp3 is associated with CK2-phosphorylated histone deacetylase 2.
Effect of estradiol on histone acetylation dynamics in human breast cancer cells.
Ligand-induced recruitment of a histone deacetylase in the negative-feedback regulation of the thyrotropin beta gene.
Kim B, Luo Y, Zhan X, Zhang Z, Shi X, Yi J, Xuan Z, Wu J
Cell reports 2021 Jul 13;36(2):109357
Cell reports 2021 Jul 13;36(2):109357
Effects of Manipulation of Noradrenergic Activities on the Expression of Dopaminergic Phenotypes in Aged Rat Brains.
Zeng F, Fan Y, Brown RW, Drew Gill W, Price JB, Jones TC, Zhu MY
ASN neuro 2021 Jan-Dec;13:17590914211055064
ASN neuro 2021 Jan-Dec;13:17590914211055064
Class I lysine deacetylases promote glucocorticoid-induced transcriptional repression through functional interaction with LSD1.
Patrick NM, Griggs CA, Icenogle AL, Gilpatrick MM, Kadiyala V, Jaime-Frias R, Smith CL
The Journal of steroid biochemistry and molecular biology 2017 Mar;167:1-13
The Journal of steroid biochemistry and molecular biology 2017 Mar;167:1-13
Loss of Asxl2 leads to myeloid malignancies in mice.
Li J, He F, Zhang P, Chen S, Shi H, Sun Y, Guo Y, Yang H, Man N, Greenblatt S, Li Z, Guo Z, Zhou Y, Wang L, Morey L, Williams S, Chen X, Wang QT, Nimer SD, Yu P, Wang QF, Xu M, Yang FC
Nature communications 2017 Jun 8;8:15456
Nature communications 2017 Jun 8;8:15456
Histone deacetylases meet microRNA-associated MMP-9 expression regulation in glucocorticoid-sensitive and -resistant cell lines.
Hentati-Kallel M, Le Jan S, Bernard P, Antonicelli F, Trussardi-Régnier A
International journal of oncology 2017 Feb;50(2):717-726
International journal of oncology 2017 Feb;50(2):717-726
Nuclear LC3 Associates with Slowly Diffusing Complexes that Survey the Nucleolus.
Kraft LJ, Manral P, Dowler J, Kenworthy AK
Traffic (Copenhagen, Denmark) 2016 Apr;17(4):369-99
Traffic (Copenhagen, Denmark) 2016 Apr;17(4):369-99
RNA-dependent dynamic histone acetylation regulates MCL1 alternative splicing.
Khan DH, Gonzalez C, Cooper C, Sun JM, Chen HY, Healy S, Xu W, Smith KT, Workman JL, Leygue E, Davie JR
Nucleic acids research 2014 Feb;42(3):1656-70
Nucleic acids research 2014 Feb;42(3):1656-70
Proteomic and functional analyses reveal the role of chromatin reader SFMBT1 in regulating epigenetic silencing and the myogenic gene program.
Lin S, Shen H, Li JL, Tang S, Gu Y, Chen Z, Hu C, Rice JC, Lu J, Wu L
The Journal of biological chemistry 2013 Mar 1;288(9):6238-47
The Journal of biological chemistry 2013 Mar 1;288(9):6238-47
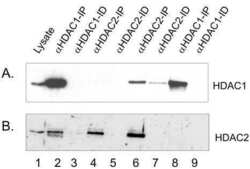
Protein kinase CK2 regulates the dimerization of histone deacetylase 1 (HDAC1) and HDAC2 during mitosis.
Khan DH, He S, Yu J, Winter S, Cao W, Seiser C, Davie JR
The Journal of biological chemistry 2013 Jun 7;288(23):16518-16528
The Journal of biological chemistry 2013 Jun 7;288(23):16518-16528
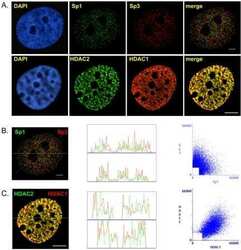
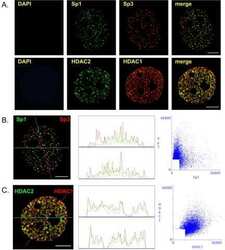
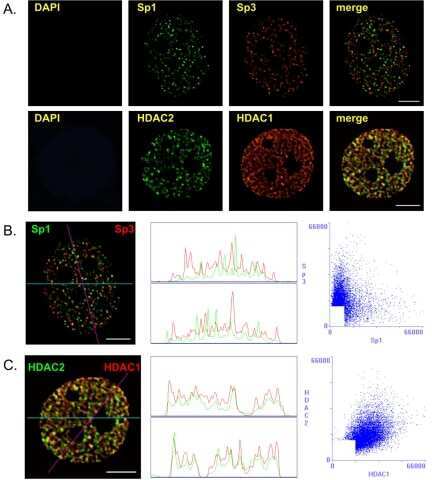
Differential intranuclear organization of transcription factors Sp1 and Sp3.
He S, Sun JM, Li L, Davie JR
Molecular biology of the cell 2005 Sep;16(9):4073-83
Molecular biology of the cell 2005 Sep;16(9):4073-83
Transcriptional repression of peroxisome proliferator-activated receptor beta/delta in murine keratinocytes by CCAAT/enhancer-binding proteins.
Di-Poï N, Desvergne B, Michalik L, Wahli W
The Journal of biological chemistry 2005 Nov 18;280(46):38700-10
The Journal of biological chemistry 2005 Nov 18;280(46):38700-10
Modification of de novo DNA methyltransferase 3a (Dnmt3a) by SUMO-1 modulates its interaction with histone deacetylases (HDACs) and its capacity to repress transcription.
Ling Y, Sankpal UT, Robertson AK, McNally JG, Karpova T, Robertson KD
Nucleic acids research 2004;32(2):598-610
Nucleic acids research 2004;32(2):598-610
The transcriptional repressor Sp3 is associated with CK2-phosphorylated histone deacetylase 2.
Sun JM, Chen HY, Moniwa M, Litchfield DW, Seto E, Davie JR
The Journal of biological chemistry 2002 Sep 27;277(39):35783-6
The Journal of biological chemistry 2002 Sep 27;277(39):35783-6
Effect of estradiol on histone acetylation dynamics in human breast cancer cells.
Sun JM, Chen HY, Davie JR
The Journal of biological chemistry 2001 Dec 28;276(52):49435-42
The Journal of biological chemistry 2001 Dec 28;276(52):49435-42
Ligand-induced recruitment of a histone deacetylase in the negative-feedback regulation of the thyrotropin beta gene.
Sasaki S, Lesoon-Wood LA, Dey A, Kuwata T, Weintraub BD, Humphrey G, Yang WM, Seto E, Yen PM, Howard BH, Ozato K
The EMBO journal 1999 Oct 1;18(19):5389-98
The EMBO journal 1999 Oct 1;18(19):5389-98
No comments: Submit comment
Supportive validation
- Submitted by
- Invitrogen Antibodies (provider)
- Main image
- Experimental details
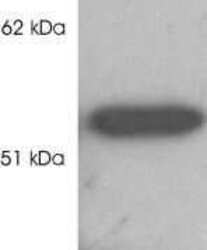
- Western blot analysis of HDAC2 was performed by loading HeLa cell lysate onto a SDS-PAGE gel. Proteins were transferred to a membrane, blocked, and probed with a HDAC2 polyclonal antibody (Product # PA1-861) at a concentration of 0.5 µg/mL followed by an HRP-conjugated anti-rabbit IgG secondary antibody. Detection was performed using a chemiluminescent substrate.

- Submitted by
- Invitrogen Antibodies (provider)
- Main image
- Experimental details
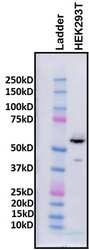
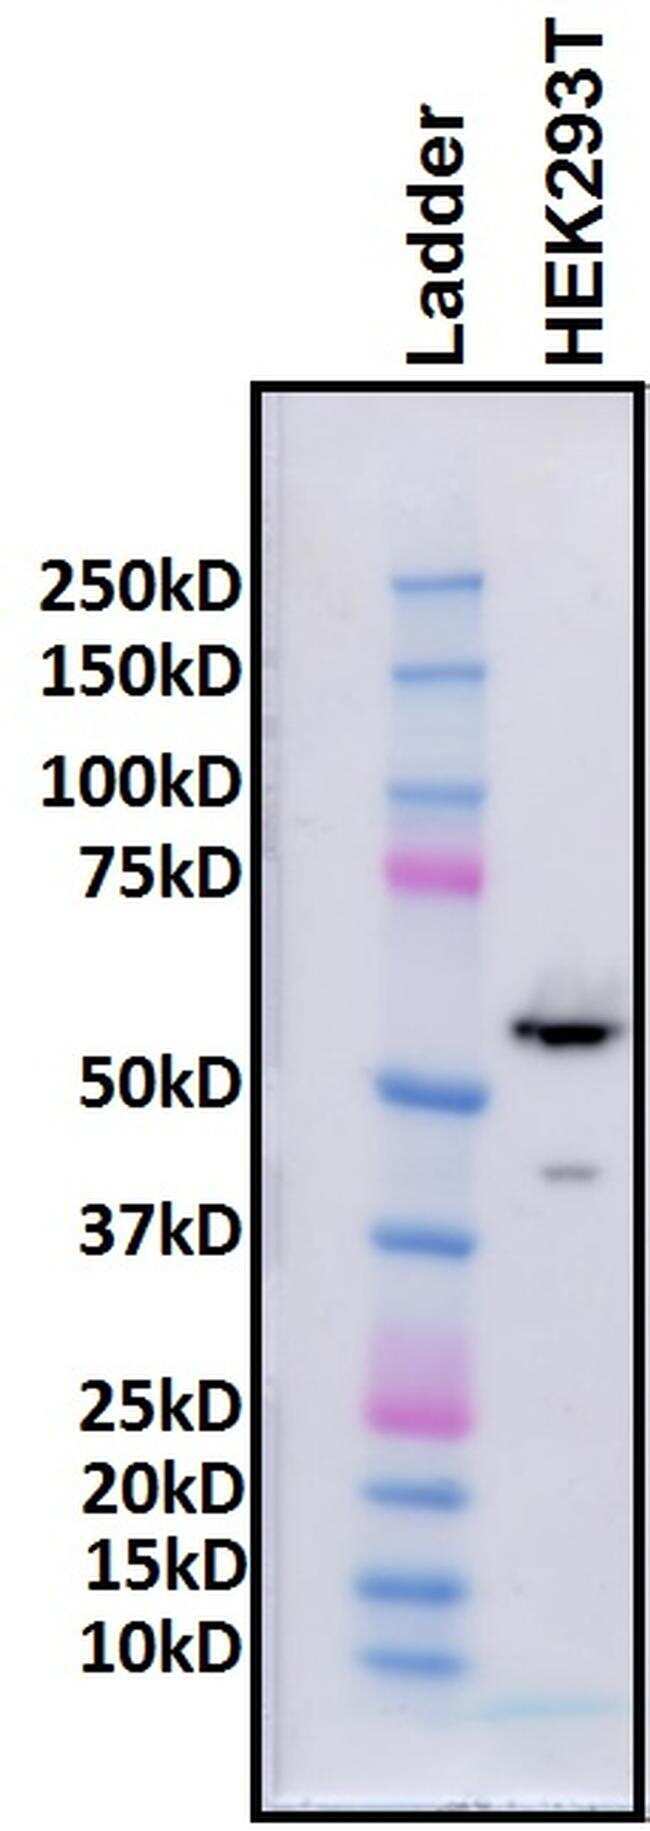
- Western blot analysis of HDAC2. 50 µg total protein lysate from human embryonic kidney HEK293T cells (lane 2) in 1X NuPAGE® LDS Sample Buffer (Product # NP0007) + 1mM DTT was loaded onto a NuPAGE™ Novex™ 4-12% Bis-Tris protein gel (Product # NP0321PK2). Molecular weight marker loaded for size reference (lane 1). Gel run in 1X NuPAGE® MOPS SDS Running Buffer (Product # NP0001) at room temperature and then transferred to a methanol-activated Novex™ PVDF membrane (Product # LC2002) using a Invitrogen Mini Blot Module (Product # B1000) in 1X NuPAGE® Transfer Buffer (Product # NP0006) at 20V for 2 hours at room temperature. Membrane was rinsed in 1X TBS-T and incubated in blocking solution (5% milk in 1X TBS-T) for 1 hour at room temperature on a rocking platform. HDAC1 detection was performed by incubating blot with rabbit polyclonal anti-HDAC2 antibody (Product # PA1-861) diluted at 1:1000 in blocking solution for 1 hour at room temperature on a rocking platform. Primary antibody was washed 10 times with 1X TBS-T over the course of 1 hour at room temperature on a rocking platform. Secondary antibody binding was performed by incubation with goat anti-rabbit IgG-HRP secondary diluted at 1:5000 in blocking solution for 1 hour at room temperature on a rocking platform. Following washes (as above), chemiluminescent imaging was performed. Data courtesy of Dr. Raj Jain's laboratory.
- Submitted by
- Invitrogen Antibodies (provider)
- Main image
- Experimental details
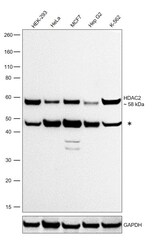
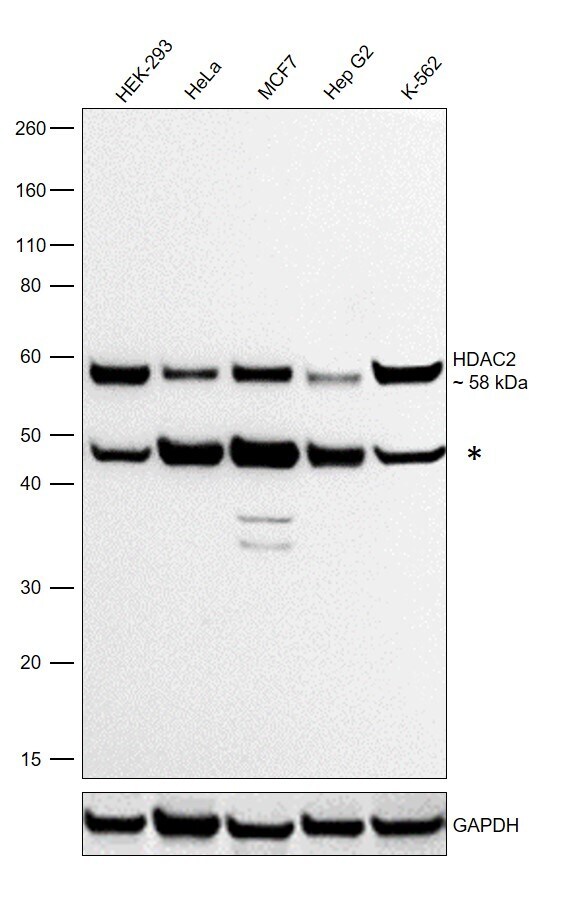
- Western blot was performed using Anti-HDAC2 Polyclonal Antibody (Product # PA1-861) and a 58 kDa band corresponding to HDAC2 was observed, along with an uncharacterized band (*) around 48 kDa. Whole cell extracts (30 µg lysate) of HEK-293 (Lane 1), HeLa (Lane 2), MCF7 (Lane 3), Hep G2 (Lane 4) and K-562 (Lane 5) were electrophoresed using NuPAGE™ 4-12% Bis-Tris Protein Gel (Product # NP0322BOX). Resolved proteins were then transferred onto a nitrocellulose membrane (Product # IB23001) by iBlot® 2 Dry Blotting System (Product # IB21001). The blot was probed with the primary antibody (0.5 µg/mL) and detected by chemiluminescence with Goat anti-Rabbit IgG (H+L) Superclonal™ Recombinant Secondary Antibody, HRP (Product # A27036, 1:20,000) using the iBright™ FL1500 Imaging System (Product # A44115). Chemiluminescent detection was performed using SuperSignal™ West Pico PLUS Chemiluminescent Substrate (Product # 34580).
- Submitted by
- Invitrogen Antibodies (provider)
- Main image

- Experimental details
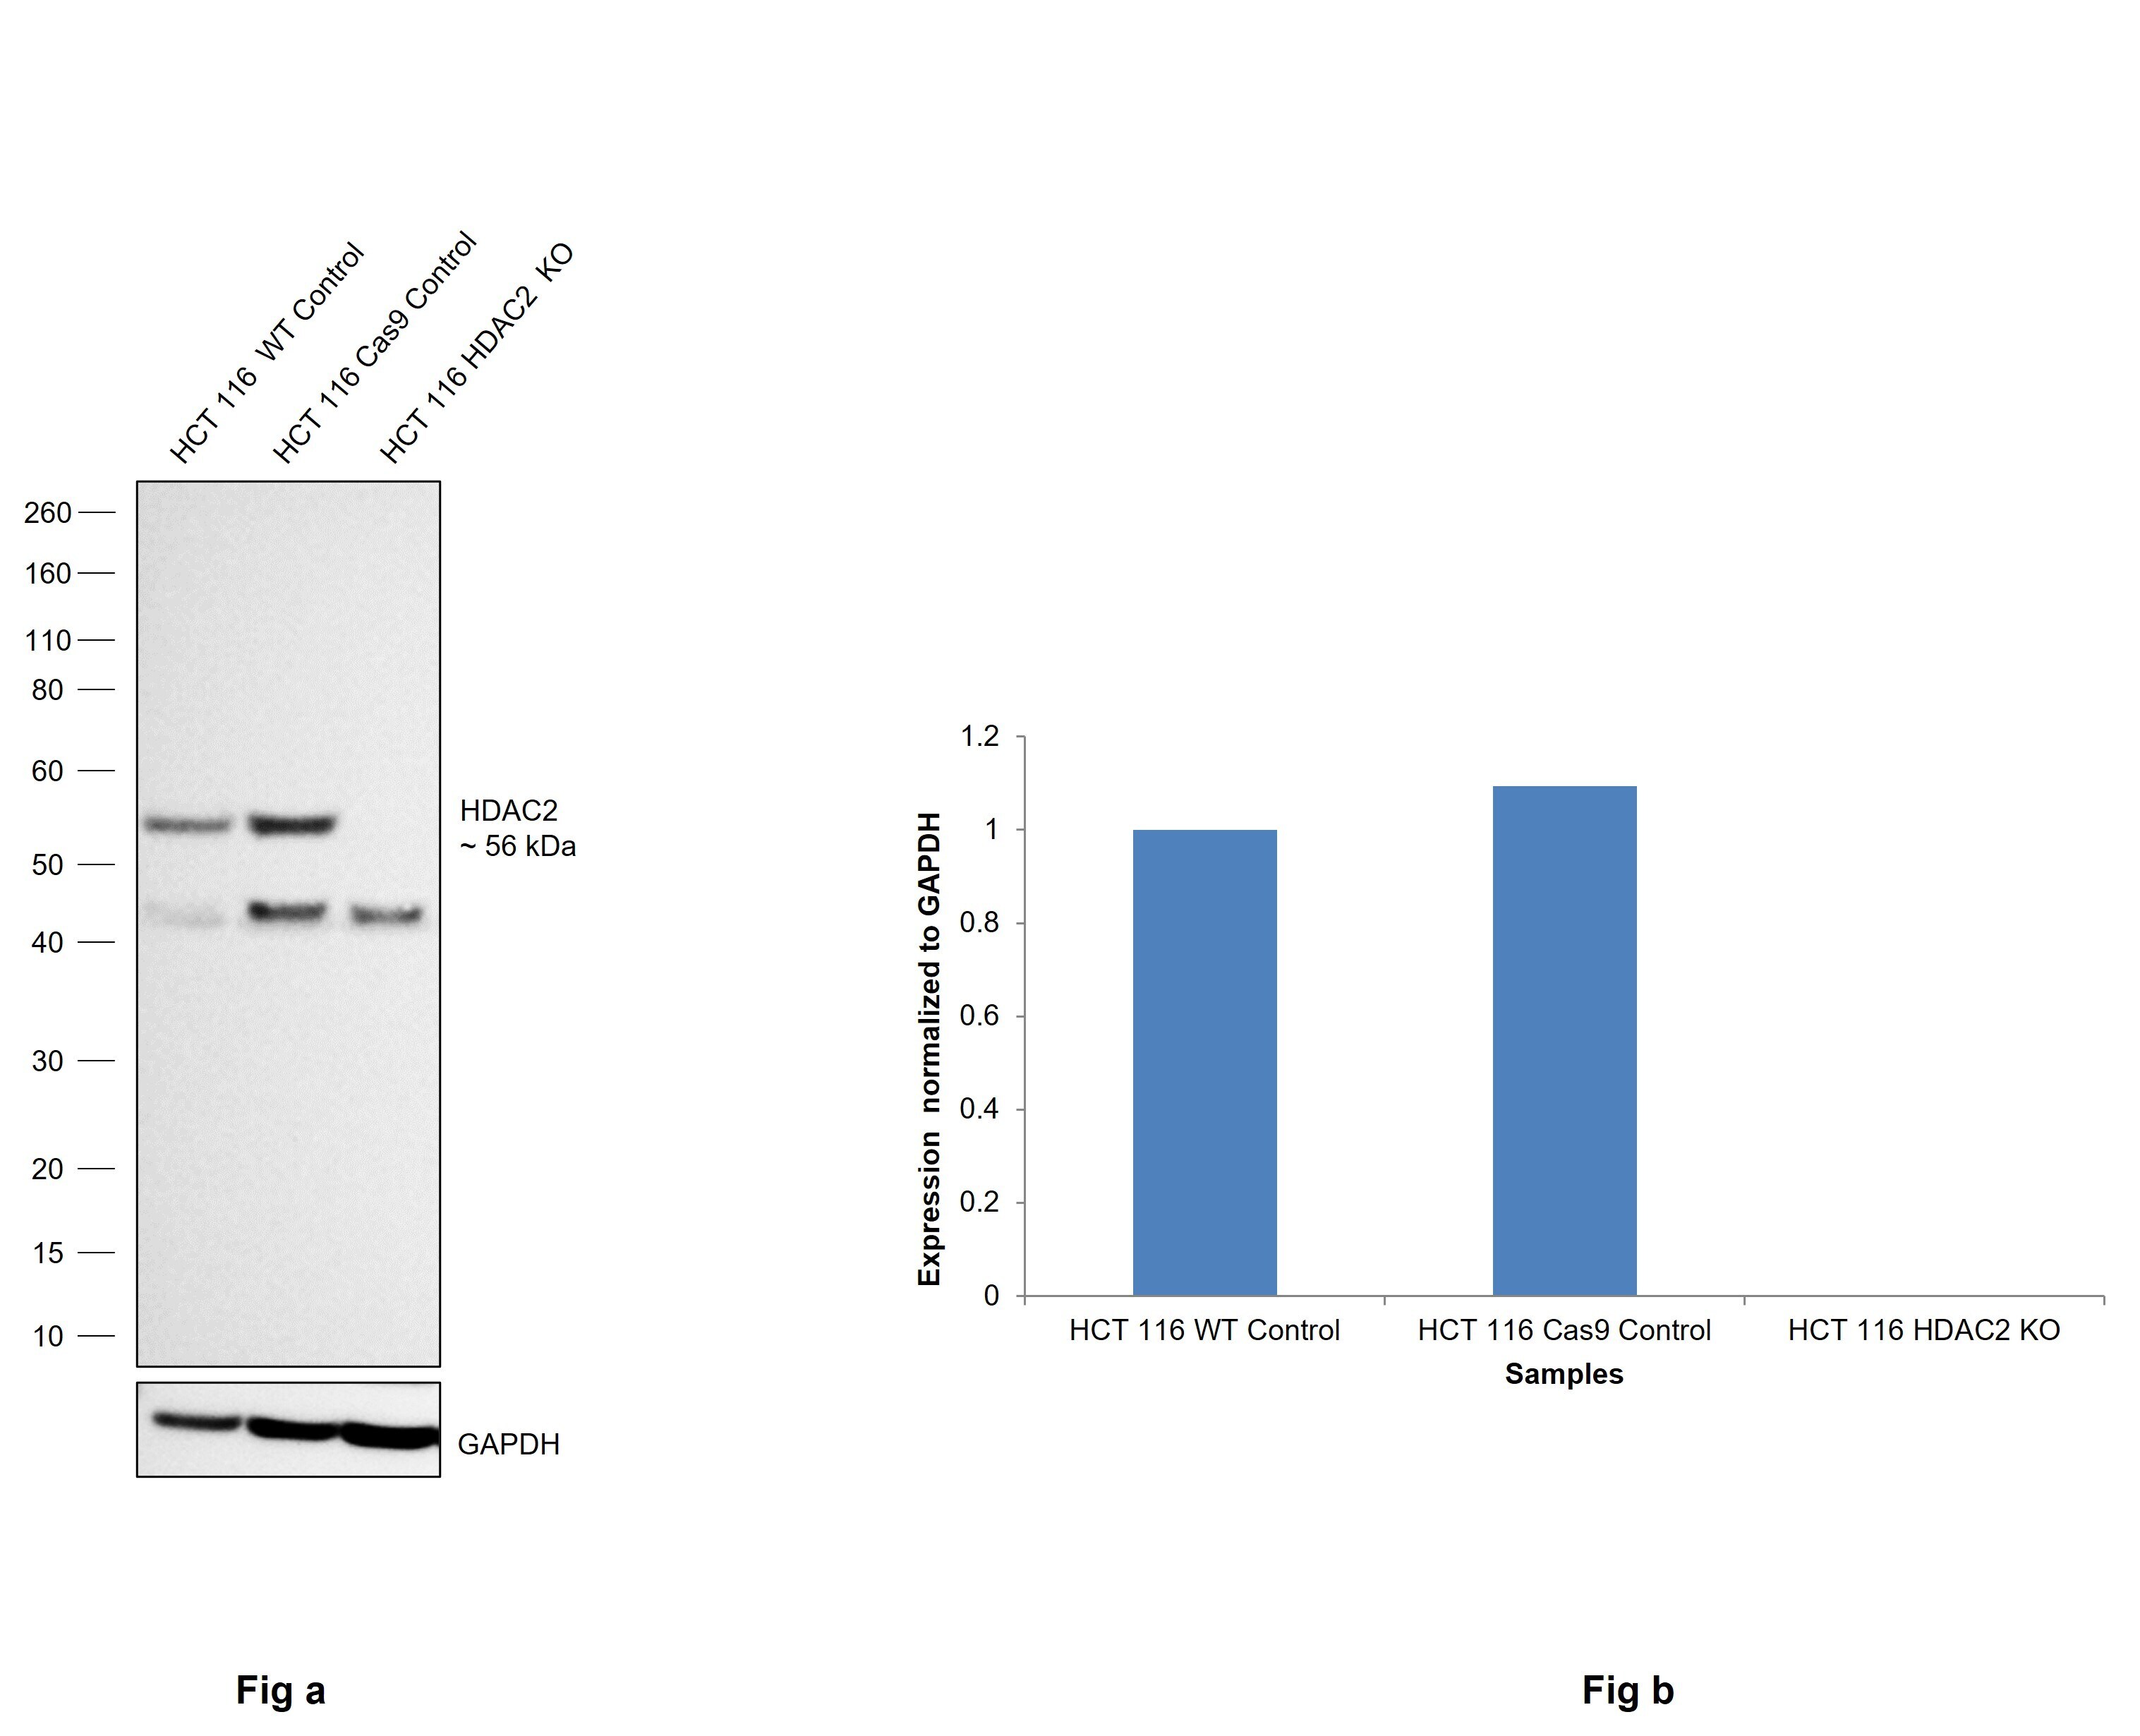
- Knockout of HDAC2 was achieved by CRISPR-Cas9 genome editing using LentiArray™ Lentiviral sgRNA (Product # A32042, Assay ID CRISPR1097024_LV) and LentiArray Cas9 Lentivirus (Product # A32064). Western blot analysis of HDAC2 was performed by loading 30 µg of HCT 116 wild type (Lane 1), HCT 116 Cas9 (Lane 2) andHCT 116 HDAC2 KO (Lane 3) whole cell extracts. The samples were electrophoresed using NuPAGE™ Novex™ 4-12% Bis-Tris Protein Gel (Product # NP0321BOX). Resolved proteins were then transferred onto a nitrocellulose membrane (Product # IB23001) by iBlot® 2 Dry Blotting System (Product # IB21001). The blot was probed with Anti-HDAC2 Polyclonal Antibody (Product # PA1-861, 0.5 µg/mL dilution) and Goat anti-Mouse IgG (H+L) Superclonal™ Recombinant Secondary Antibody, HRP (Product # A28177, 1:6000 dilution) using the iBright™ FL 1500 (Product # A44115). Chemiluminescent detection was performed using Novex® ECL Chemiluminescent Substrate Reagent Kit (Product # WP20005). Loss of signal upon CRISPR mediated knockout (KO) using the LentiArray™ CRISPR product line confirms that antibody is specific to HDAC2. An uncharacterized band was observed in all the samples at ~45 kDa.
- Submitted by
- Invitrogen Antibodies (provider)
- Main image

- Experimental details
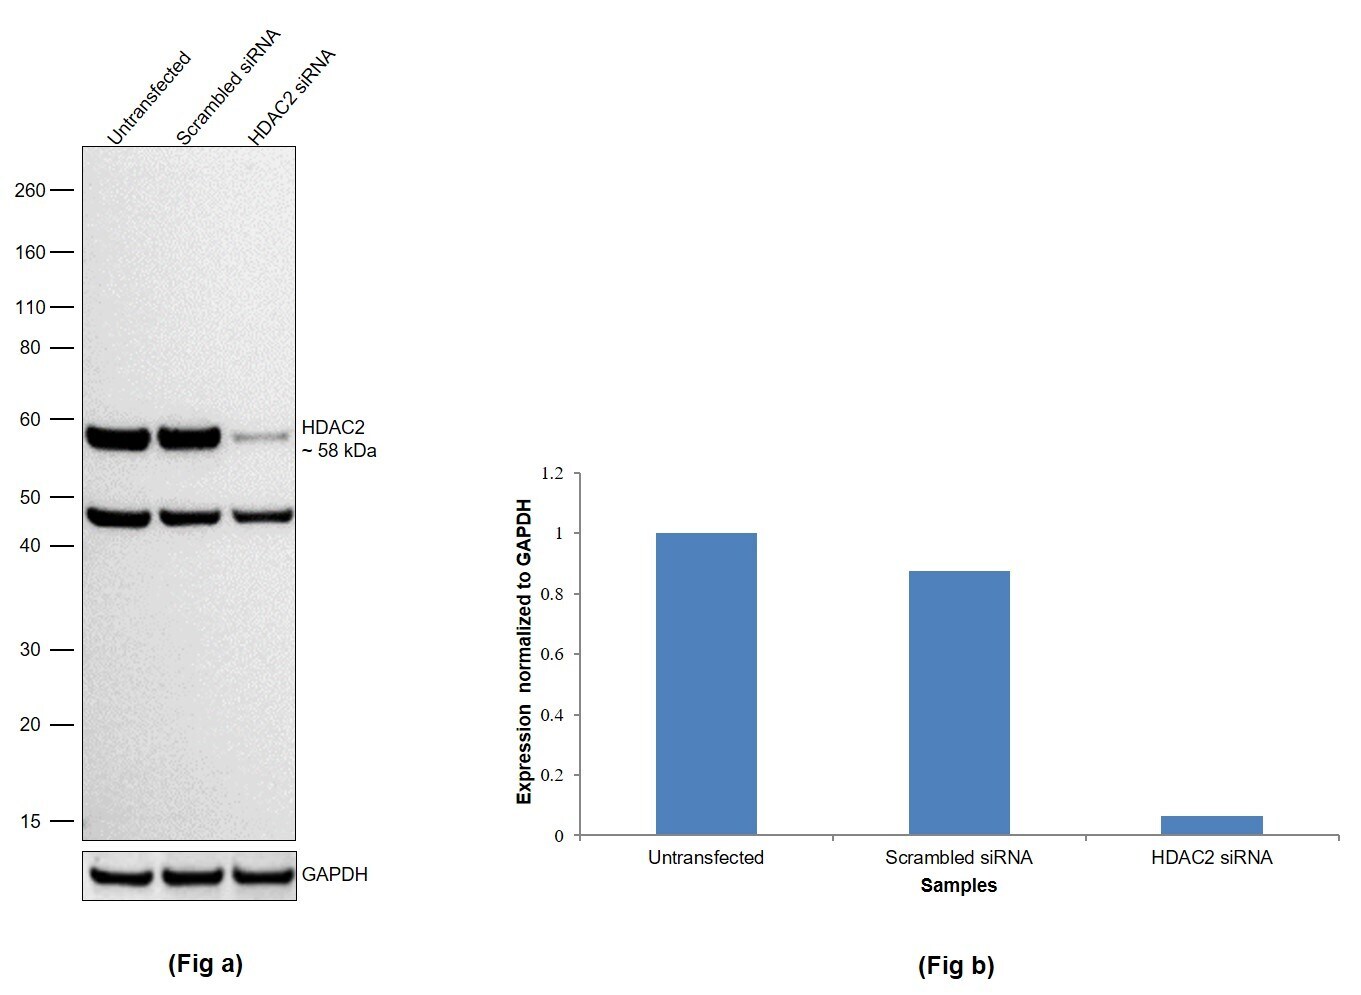
- Knockdown of HDAC2 was achieved by transfecting HEK-293 with HDAC2 specific siRNAs (Silencer® select Product # S6495, S6493). Western blot analysis (Fig. a) was performed using Whole cell extracts from the HDAC2 knockdown cells (lane 3), non-targeting scrambled siRNA transfected cells (lane 2) and untransfected cells (lane 1). The blot was probed with HDAC2 Polyclonal Antibody (Product # PA1-861, 0.5 µg/mL ) and Goat anti-Rabbit IgG (H+L) Superclonal™ Recombinant Secondary Antibody, HRP (Product # A27036, 1:20,000). Densitometric analysis of this western blot is shown in histogram (Fig. b). Decrease in signal upon siRNA mediated knock down confirms that antibody is specific to HDAC2.
Supportive validation
- Submitted by
- Invitrogen Antibodies (provider)
- Main image
- Experimental details
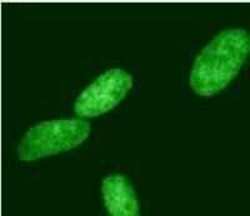
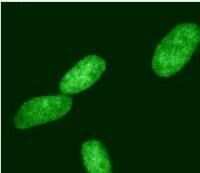
- Immunofluorescent analysis of HDAC2 (green) in HeLa cells. Cells were stained with a HDAC2 polyclonal antibody (Product # PA1-861) followed by a fluorescently-conjugated anti-rabbit IgG secondary antibody. Staining was analyzed by fluorescence microscopy.
- Submitted by
- Invitrogen Antibodies (provider)
- Main image
- Experimental details
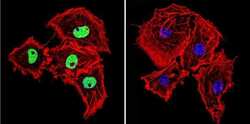
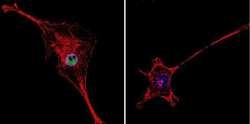
- Immunofluorescent analysis of HDAC2 in COS-7 Cells. Cells were grown on chamber slides and fixed with formaldehyde prior to staining. Cells were probed without (control) or with a HDAC2 polyclonal antibody (Product # PA1-861) at a dilution of 1:200 overnight at 4 C, washed with PBS and incubated with a DyLight-488 conjugated secondary antibody (Product # 35552). HDAC2 staining (green), F-Actin staining with Phalloidin (red) and nuclei with DAPI (blue) is shown. Images were taken at 60X magnification.
- Submitted by
- Invitrogen Antibodies (provider)
- Main image
- Experimental details
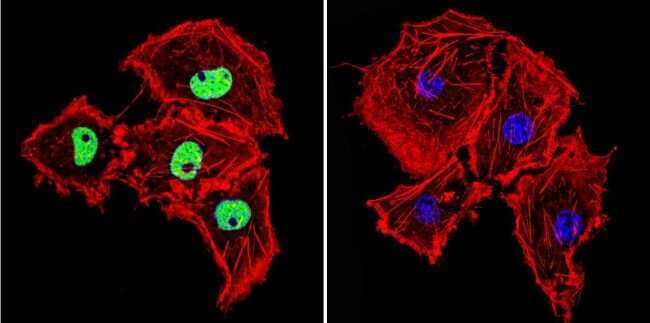
- Immunofluorescent analysis of HDAC2 in HeLa Cells. Cells were grown on chamber slides and fixed with formaldehyde prior to staining. Cells were probed without (control) or with a HDAC2 polyclonal antibody (Product # PA1-861) at a dilution of 1:200 overnight at 4 C, washed with PBS and incubated with a DyLight-488 conjugated secondary antibody (Product # 35552). HDAC2 staining (green), F-Actin staining with Phalloidin (red) and nuclei with DAPI (blue) is shown. Images were taken at 60X magnification.

- Submitted by
- Invitrogen Antibodies (provider)
- Main image
- Experimental details
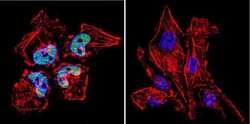
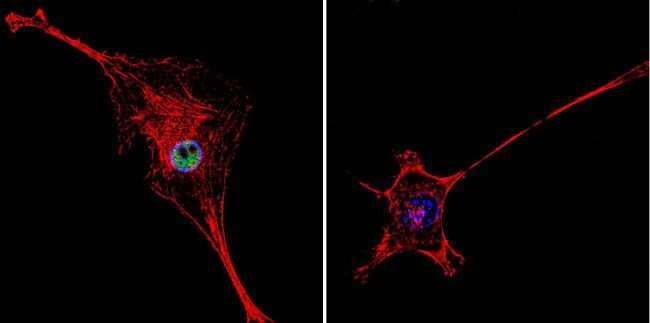
- Immunofluorescent analysis of HDAC2 in NIH-3T3 Cells. Cells were grown on chamber slides and fixed with formaldehyde prior to staining. Cells were probed without (control) or with a HDAC2 polyclonal antibody (Product # PA1-861) at a dilution of 1:200 overnight at 4 C, washed with PBS and incubated with a DyLight-488 conjugated secondary antibody (Product # 35552). HDAC2 staining (green), F-Actin staining with Phalloidin (red) and nuclei with DAPI (blue) is shown. Images were taken at 60X magnification.
- Submitted by
- Invitrogen Antibodies (provider)
- Main image
- Experimental details
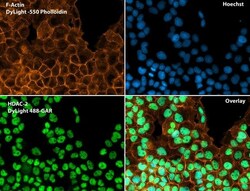
- Immunofluorescent analysis of Phalloidin (orange) and HDAC2 (green) in A431 cells. Formalin fixed cells were permeabilized with 0.1% Triton X-100 in PBS for 10 minutes at room temperature and blocked with 2% BSA (Product # 37525) in PBS + 0.1% Triton X-100 for 30 minutes at room temperature. Cells were probed with an HDAC2 polyclonal antibody (Product # PA1-861) at a dilution of 1:75 for at least 1 hour at room temperature, washed with PBS, and incubated with DyLight 488 goat anti-rabbit IgG secondary antibody (Product # 35552) at a dilution of 1:250 for 30 minutes at room temperature. Actin was stained with DyLight 550 Phalloidin (Product # 21835) at a dilution of 1:120 (2.5 units/mL final concentration) and nuclei (blue) were stained with Hoechst (Product # 62249) at a concentration of 1 µg/mL for 30 minutes. Images were taken on a Zeiss Axio Observer Z1 microscope at 20X magnification.
- Submitted by
- Invitrogen Antibodies (provider)
- Main image
- Experimental details
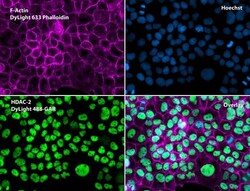
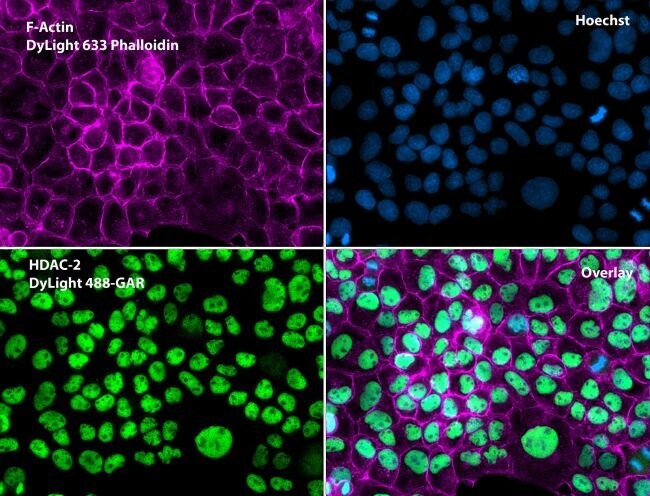
- Immunofluorescent analysis of Phalloidin (magenta) and HDAC2 (green) in A431 cells. Formalin fixed cells were permeabilized with 0.1% Triton X-100 in PBS for 10 minutes at room temperature and blocked with 2% BSA (Product # 37525) in PBS + 0.1% Triton X-100 for 30 minutes at room temperature. Cells were probed with a HDAC2 polyclonal antibody (Product # PA1-861) at a dilution of 1:75 for at least 1 hour at room temperature, washed with PBS, and incubated with DyLight 488 goat anti-rabbit IgG secondary antibody (Product # 35552) at a dilution of 1:250 for 30 minutes at room temperature. Actin was stained with DyLight 633 Phalloidin (Product # 21840) at a dilution of 1:120 (2.5units/mL final concentration) and nuclei (blue) were stained with Hoechst (Product # 62249) at a concentration of 1 µg/mL for 30 minutes. Images were taken on a Zeiss Axio Observer Z1 microscope at 20X magnification.
- Submitted by
- Invitrogen Antibodies (provider)
- Main image
- Experimental details
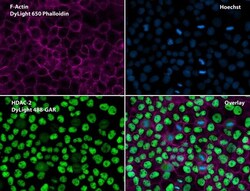
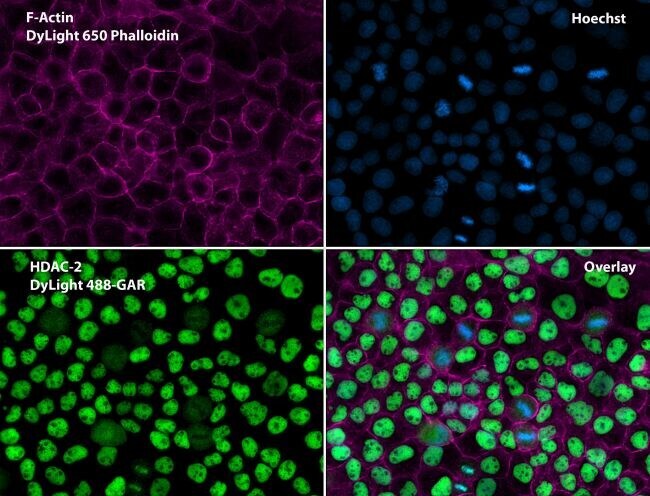
- Immunofluorescent analysis of Phalloidin (purple) and HDAC2 (green) in A431 cells. Formalin fixed cells were permeabilized with 0.1% Triton X-100 in PBS for 10 minutes at room temperature and blocked with 2% BSA (Product # 37525) in PBS + 0.1% Triton X-100 for 30 minutes at room temperature. Cells were probed with a HDAC2 polyclonal antibody (Product # PA1-861) at a dilution of 1:75 for at least 1 hour at room temperature, washed with PBS, and incubated with DyLight 488 goat anti-rabbit IgG secondary antibody (Product # 35552) at a dilution of 1:250 for 30 minutes at room temperature. Actin was stained with DyLight 650 Phalloidin (Product # 21838) at a dilution of 1:120 (2.5 units/mL final concentration) and nuclei (blue) were stained with Hoechst (Product # 62249) at a concentration of 1 µg/mL for 30 minutes. Images were taken on a Zeiss Axio Observer Z1 microscope at 20X magnification.
- Submitted by
- Invitrogen Antibodies (provider)
- Main image

- Experimental details
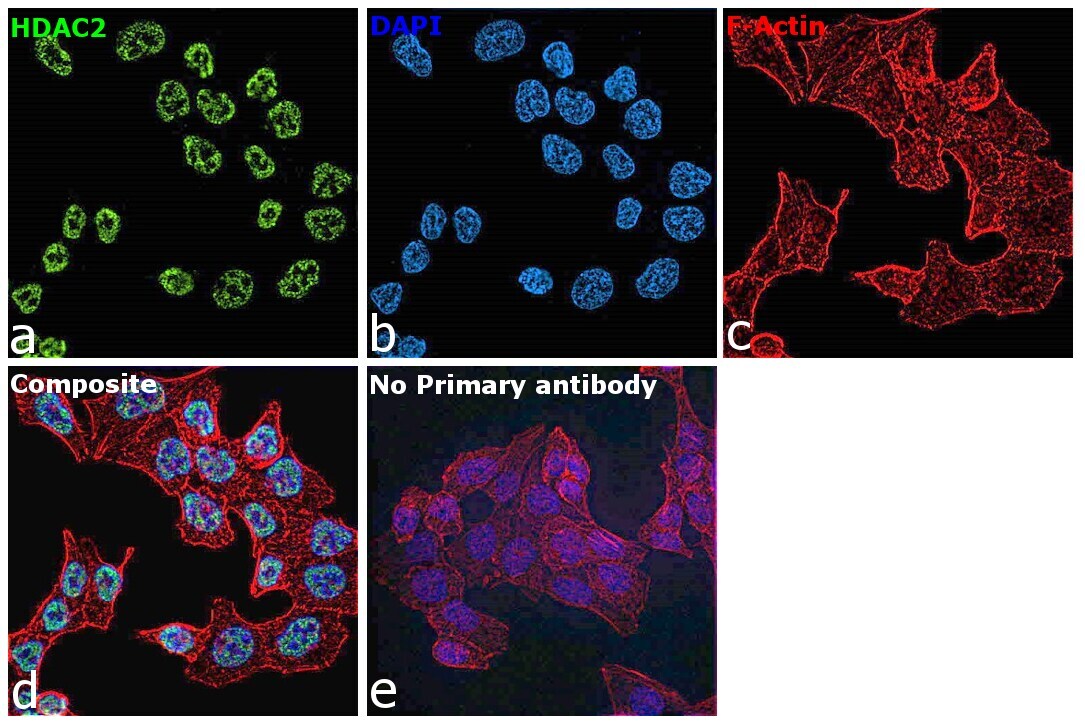
- Immunofluorescence analysis of HDAC2 was performed using 70% confluent log phase HCT 116 cells. The cells were fixed with 4% paraformaldehyde for 10 minutes, permeabilized with 0.1% Triton™ X-100 for 15 minutes, and blocked with 2% BSA for 1 hour at room temperature. The cells were labeled with HDAC2 Polyclonal Antibody (Product # PA1-861) at 1 µg/mL in 0.1% BSA, incubated at 4 degree celsius overnight and then labeled with Donkey anti-Rabbit IgG (H+L) Highly Cross-Adsorbed Secondary Antibody, Alexa Fluor Plus 488 (Product # A32790), (1:2000), for 45 minutes at room temperature (Panel a: Green). Nuclei (Panel b:Blue) were stained with ProLong™ Diamond Antifade Mountant with DAPI (Product # P36962). F-actin (Panel c: Red) was stained with Rhodamine Phalloidin (Product # R415, 1:300). Panel d represents the merged image showing nuclear localization. Panel e represents control cells with no primary antibody to assess background. The images were captured at 60X magnification.
Supportive validation
- Submitted by
- Invitrogen Antibodies (provider)
- Main image

- Experimental details
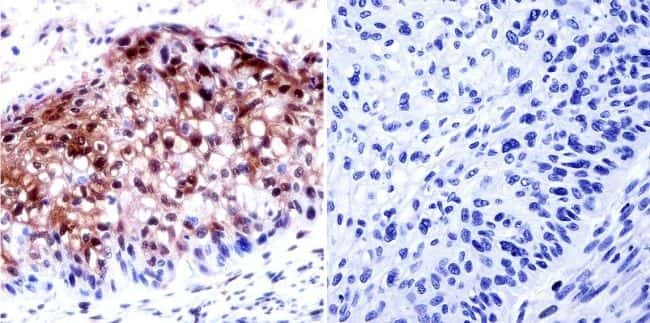
- Immunohistochemistry was performed on cancer biopsies of deparaffinized human esophagus carcinoma. To expose target proteins, heat induced antigen retrieval was performed using 10mM sodium citrate (pH6.0) buffer, microwaved for 8-15 minutes. Following antigen retrieval tissues were blocked in 3% BSA-PBS for 30 minutes at room temperature. Tissues were then probed at a dilution of 1:50 with a Rabbit Polyclonal Antibody recognizing HDAC2 (Product # PA1-861) or without primary antibody (negative control) overnight at 4°C in a humidified chamber. Tissues were washed extensively with PBST and endogenous peroxidase activity was quenched with a peroxidase suppressor. Detection was performed using a biotin-conjugated secondary antibody and SA-HRP, followed by colorimetric detection using DAB. Tissues were counterstained with hematoxylin and prepped for mounting.
Supportive validation
- Submitted by
- Invitrogen Antibodies (provider)
- Main image
- Experimental details
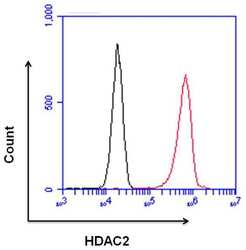
- Flow cytometry analysis of HDAC2 was done on HeLa cells. Cells were fixed, permeabilized and stained with a HDAC2 rabbit polyclonal antibody (Product # PA1-861, red histogram) or a rabbit IgG isotype control (Product # MA5-16384, black histogram) at a dilution of 10 µg/mL. After incubation for 1 hour on ice, the cells were labeled with a Goat anti-Rabbit IgG (H+L) Superclonal™ Secondary Antibody, Alexa Fluor® 647 conjugate (Product # A27040) at a dilution of 1:50 for 1 hour on ice. A representative 10,000 cells were acquired and analyzed for each sample.
Supportive validation
- Submitted by
- Invitrogen Antibodies (provider)
- Main image

- Experimental details
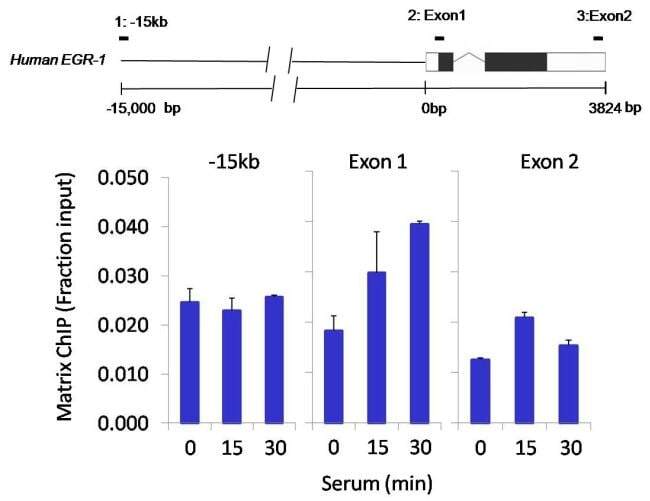
- Chromatin immunoprecipitation analysis of HDAC2 was performed using cross-linked chromatin from 1x10^6 HCT116 colon carcinoma cells treated with serum for 0, 15, and 30 minutes. Immunoprecipitation was performed using a multiplex microplate Matrix ChIP assay (see reference for Matrix ChIP protocol: http://www.ncbi.nlm.nih.gov/pubmed/22098709) with 1.0 µL/100 µL well volume of an HDAC2 polyclonal antibody (Product # PA1-861). Chromatin aliquots from ~1x10^5 cells were used per ChIP pull-down. Quantitative PCR data were done in quadruplicate using 1 µL of eluted DNA in 2 µL SYBR real-time PCR reactions containing primers to amplify -15kb upstream of the Egr1 gene or exon-1 or exon-2 of Egr1. PCR calibration curves were generated for each primer pair from a dilution series of sheared total genomic DNA. Quantitation of immunoprecipitated chromatin is presented as signal relative to the total amount of input chromatin. Results represent the mean +/- SEM for three experiments. A schematic representation of the Egr-1 locus is shown above the data where boxes represent exons (black boxes = translated regions, white boxes = untranslated regions), the zigzag line represents an intron, and the straight line represents upstream sequence. Regions amplified by Egr-1 primers are represented by black bars. Data courtesy of the Innovators Program.
Supportive validation
- Submitted by
- Invitrogen Antibodies (provider)
- Main image
- Experimental details
- NULL

- Submitted by
- Invitrogen Antibodies (provider)
- Main image
- Experimental details
- NULL

- Submitted by
- Invitrogen Antibodies (provider)
- Main image
- Experimental details
- NULL
- Submitted by
- Invitrogen Antibodies (provider)
- Main image
- Experimental details
- NULL

- Submitted by
- Invitrogen Antibodies (provider)
- Main image

- Experimental details
- NULL
- Submitted by
- Invitrogen Antibodies (provider)
- Main image
- Experimental details
- NULL
- Submitted by
- Invitrogen Antibodies (provider)
- Main image
- Experimental details
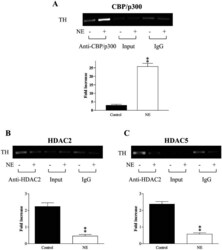
- Figure 9. Identify the binding of the HAT & HDAC to the TH promoter by ChIP assay (all N = 4/group). Exposure of MN9D cells to NE for two days increased CBP/p300 binding to TH promoter (A) and reduced the binding of HDAC2 (B) and HDAC5 (C) to the TH promoter. ""Input"" serves as a loading control and rabbit IgG immunoprecipitation serves as a negative control. Top panel in each figures showed the binding to the TH promoter in response to NE treatment. Low panel in each figure showed quantitative real-time PCR of the TH promoter regions from immunoprecipitation with antibody against CBP/p300, HDAC2, and HDAC5. The fold enrichment value is shown as the normalized ChIP signals divided by the normalized input signal. Each bar from both pictures represent data obtained from four separate experiments ( N = 4/group). ** p < .01, compared to the control. NE: treatment with 300 nM NE. Abbreviations: ChIP: chromatin immunoprecipitation assay; HAT: histone acetyl transferase; HDAC: histone deacetylases; NE: norepinephrine; PCR: polymerase chain reaction; TH: tyrosine hydroxylase.
