 Explore
 Validate
 Learn
Learn Western blot
Antibody data
- Antibody Data
- Antigen structure
- References [8]
- Comments [0]
- Validations
- Western blot [1]
- Immunocytochemistry [2]
- Other assay [17]
Submit
Validation data
Reference
Comment
Report error
- Product number
- 14-9896-80 - Provider product page

- Provider
- Invitrogen Antibodies
- Product name
- Musashi-1 Monoclonal Antibody (14H1), eBioscience™
- Antibody type
- Monoclonal
- Antigen
- Other
- Description
- Description: This 14H1 monoclonal antibody recognizes human Musashi-1 (MSI-1), a 39 kDa RNA binding protein. Musashi-1 is expressed in CNS stem and progenitor cells with decreased expression in differentiating cells. Musashi-1 functions as a translational repressor, directly regulating its target proteins, Numb and p21 (CIP1). Musashi-1 has been shown to be expressed in stem cells in a variety of other tissues such as the gut, stomach, mammary gland, and hair follicles. In addition to normal tissue expression, Musashi-1 expression has been identified in cells from several tumor types, mainly pulmonary and adenocarcinoma, as well as large and small cell carcinomas. Recently, expression of Musashi-1 in ischemic lesions following stroke provides evidence for neurogenesis as well as the role of Musashi-1 in regulating apoptosis.
- Antibody clone number
- 14H1
- Concentration
- 0.5 mg/mL
Submitted references Fibrinogen in the glioblastoma microenvironment contributes to the invasiveness of brain tumor-initiating cells.
PD-1 independent of PD-L1 ligation promotes glioblastoma growth through the NFκB pathway.
Isolation and characterization of neural stem/progenitor cells in the subventricular zone of the naked mole-rat brain.
Spatio-temporal neural stem cell behavior leads to both perfect and imperfect structural brain regeneration in adult newts.
Inflammation-induced miRNA-155 inhibits self-renewal of neural stem cells via suppression of CCAAT/enhancer binding protein β (C/EBPβ) expression.
Image-based detection and targeting of therapy resistance in pancreatic adenocarcinoma.
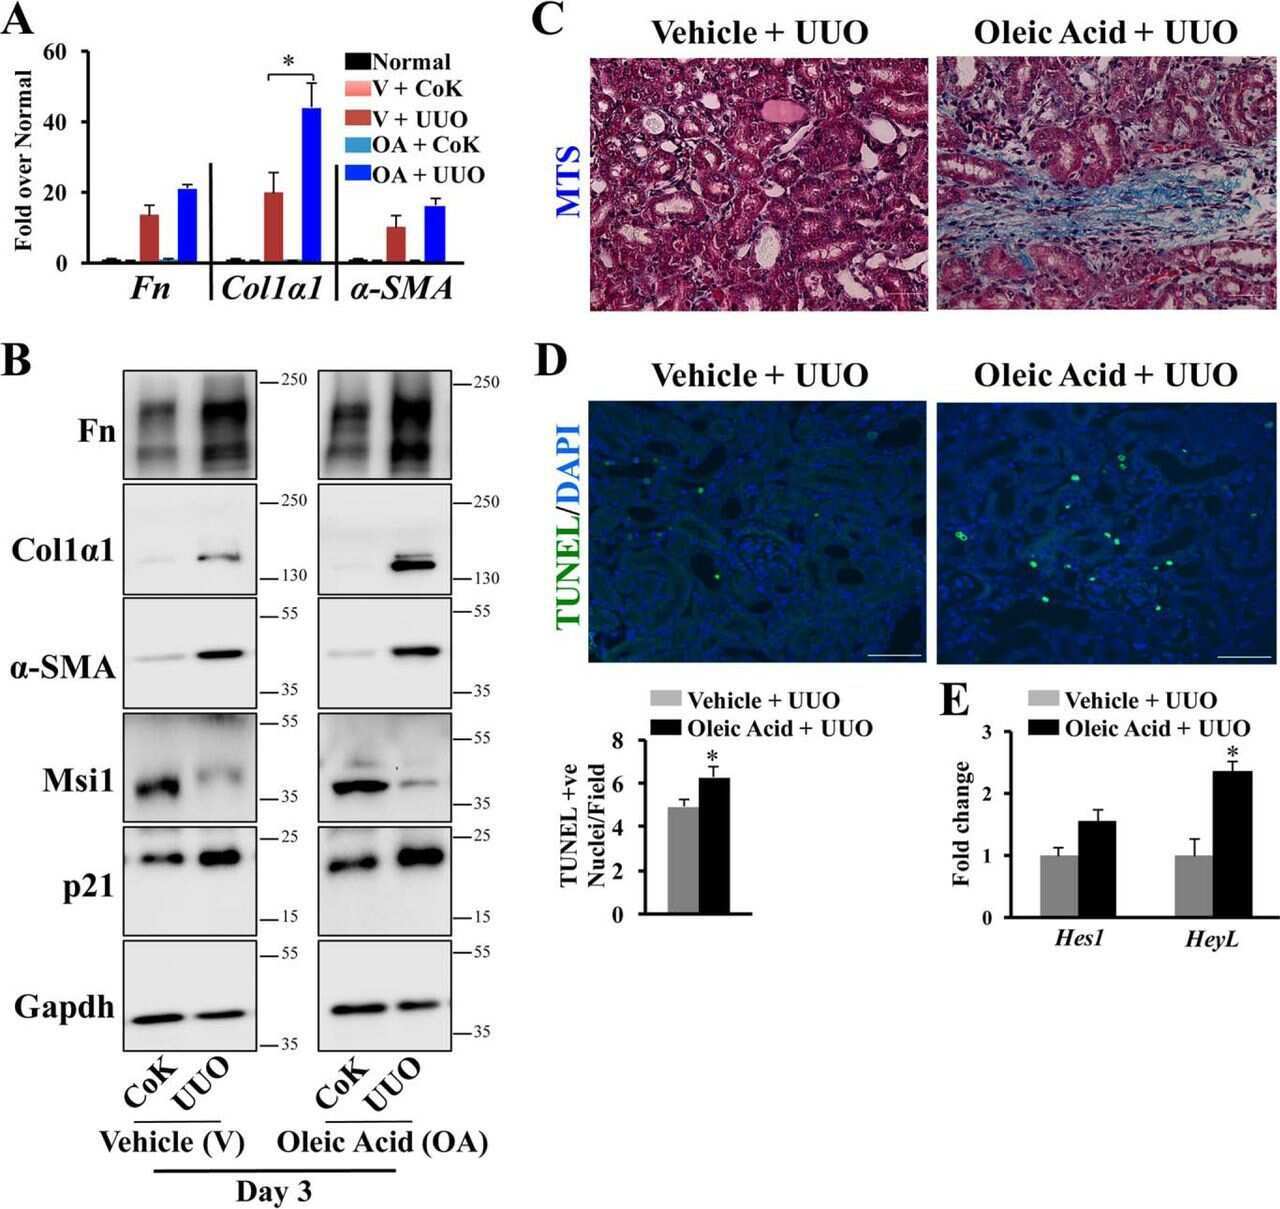
RNA-binding Protein Musashi Homologue 1 Regulates Kidney Fibrosis by Translational Inhibition of p21 and Numb mRNA.
Role of RIP1 in physiological enterocyte turnover in mouse small intestine via nonapoptotic death.
Dzikowski L, Mirzaei R, Sarkar S, Kumar M, Bose P, Bellail A, Hao C, Yong VW
Brain pathology (Zurich, Switzerland) 2021 Sep;31(5):e12947
Brain pathology (Zurich, Switzerland) 2021 Sep;31(5):e12947
PD-1 independent of PD-L1 ligation promotes glioblastoma growth through the NFκB pathway.
Mirzaei R, Gordon A, Zemp FJ, Kumar M, Sarkar S, Luchman HA, Bellail AC, Hao C, Mahoney DJ, Dunn JF, Bose P, Yong VW
Science advances 2021 Nov 5;7(45):eabh2148
Science advances 2021 Nov 5;7(45):eabh2148
Isolation and characterization of neural stem/progenitor cells in the subventricular zone of the naked mole-rat brain.
Yamamura Y, Kawamura Y, Oiwa Y, Oka K, Onishi N, Saya H, Miura K
Inflammation and regeneration 2021 Nov 1;41(1):31
Inflammation and regeneration 2021 Nov 1;41(1):31
Spatio-temporal neural stem cell behavior leads to both perfect and imperfect structural brain regeneration in adult newts.
Urata Y, Yamashita W, Inoue T, Agata K
Biology open 2018 Jun 25;7(6)
Biology open 2018 Jun 25;7(6)
Inflammation-induced miRNA-155 inhibits self-renewal of neural stem cells via suppression of CCAAT/enhancer binding protein β (C/EBPβ) expression.
Obora K, Onodera Y, Takehara T, Frampton J, Hasei J, Ozaki T, Teramura T, Fukuda K
Scientific reports 2017 Feb 27;7:43604
Scientific reports 2017 Feb 27;7:43604
Image-based detection and targeting of therapy resistance in pancreatic adenocarcinoma.
Fox RG, Lytle NK, Jaquish DV, Park FD, Ito T, Bajaj J, Koechlein CS, Zimdahl B, Yano M, Kopp J, Kritzik M, Sicklick J, Sander M, Grandgenett PM, Hollingsworth MA, Shibata S, Pizzo D, Valasek M, Sasik R, Scadeng M, Okano H, Kim Y, MacLeod AR, Lowy AM, Reya T
Nature 2016 Jun 16;534(7607):407-411
Nature 2016 Jun 16;534(7607):407-411
RNA-binding Protein Musashi Homologue 1 Regulates Kidney Fibrosis by Translational Inhibition of p21 and Numb mRNA.
Jadhav S, Ajay AK, Trivedi P, Seematti J, Pellegrini K, Craciun F, Vaidya VS
The Journal of biological chemistry 2016 Jul 1;291(27):14085-14094
The Journal of biological chemistry 2016 Jul 1;291(27):14085-14094
Role of RIP1 in physiological enterocyte turnover in mouse small intestine via nonapoptotic death.
Matsuoka Y, Tsujimoto Y
Genes to cells : devoted to molecular & cellular mechanisms 2015 Jan;20(1):11-28
Genes to cells : devoted to molecular & cellular mechanisms 2015 Jan;20(1):11-28
No comments: Submit comment
Supportive validation
- Submitted by
- Invitrogen Antibodies (provider)
- Main image

- Experimental details
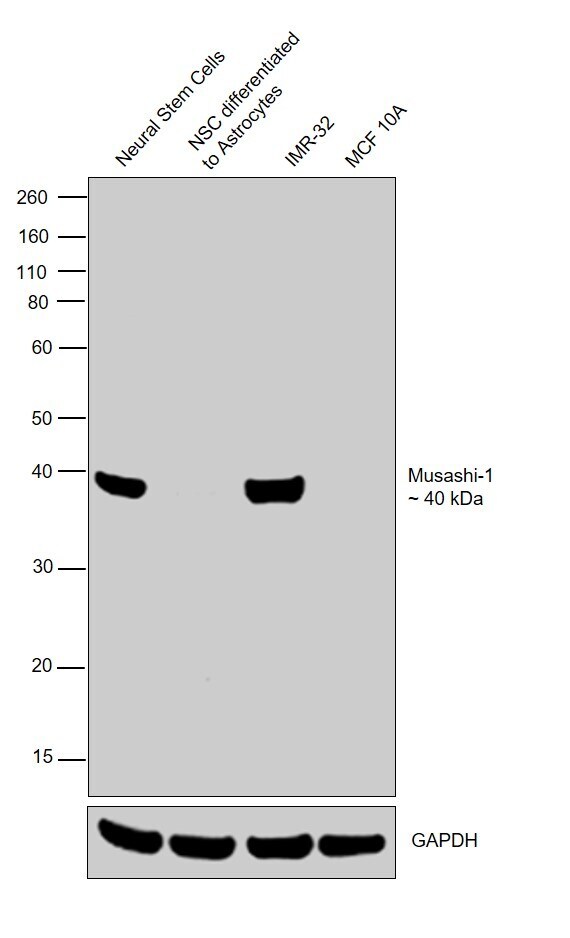
- Western blot was performed using Anti-Musashi-1 Monoclonal Antibody (14H1), eBioscience™ (Product # 14-9896-80) and a 40 kDa band corresponding to Musashi-1 was observed in Neural Stem Cells and IMR-32 and not in Neural Stem Cells differentiated to Astrocytes and MCF 10A. Whole cell extracts (30 µg lysate) of Neural Stem Cells (Lane 1), Neural Stem Cells differentiated to Astrocytes (Lane 2), IMR-32 (Lane 3) and MCF 10A (Lane 4) were electrophoresed using Novex® NuPAGE® 4-12% Bis-Tris Protein Gel (Product # NP0322BOX). Resolved proteins were then transferred onto a nitrocellulose membrane (Product # IB23001) by iBlot® 2 Dry Blotting System (Product # IB21001). The blot was probed with the primary antibody (5 ug/ml) and detected by chemiluminescence with F(ab)2-Rabbit anti-Rat IgG (H+L) Secondary Antibody, HRP (Product # PA1-29927), using the iBright FL 1000 (Product # A32752). Chemiluminescent detection was performed using Novex® ECL Chemiluminescent Substrate Reagent Kit (Product # WP20005). Chemiluminescent detection was performed using Novex® ECL Chemiluminescent Substrate Reagent Kit (Product # WP20005).
Supportive validation
- Submitted by
- Invitrogen Antibodies (provider)
- Main image

- Experimental details
- Immunocytochemistry of fixed and permeabilized human neural stem cells using 10 µg/mL Anti-Musashi-1 Purified followed by Anti-Rat TRITC. Nuclei are counterstained with Hoechst. Data courtesy of Zeng lab at the Buck Institute.

- Submitted by
- Invitrogen Antibodies (provider)
- Main image
- Experimental details
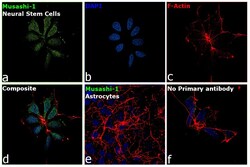
- Immunofluorescence analysis of Musashi-1 was performed using 70% confluent log phase Neural Stem cells. The cells were fixed with 4% Paraformaldehyde for 10 minutes, permeabilized with 0.1% Triton™ X-100 for 10 minutes, and blocked with 2% BSA for 10 minutes at room temperature. The cells were labeled with Musashi-1 Monoclonal Antibody (14H1), eBioscience™ (Product # 14-9896-82) at 1 µg/mL in 0.1% BSA, incubated at 4 degree Celsius overnight and then labeled with Goat anti-Rat IgG (H+L) Cross-Adsorbed Secondary Antibody, Alexa Fluor 488 (Product # A-11006), (1:2000 dilution) for 45 minutes at room temperature (Panel a: Green). Nuclei (Panel b: Blue) were stained with SlowFade® Gold Antifade Mountant with DAPI (Product # S36938). F-actin (Panel c: Red) was stained with Rhodamine Phalloidin (Product # R415, 1:300). Panel d represents the merged image showing nuclear and cytoplasmic localization. Panel e represents Neural Stem Cells differentiated to Astrocytes having no expression of Musashi-1. Panel f represents control cells with no primary antibody to assess background. The images were captured at 60X magnification.

Supportive validation
- Submitted by
- Invitrogen Antibodies (provider)
- Main image

- Experimental details
- NULL

- Submitted by
- Invitrogen Antibodies (provider)
- Main image

- Experimental details
- NULL

- Submitted by
- Invitrogen Antibodies (provider)
- Main image

- Experimental details
- NULL

- Submitted by
- Invitrogen Antibodies (provider)
- Main image

- Experimental details
- NULL
- Submitted by
- Invitrogen Antibodies (provider)
- Main image

- Experimental details
- NULL

- Submitted by
- Invitrogen Antibodies (provider)
- Main image

- Experimental details
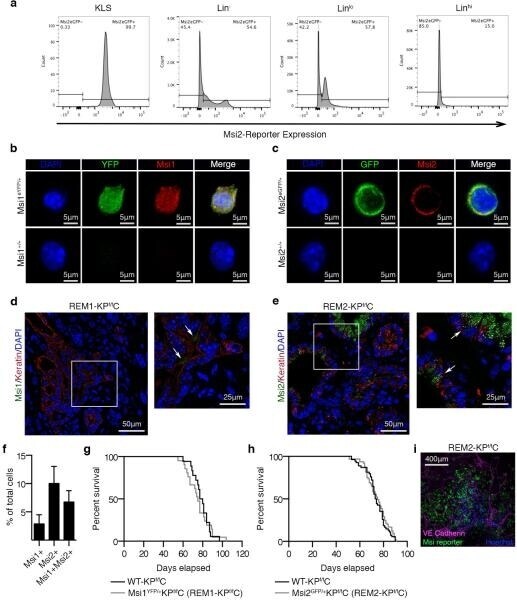
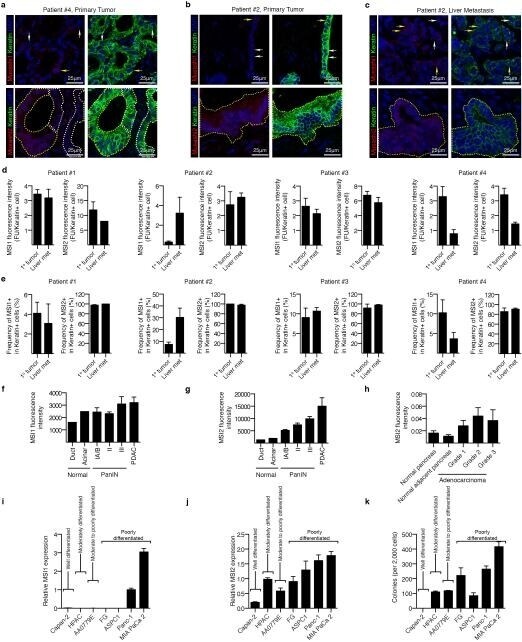
- Extended Data Figure 2 Validation of Msi1 and Msi2 reporter mice ( a ) FACs analysis of Msi2 reporter expression in hematopoietic stem cells, progenitors and lineage-positive differentiated cells. (b) Representative image of Msi1 expression in FACs sorted YFP+ neuronal cells; YFP (green), Msi1 (red), and DAPI (blue). (c) Representative image of Msi2 expression in FACs sorted GFP+ hematopoietic cells; GFP (green), Msi1 (red), and DAPI (blue). ( d-e ) Msi-expression in keratin+ cells. ( d ) Msi1-YFP reporter (green, white arrows) and keratin (red) staining was performed on tissue sections of REM1-KP f/f C mice; ( e ) Msi2-GFP reporter (green, white arrows) and keratin (red) staining was performed on tissue sections of REM2-KP f/f C mice. DAPI staining is shown in blue. Rare cells (
- Submitted by
- Invitrogen Antibodies (provider)
- Main image

- Experimental details
- Extended Data Figure 1 The Musashi genes MSI1 and MSI1 are expressed in human pancreatic adenocarcinoma ( a, top row ) Representative images of a primary patient pancreatic adenocarcinoma sample stained with anti-keratin (green), DAPI (blue), and anti-MSI1 (red) antibodies. White arrows indicate MSI1 negative cells; yellow arrow indicates a MSI1 positive cell ( a, bottom row ) Representative images of a primary patient pancreatic adenocarcinoma sample stained with anti-keratin (green), DAPI (blue), and anti-MSI2 (red) antibodies. White dotted regions indicate MSI2 negative cells while yellow dotted regions indicate MSI2 positive cells. ( b, top row ) Representative images of a primary patient pancreatic adenocarcinoma sample stained with anti-keratin (green), DAPI (blue), and anti-MSI1 (red) antibodies. White arrows indicate MSI1 negative cells; yellow arrow indicates a MSI1 positive cell. ( b, bottom row ) Representative images of a primary patient pancreatic adenocarcinoma sample stained with anti-keratin (green), DAPI (blue), and anti-MSI2 (red) antibodies. Yellow dotted region indicates MSI2 positive cells. ( c, top row ) Representative images of a matched liver metastasis from a patient with pancreatic adenocarcinoma stained with anti-keratin (green), DAPI (blue), and anti-MSI1 (red) antibodies. White arrows indicate MSI1 negative cells; yellow arrows indicate MSI1 positive cells. ( c, bottom row ) Representative images of a matched liver metastasis from a patient with p
- Submitted by
- Invitrogen Antibodies (provider)
- Main image

- Experimental details
- Figure 1 IL-1beta suppresses stem cell self-renewal gene expression in mouse NSCs. ( A ) Morphological changes of NSCs treated with 1 ng/ml IL-1beta. ( B ) Difference in cell proliferation between mock control (PBS, Cont) and 1 ng/ml IL-1beta-treated cells. Cell numbers were normalized by initial cell number (1 x 10 5 cells/ml). The asterisks represent a significant difference (P < 0.05) between the groups. ( C ) qPCR for genes related to NSC self-renewal. Specimens were collected at each time point after 1 ng/ml IL-1beta administration. Characters a-c represent significant differences among groups (P < 0.05) determined by Tukey-Kramer HSD test for multiple comparison. Briefly, the different characters above each column ( e.g. a and b) represent significant differences among the columns and the same characters above different columns ( e.g. a and a) show no significant difference. ( D ) Western blots for Nestin, Nf-M, Msi1, Hes1 and Bmi1 for NSCs treated with 1 ng/ml IL-1beta administration. ( E ), Western blot for Caspase 3, demonstrating no measurable change cleaved-caspase related to apoptosis.

- Submitted by
- Invitrogen Antibodies (provider)
- Main image

- Experimental details
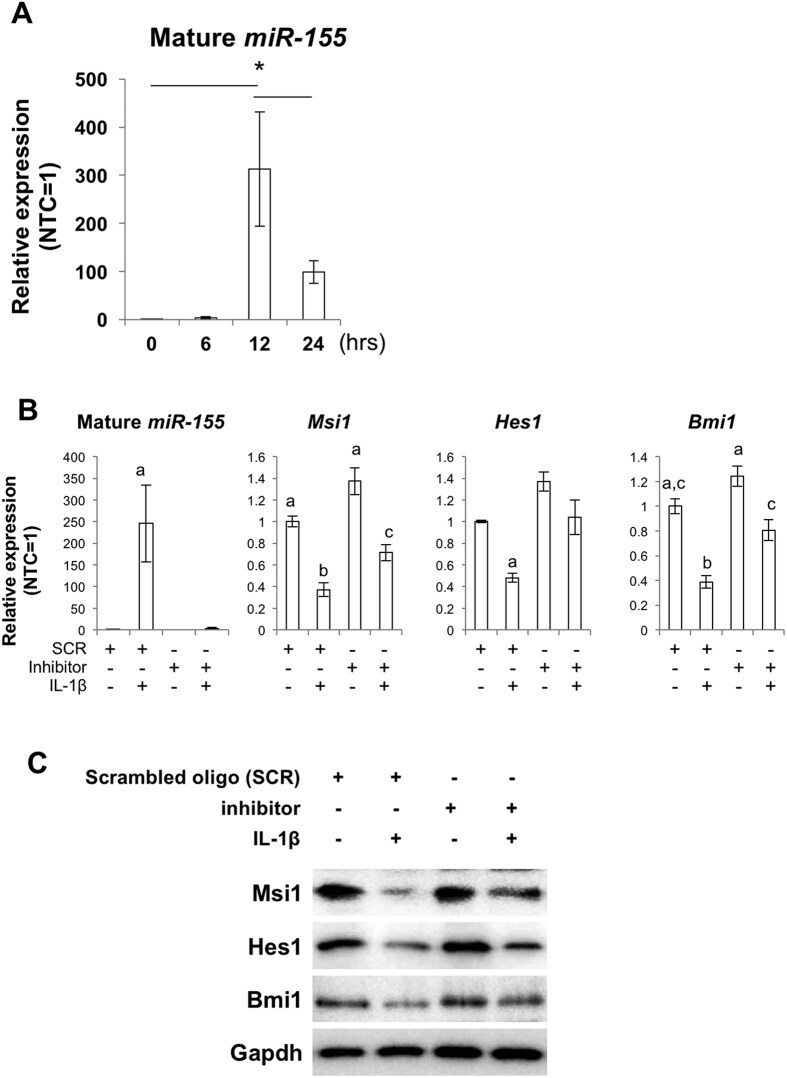
- Figure 2 miR-155 is involved in IL-1beta-induced suppression of self-renewal genes. ( A ) IL-1beta-induced expression of mmu-miR-155 (miR-155). The y-axis represents expression relative to the no-treatment control (NTC). U6 small nuclear RNA (snRNA) was used as an internal control. The asterisks represent a significant difference (P < 0.05) between the groups. ( B ) qPCR for mature miR-155, Msi1, Hes1 and Bmi1 in NSCs treated with the scrambled oligonucleotide (SCR, control), the miRNA inhibitor oligonucleotide to mmu-miR-155 (inhibitor) and 1 ng/ml IL-1beta. Treatment with the inhibitor ameliorated suppression of Msi1, Hes1 and Bmi1 expression by IL-1beta. Characters a-c represent significant differences among groups (P < 0.05) determined by Tukey-Kramer HSD test for multiple comparison. ( C ) Western blots for Msi1, Hes1 and Bmi1 for NSCs treated with the SCR, inhibitor and IL-1beta.
- Submitted by
- Invitrogen Antibodies (provider)
- Main image
- Experimental details
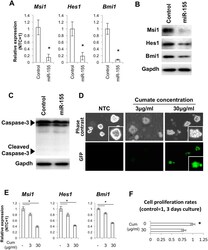
- Figure 3 Over-expression of miR-155 leads to suppression of the self-renewal genes Msi1, Hes1 and Bmi1 and inhibition of self-renewal. ( A ) qPCR for Msi1, Hes1 and Bmi1 for NSCs transfected with the GFP-NTC (control) and the GFP-mmu-miR-155 (miR-155) plasmids. Asterisks represent significant differences (P < 0.05) compared with control. ( B ) Western blots for Msi1, Hes1 and Bmi1 for NSCs transfected with the control and miR-155 plasmids. ( C ) Western blot for caspase 3 for NSCs transfected with control and miR-155 plasmids. ( D ) Cumate induction of miR-155 and GFP expression in NSCs transfected with pPBQM-miR155-IRES-GFP. ( E ) qPCR for Msi1, Hes1 and Bmi1 for NSCs stably expressing pPBQM-miR155-IRES-GFP (QM-miR155). Asterisks represent significant differences (P < 0.05) among groups. ( F ) Rates of cell proliferation for NSCs stably expressing QM-miR155 with and without cumate treatment. Cell numbers were normalized by cell numbers for the control group at 3 days of culture. The asterisk represents a significant difference (P < 0.05).

- Submitted by
- Invitrogen Antibodies (provider)
- Main image
- Experimental details
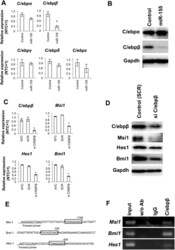
- Figure 4 C/EBPbeta is involved in miR-155-mediated attenuation of the stem cell self-renewal genes in NSCs. ( A ) Quantitative RT-PCR for C/EBP family members in NSCs overexpressing miR-155. The control was NSCs transfected with a scrambled sequence. The asterisk represents a significant difference (P < 0.05) compared with the control. ( B ) Western blots for C/EBPalpha and beta after overexpression of miR-155. The control was NSCs transfected with a scrambled sequence. ( C ) Suppression of C/EBPbeta expression, as well as levels of Msi1, Hes1 and Bmi1 . NTC = no-treatment control. SCR = scrambled oligonucleotide sequence RNA-transfected control. Asterisks represent significant differences (P < 0.05) compared with the NTC and SCR groups. ( D ) Western blots for Msi1, Hes1 and Bmi1 for NSCs treated with C/EBPbeta siRNA. ( E ) Binding motifs for C/EBP transcription factors in the target regions used for ChIP-PCR analysis. ( F ) ChIP-PCR analysis for DNA immunoprecipitated by anti-C/EBPbeta antibody.

- Submitted by
- Invitrogen Antibodies (provider)
- Main image

- Experimental details
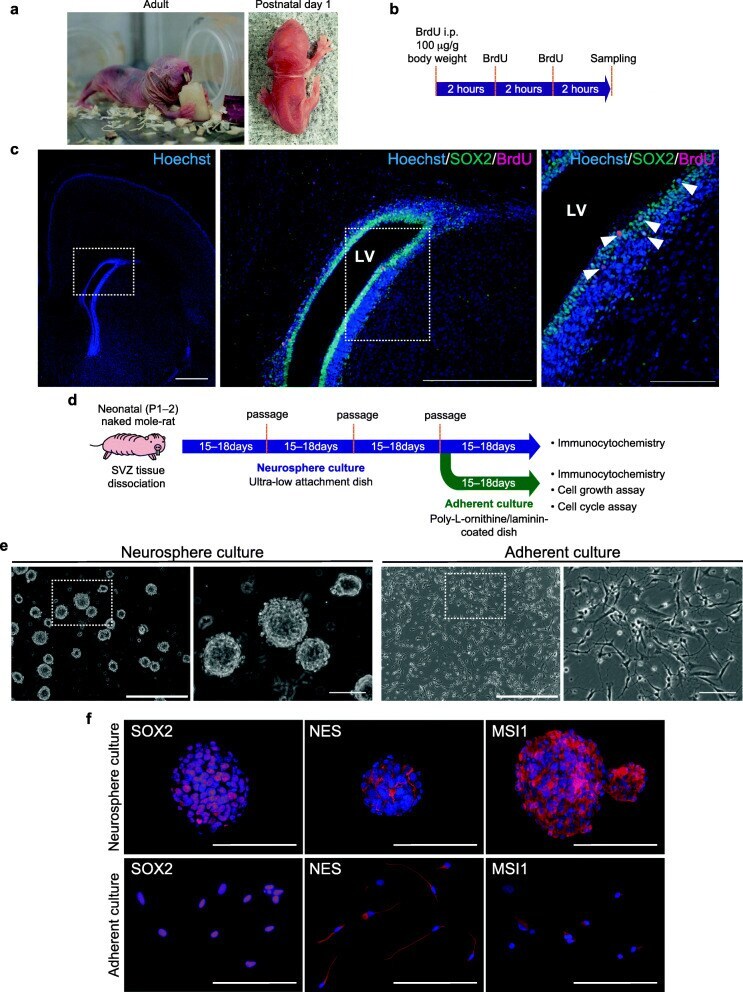
- Fig. 1 Isolation and characterization of neural stem/progenitor cells (NS/PCs) from the subventricular zone (SVZ) of neonatal naked mole-rats (NMRs). a An adult NMR (left) and a NMR at postnatal day 1 (right). b Timeline of the experimental procedure for BrdU labeling. c Immunofluorescence images of SRY-box transcription factor 2 (SOX2; green), BrdU (magenta), and Hoechst 33342 (blue) in the neonatal NMR SVZ. Left, a low magnification image of Hoechst staining in the NMR neonatal brain. Center, an enlarged image of the boxed region in the left image. Right, a higher magnification image of the boxed region in the center image. White arrowheads indicate SOX2/BrdU double-positive cells. Scale bars: 500 mum (left), 500 mum (center), and 100 mum (right). LV, lateral ventricle. d Timeline of the experimental procedure for primary neurosphere and adherent culture of NS/PCs from the NMR SVZ. e Morphologies of NMR-NS/PCs under neurosphere and adherent culture conditions. The boxed regions in the left images are enlarged in the right images. Scale bars: 500 mum (left) and 100 mum (right). f Immunofluorescence images of SOX2, nestin (NES), and musashi RNA-binding protein 1 (MSI1) in NMR-NS/PCs under each culture condition. Blue, Hoechst 33342. Scale bars: 100 mum
- Submitted by
- Invitrogen Antibodies (provider)
- Main image

- Experimental details
- Fig. 2. Molecular characterization of the newt mesencephalic subregions and description of the regenerated cytoarchitecture in two rostrocaudal levels. (A) Immunohistochemistry for Pax7, Lim1/2 and COUP-TFI on medial coronal sections of the intact newt mesencephalon defined as three major subregions (OT, Ts, Teg). The OT is characterized by heterogeneous expression of Pax7, COUP-TFI and Lim1/2 in the neuronal layer. (B,C) The Pax7-expressing unilateral OT was removed (B, n =4) and regenerated (C, n =3) after surgery. EdU-labeled newly generated cells were detected broadly in the injured area in 6 wpl regenerates, and some of them expressed Pax7 (positive, arrowheads; negative, arrows). (D) Schematic drawing of left-side view of the expression patterns of Pax7, Lim1/2 and COUP-TFI in the excised brain. (E,F) Immunohistochemistry for ependymoglia markers (GFAP, Msi1), a neuronal marker (HuC/D) and regional markers (Pax7, Lim1/2, COUP-TFI) on coronal sections of intact (E, n =3) and regenerated (F, n =3) mesencephalons reveals that the original cellular diversity in the OT was regenerated within 20-30 wpl at all rostrocaudal levels, whereas only the medial-to-caudal level recovered the apical-basal orientation of GFAP + radial processes of Msi1 + ependymoglia cells like that in the intact mesencephalon (medial sections). (G) Schematic representation of immunohistochemical results. Asterisks indicate the regenerated area. Dotted lines indicate shapes of the mesencephalon,

- Submitted by
- Invitrogen Antibodies (provider)
- Main image
- Experimental details
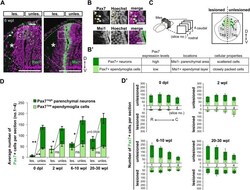
- Fig. 3. All rostrocaudal levels rapidly regenerate Pax7 low ependymoglia cells and gradually recover Pax7 high neurons. (A-B') Immunohistochemistry for Pax7 and Msi1 on adjacent coronal sections of the regenerating brain at 6 wpl, showing that Pax7 + ependymoglia cells and neurons in the OT have different expression levels of Pax7 and distinct locations and morphologies. Dotted lines indicate shapes of the mesencephalon and dissected surfaces. Asterisks indicate the regenerated area. Boxed regions as depicted in A. (B) Pax7 high neurons exhibiting a rounded morphology were found in the Msi1 - parenchyma (arrowheads), while Pax7 low ependymoglia cells displaying epithelial morphologies were found in the Msi + ependymal layer. These evaluation criteria are summarized in B'. (C) For counting cells, coronal sections were obtained from four different rostrocaudal levels (nos. 1-4, from rostral to caudal). By using adjacent coronal sections for Msi1 immunostaining, we counted the number of Pax7 high neurons and Pax7 low ependymoglia cells according to the evaluation criteria. Right panel depicts a typical image of sectioning. (D) Stacked bar chart shows the average number of Pax7 low ependymoglia cells and Pax7 high neurons in four coronal sections of regenerating OT [lesioned (les.) and unlesioned (unles.) side] at 0 dpl, 2 wpl, 6-10 wpl and 20-30 wpl ( n =3 animals, mean+-s.e.m., ns>0.05, * P

- Submitted by
- Invitrogen Antibodies (provider)
- Main image

- Experimental details
- Fig. 4. Spatio-temporal patterns of cell proliferation reflect caudal-biased wound closure by ependymoglia cells. (A) For counting cells, coronal sections were obtained from nine different rostrocaudal levels (nos.1-3; rostral, nos.4-6; medial, nos.7-9; caudal). Right panel shows a typical image of sectioning. (B) Schema of in vivo EdU labeling for S-phase cell detection. (C) Quantification of the average number of EdU + /Msi1 + S-phase or pH3 + /Msi1 + M-phase proliferating ependymoglia cells in entire coronal sections (nos.1-9) of 0 dpl, 10 dpl, 2 wpl and 4 wpl regenerates ( n =4 animals, mean+-s.e.m.) revealed that proliferation actively occurred around 2 wpl. (E-G) Scatter and box plots of EdU + /Msi1 + S-phase cells at three different rostrocaudal levels in 10 dpl, 2 wpl and 4 wpl regenerates (upper panels, n =4 animals, n =3 sections) revealed that robust proliferation of S-phase cells occurred in the caudal mesencephalon at 10 dpl (E) and 2 wpl (F). S-phase cells were counted separately in the lesioned and unlesioned side of a mesencephalic section depicted as in A (lower panels, n =4 animals, mean+-s.e.m.). (H) Immunohistochemistry for Msi1 on coronal sections at rostral and medial-to-caudal levels of the regenerating brain at 2, 4, and 10 wpl. Proliferating cells were detected by EdU incorporation or immunostaining with pH3 antibody. Arrowheads indicate abnormal gap between newly formed and the pre-existing ependymal layer, while in contrast, arrows indicate

- Submitted by
- Invitrogen Antibodies (provider)
- Main image

- Experimental details
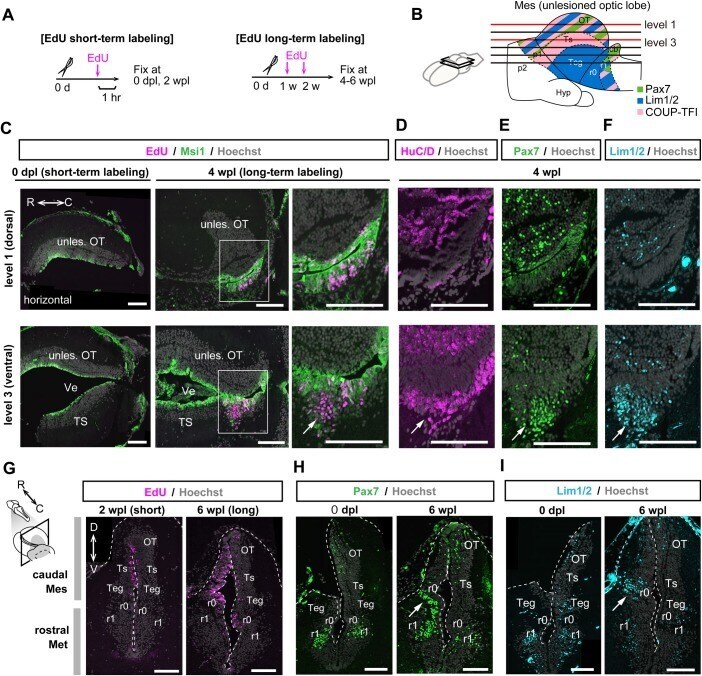
- Fig. 5. Early differentiation occurs around the isthmus. (A) Experimental designs of EdU short-term labeling for detection of proliferating cells, and EdU long-term labeling for cell fate tracing of proliferated cells. (B) Schematic representation of section levels used for immunohistochemistry and EdU detection (level 1 and level 3 for panels C-F). The results from six horizontal levels are shown in Fig. S5 . (C) EdU detection and immunohistochemistry for Msi1 on horizontal sections at two dorsoventral levels of the lesioned brain at 0 dpl and 4 wpl, showing that Msi1 low /EdU + cells can be found predominantly in the caudoventral mesencephalon at the early regeneration stage (arrow). In contrast, caudodorsal mesencephalon maintained undifferentiated ependymoglia cells (Msi1 high /EdU + ) at the same stage. (D-F) Caudodorsal and caudoventral sections adjacent to C (4 wpl) showed that Msi1 low /EdU + cells in the caudoventral mesencephalon (C-F, arrows) expressed a pan-neural marker HuC/D (D), Pax7 (E) and/or Lim1/2 (F). In contrast, Msi1 high /EdU + undifferentiated ependymoglia cells in the caudodorsal mesencephalon expressed Pax7 (E), and did not express HuC/D (D) and Lim1/2 (F). (G) Coronal sections of the caudal mesencephalon at 2 wpl and 6 wpl, showing that EdU-labeled cells were actively proliferating around the r0 (isthmus) between 2 wpl and 6 wpl. (H,I) Coronal sections of the caudal mesencephalon at 0 dpl and 6 wpl, showing that Pax7 + (H) and Lim1/2 + (I) ea
- Submitted by
- Invitrogen Antibodies (provider)
- Main image

- Experimental details
- Extended Data Figure 5 Selection for escaper Msi expressing cells in Msi1, Ms2 single and double knockout KP f/f C mice (a-c) Immunohistochemical staining for (a) IgG control (n=4), or (b-c, red ) Msi2 in 13 week old WT-KP f/f C (n=4) and Msi2 -/- KP f/f C (n=4) mice. (d ) Immunohistochemical staining for Msi2 (red) in 22 week old Msi2 -/- KP f/f C mouse (n=1). ( e-g ) Immunohistochemical staining for ( e ) IgG control, ( f, red) Msi1 and ( g , red) Msi2 in 15-week-old Msi1 f/f Msi2 -/- double knockout KP f/f C mouse (n=1). ( h ) Survival curves of Msi1 f/f Msi2 -/- -KP f/f C (n=6) or WT-KP f/f C tumors (n=35). Source Data for all panels are available online.
