Antibody data
- Antibody Data
- Antigen structure
- References [12]
- Comments [0]
- Validations
- Flow cytometry [2]
- Other assay [14]
Submit
Validation data
Reference
Comment
Report error
- Product number
- 61-0289-41 - Provider product page

- Provider
- Invitrogen Antibodies
- Product name
- CD28 Monoclonal Antibody (CD28.2), PE-eFluor™ 610, eBioscience™
- Antibody type
- Monoclonal
- Antigen
- Other
- Description
- Description: The CD28.2 monoclonal antibody reacts with the human CD28 molecule, a 44 kDa homodimer expressed by thymocytes, mature T cells and plasma cells. CD28 is a ligand for CD80 (B7-1) and CD86 (B7-2) and is a potent co-stimulator of T cells. Signaling through CD28 augments IL-2 and IL-2 receptor expression as well as cytotoxicity of CD3-activated T cells. Applications Reported: This CD28.2 antibody has been reported for use in flow cytometric analysis. Applications Tested: This CD28.2 antibody has been pre-titrated and tested by flow cytometric analysis of normal human peripheral blood cells. This can be used at 5 µL (0.25 µg) per test. A test is defined as the amount (µg) of antibody that will stain a cell sample in a final volume of 100 µL. Cell number should be determined empirically but can range from 10^5 to 10^8 cells/test. PE-eFluor® 610 can be excited with laser lines from 488-561 nm and emits at 607 nm. We recommend using a 610/20 band pass filter (equivalent to PE-Texas Red®). Please make sure that your instrument is capable of detecting this fluorochome. Light sensitivity: This tandem dye is sensitive to photo-induced oxidation. Please protect this vial and stained samples from light. Fixation: Samples can be stored in IC Fixation Buffer (Product # 00-8222) (100 µL of cell sample + 100 µL of IC Fixation Buffer) or 1-step Fix/Lyse Solution (Product # 00-5333) for up to 3 days in the dark at 4°C with minimal impact on brightness and FRET efficiency/compensation. Some generalizations regarding fluorophore performance after fixation can be made, but clone specific performance should be determined empirically. Excitation: 488-561 nm; Emission: 607 nm; Laser: Blue Laser, Green Laser, Yellow-Green Laser. Filtration: 0.2 µm post-manufacturing filtered.
- Reactivity
- Human
- Host
- Mouse
- Isotype
- IgG
- Antibody clone number
- CD28.2
- Vial size
- 25 Tests
- Concentration
- 5 µL/Test
- Storage
- 4°C, store in dark, DO NOT FREEZE!
Submitted references CD19 Chimeric Antigen Receptor-Exosome Targets CD19 Positive B-lineage Acute Lymphocytic Leukemia and Induces Cytotoxicity.
Effects of the Antidiabetic Drugs Evogliptin and Sitagliptin on the Immune Function of CD26/DPP4 in Th1 Cells.
SIRT1 is downregulated by autophagy in senescence and ageing.
PD-1 and BTLA regulate T cell signaling differentially and only partially through SHP1 and SHP2.
Selective Killing of Activated T Cells by 5-Aminolevulinic Acid Mediated Photodynamic Effect: Potential Improvement of Extracorporeal Photopheresis.
Expression of CD27 and CD28 on γδ T cells from the peripheral blood of patients with allergic rhinitis.
Metabolic reprogramming of human CD8(+) memory T cells through loss of SIRT1.
The Distribution of Human Stem Cell-like Memory T Cell in Lung Cancer.
CD28 family of receptors on T cells in chronic HBV infection: Expression characteristics, clinical significance and correlations with PD-1 blockade.
Detailed characterization of tumor infiltrating lymphocytes in two distinct human solid malignancies show phenotypic similarities.
Aging and cytomegalovirus infection differentially and jointly affect distinct circulating T cell subsets in humans.
A novel method for autophagy detection in primary cells: impaired levels of macroautophagy in immunosenescent T cells.
Haque S, Vaiselbuh SR
Cancers 2021 Mar 19;13(6)
Cancers 2021 Mar 19;13(6)
Effects of the Antidiabetic Drugs Evogliptin and Sitagliptin on the Immune Function of CD26/DPP4 in Th1 Cells.
Yoon H, Sung JH, Song MJ
Biomolecules & therapeutics 2021 Mar 1;29(2):154-165
Biomolecules & therapeutics 2021 Mar 1;29(2):154-165
SIRT1 is downregulated by autophagy in senescence and ageing.
Xu C, Wang L, Fozouni P, Evjen G, Chandra V, Jiang J, Lu C, Nicastri M, Bretz C, Winkler JD, Amaravadi R, Garcia BA, Adams PD, Ott M, Tong W, Johansen T, Dou Z, Berger SL
Nature cell biology 2020 Oct;22(10):1170-1179
Nature cell biology 2020 Oct;22(10):1170-1179
PD-1 and BTLA regulate T cell signaling differentially and only partially through SHP1 and SHP2.
Xu X, Hou B, Fulzele A, Masubuchi T, Zhao Y, Wu Z, Hu Y, Jiang Y, Ma Y, Wang H, Bennett EJ, Fu G, Hui E
The Journal of cell biology 2020 Jun 1;219(6)
The Journal of cell biology 2020 Jun 1;219(6)
Selective Killing of Activated T Cells by 5-Aminolevulinic Acid Mediated Photodynamic Effect: Potential Improvement of Extracorporeal Photopheresis.
Darvekar S, Juzenas P, Oksvold M, Kleinauskas A, Holien T, Christensen E, Stokke T, Sioud M, Peng Q
Cancers 2020 Feb 6;12(2)
Cancers 2020 Feb 6;12(2)
Expression of CD27 and CD28 on γδ T cells from the peripheral blood of patients with allergic rhinitis.
Wang Q, Sun Q, Chen Q, Li H, Liu D
Experimental and therapeutic medicine 2020 Dec;20(6):224
Experimental and therapeutic medicine 2020 Dec;20(6):224
Metabolic reprogramming of human CD8(+) memory T cells through loss of SIRT1.
Jeng MY, Hull PA, Fei M, Kwon HS, Tsou CL, Kasler H, Ng CP, Gordon DE, Johnson J, Krogan N, Verdin E, Ott M
The Journal of experimental medicine 2018 Jan 2;215(1):51-62
The Journal of experimental medicine 2018 Jan 2;215(1):51-62
The Distribution of Human Stem Cell-like Memory T Cell in Lung Cancer.
Hong H, Gu Y, Sheng SY, Lu CG, Zou JY, Wu CY
Journal of immunotherapy (Hagerstown, Md. : 1997) 2016 Jul-Aug;39(6):233-40
Journal of immunotherapy (Hagerstown, Md. : 1997) 2016 Jul-Aug;39(6):233-40
CD28 family of receptors on T cells in chronic HBV infection: Expression characteristics, clinical significance and correlations with PD-1 blockade.
Tang ZS, Hao YH, Zhang EJ, Xu CL, Zhou Y, Zheng X, Yang DL
Molecular medicine reports 2016 Aug;14(2):1107-16
Molecular medicine reports 2016 Aug;14(2):1107-16
Detailed characterization of tumor infiltrating lymphocytes in two distinct human solid malignancies show phenotypic similarities.
Kovacsovics-Bankowski M, Chisholm L, Vercellini J, Tucker CG, Montler R, Haley D, Newell P, Ma J, Tseng P, Wolf R, Vetto JT, Hammill C, Hansen P, Weinberg AD
Journal for immunotherapy of cancer 2014;2(1):38
Journal for immunotherapy of cancer 2014;2(1):38
Aging and cytomegalovirus infection differentially and jointly affect distinct circulating T cell subsets in humans.
Wertheimer AM, Bennett MS, Park B, Uhrlaub JL, Martinez C, Pulko V, Currier NL, Nikolich-Žugich D, Kaye J, Nikolich-Žugich J
Journal of immunology (Baltimore, Md. : 1950) 2014 Mar 1;192(5):2143-55
Journal of immunology (Baltimore, Md. : 1950) 2014 Mar 1;192(5):2143-55
A novel method for autophagy detection in primary cells: impaired levels of macroautophagy in immunosenescent T cells.
Phadwal K, Alegre-Abarrategui J, Watson AS, Pike L, Anbalagan S, Hammond EM, Wade-Martins R, McMichael A, Klenerman P, Simon AK
Autophagy 2012 Apr;8(4):677-89
Autophagy 2012 Apr;8(4):677-89
No comments: Submit comment
Supportive validation
- Submitted by
- Invitrogen Antibodies (provider)
- Main image

- Experimental details
- Staining of normal human peripheral blood cells with Anti-Human CD19 APC (Product # 17-0199-42) and Mouse IgG1 K Isotype Control PE-eFluor® 610 (Product # 61-4714-82) (left) or Anti-Human CD28 PE-eFluor® 610 (right). Cells in the lymphocyte gate were used for analysis.
- Submitted by
- Invitrogen Antibodies (provider)
- Main image

- Experimental details
- Staining of normal human peripheral blood cells with Anti-Human CD19 APC (Product # 17-0199-42) and Mouse IgG1 K Isotype Control PE-eFluor® 610 (Product # 61-4714-82) (left) or Anti-Human CD28 PE-eFluor® 610 (right). Cells in the lymphocyte gate were used for analysis.
Supportive validation
- Submitted by
- Invitrogen Antibodies (provider)
- Main image

- Experimental details
- NULL
- Submitted by
- Invitrogen Antibodies (provider)
- Main image

- Experimental details
- NULL
- Submitted by
- Invitrogen Antibodies (provider)
- Main image

- Experimental details
- NULL
- Submitted by
- Invitrogen Antibodies (provider)
- Main image
- Experimental details
- NULL
- Submitted by
- Invitrogen Antibodies (provider)
- Main image
- Experimental details
- NULL
- Submitted by
- Invitrogen Antibodies (provider)
- Main image

- Experimental details
- Figure 5 CD8 + T cells phenotype in CRC and OVC patients. A . An example of flow cytometric analysis of CD3 + CD8 + T cells analyzed for CD28 and Ki-67, upper panels, and HLA-DR and CD38, lower panels. Percentage of Ki-67 + CD8 T cells in CRC samples (n = 16) B . and OVC samples (n = 22) C . Co-expression of CD38 and HLA-DR on CD8 + T cells in CRC samples (D) and OVC samples (E) .
- Submitted by
- Invitrogen Antibodies (provider)
- Main image

- Experimental details
- Figure 5 ALA-induced PpIX production and PDT of CD4 + CD25 + T cells. Healthy donor PBMCs were either activated in vitro with anti-CD3/IL-2 or anti-CD3/CD28 or kept non-activated (resting) for three days. ( A ) geometric mean fluorescence intensity (Geo. MFI) of PpIX in CD4 + CD25 + cells incubated with 3 mM ALA for 1 h at 37 degC after anti-CD3/IL-2 or anti-CD3/CD28 activation; ( B , C and D ) resting and activated cells were incubated with 3 mM ALA for 1 h and then exposed to the in-house built LED blue light as indicated. The survivals of CD4 + CD25 + T cells were measured before light or 20 h after light exposure with flow cytometry as described in Figure 3 ; ( B ) for resting cells; while ( C and D ) for activated cells with anti-CD3/IL-2 and anti-CD3/CD28, respectively. * p < 0.05.
- Submitted by
- Invitrogen Antibodies (provider)
- Main image

- Experimental details
- FIGURE 1 Identification of Tscm CD4 + CD45RA + CD45RO - CD62L + CCR7 + CD127 + CD27 + CD28 + CD95 + CD122 + T (Tscm) cell in human blood and lymph nodes. PBMCs were isolated from the blood of non-small cell lung cancer (NSCLC) patients (n=15) (NSCLC-PBMC) and healthy donors (n=11) (HD-PBMC); lymphocytes were isolated from the tumor-infiltrated lymph node of NSCLC patients who were collected blood at same time (n=7) (NSCLC-Ly); lymphocytes were isolated from the healthy lymph node of non lung cancer patients (n=7) (Normal-Ly), analyzed by flow cytometry. A, Representative flow cytometric analyses of CD4 + CD45RA + CD45RO - CD62L + CCR7 + CD127 + CD27 + CD28 + CD95 + CD122 + T cells, indicating Tscm cells. B, The frequency of the CD4 + Tscm cells in the HD-PBMC, NSCLC-PBMC, Normal-Ly, NSCLC-Ly. The events of CD4 + Tscm cells in the blood and lymph node from NSCLC patients and healthy donors, expressed as the mean+-SEM. C, The frequency of the CD8 + Tscm cells in the HD-PBMC, NSCLC-PBMC, Normal-Ly, NSCLC-Ly, expressed as the mean+-SEM. D, The events of Tscm of CD4 + and CD8 + cells in the blood and the lymph node from NSCLC patients and healthy donors. HD indicates healthy donors; IFN, interferon; PBMC, peripheral blood mononuclear cells; Tscm cell, stem cell-like memory T cell. * P
- Submitted by
- Invitrogen Antibodies (provider)
- Main image

- Experimental details
- Figure 3. Altered FoxO1 gene expression in CD8 + CD28 - T cells. (A) Microarray analysis in CD8 + CD28 + and CD28 - T cells, predicting FoxO1 as an altered transcriptional regulator in CD8 + CD28 - T cells. (B) CCR7 , CD62L , IL7R , and KLRG1 mRNA were assessed by qRT-PCR and normalized to RPL13A mRNA from sorted human T cell populations ( n = 5, paired one-way ANOVA). (C) Peripheral blood mononuclear cells were stained for CD3, CD8, CD28, and indicated markers as in B and analyzed by flow cytometry ( n = 5, paired one-way ANOVA). (D and E) FoxO1 expression in sorted human T cells was measured by Western blot (representative, n = 7, paired two-tailed Student's t test). (F) FoxO1 mRNA was analyzed by qRT-PCR and normalized to RPL13A ( n = 8). (G and H) CD28 + and CD28 - T cells were treated with 20 uM MG132 for 6 h, and FoxO1 expression was measured by Western blot ( n = 3, unpaired two-tailed Student's t test, G shows CD28 - T cells). (I and J) SIRT1 knockdown by Cas9-RNP nucleofection and Western blot for SIRT1 and FoxO1 expression ( n = 9, two-way ANOVA). (K) Nucleofection of recombinant SIRT1 protein into CD8 + T cells and Western blot for SIRT1 and FoxO1 protein 18 h after nucleofection (representative, n = 2). (L) Densitometry of two independent experiments ( n = 2). Data are mean +- SEM of individual donors. *, P < 0.05; **, P < 0.01; ***, P < 0.001; ****, P < 0.000. ns, not significant.
- Submitted by
- Invitrogen Antibodies (provider)
- Main image

- Experimental details
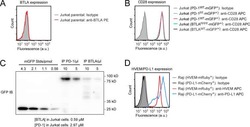
- Figure 2 Confirmation of CD19 CAR plasmid into the transfected producer cell line. ( A ) Agarose gel demonstrating cellular mRNA expression (eGFP, CD8a, and CD28) in CD19 CAR plasmid transfected HEK293T cells and control non-transfected cells (WT-control). The beta-actin band is same for each gene of interest because same sample/cDNA was used for PCR amplification of eGFP, CD8a, and CD28. ( B ) Protein expression by flow cytometry (contour plot) demonstrating surface protein expression of CD3z, CD8a, and CD28 co-localized with eGFP expression in CD19 CAR plasmid transfected HEK293T cells (CD19 CAR) and non-transfected cells (WT-control). Bar graph is representation of the three replicates. p -value (*** p < 0.001). This is a representation of cellular CD3z, CD8a, and CD28 expression.
- Submitted by
- Invitrogen Antibodies (provider)
- Main image
- Experimental details
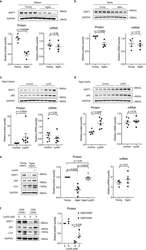
- Figure 5. SIRT1 undergoes lysosomal degradation during aging in mouse and human. a,b, Spleens ( a ) and testes ( b ) from young (2-4 months) and aged (19-26 months) C57BL/6 mice were analyzed by western blotting and RT-qPCR. Data are mean +- s.e.m. ; unpaired two-tailed Students' t-test; n = 4 animals. c,d, Spleens ( c ) and testes ( d ) were analyzed by western blotting and RT-qPCR for SIRT1 expression, from aged (19-24 months) mice subjected to daily i.p. injection of 10 mg/kg Lys05 in PBS or PBS control in 100 muL volume for two weeks. Data are mean +- s.e.m. ; two-tailed Mann-Whitney test. For spleen protein, control group n = 8 animals, Lys05 group n = 7 animals; RNA, control group n = 8 animals, Lys05 group n = 6 animals. For testis protein and RNA, control group n=6 animals, Lys05 group n=6 animals. e. HSPC populations were isolated from young (2-4 months) and aged (20-26 months) C57BL/6 mice, cultured with or without 2 muM Lys05 for 24 hours and analyzed by western blotting and RT-qPCR. For protein, data are mean +- s.e.m. ; one-way ANOVA coupled with Tukey's test; n=6 independent experiments. For RNA, data are mean +- s.e.m. ; unpaired two-tailed Students' t-test; n=4 independent experiments. f. Freshly sorted CD8 + CD28 + (control) and CD8 + CD28 - T cells were treated with Lys05 at doses of 0 and 5 muM for 14 hours, and then were harvested and analyzed by western blotting. Donor age: 53, 54 and 66. Data are mean +- s.d. ; unpaired two-tailed Students' t-test; n = 3
- Submitted by
- Invitrogen Antibodies (provider)
- Main image
- Experimental details
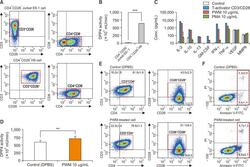
- Fig. 1 Characterization of CD26 expression, mDPP4 enzymatic activity, and cytokine expression in T helper cell lines. (A, B) Jurkat E6 and H9 Th1 cells were harvested and analyzed for the expression of T cell-specific surface markers, including CD3, CD4, and CD26 (A), and for their mDPP4 enzymatic activity (B). (C) H9 Th1 cells were treated with various T cell activators, including T-Activator CD3/CD28, PWM (10 ug/mL), and PMA (10 ug/mL) for 3 h. The expressions of 18 cytokines and 6 MMPs were measured in the culture supernatants of treated cells using two different panels of fluorescent multiplex bead assays. Activated T helper cell-specific cytokines, including IL-2, IL-10, IL-13, GM-CSF, IFN-gamma, and TNF-alpha, are shown. VEGF and MMP 9 are also included as detected high in all the samples. (D-F) H9 Th1 cells were treated with 10 ug/mL PWM for 12 h and subjected to mDPP4 enzymatic assays (D), FACS analysis for T helper cell-specific surface markers such as CD3, CD4, CD26, and CD28 (E), and analysis for apoptosis using an annexin V kit and flow cytometry (F). All analyses were repeated in three independent batches, and the data are shown as the means and standard deviation. ** p
- Submitted by
- Invitrogen Antibodies (provider)
- Main image

- Experimental details
- Figure 3 Expression pattern of CD27 and CD28 on gammadelta T cells in AR. (A) Representative flow cytometry plots of the expression of CD27 and CD28 on gammadelta T cells among PBMCs from HC (n=12) and AR (n=14) subjects. (B-G) Quantification of the percentage of (B) CD27+, (C) CD28+, (D) CD27 + CD28 + , (E) CD27 + CD28 - , (F) CD27 - CD28 + and (G) CD27 - CD28 - gammadelta + T cells in PBMCs. Values are expressed as the mean +- standard deviation. AR, allergic rhinitis; HC, healthy controls; PBMCs, peripheral blood mononuclear cells.
- Submitted by
- Invitrogen Antibodies (provider)
- Main image
- Experimental details
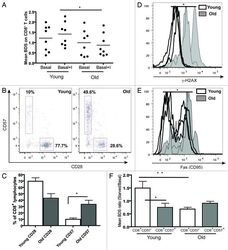
- Figure 5. Aging and replicative senescence markers in human T lymphocytes. PBMCs from healthy young (< 28 y) and old (> 56 y) donors were stained for CD28 and CD57 and run on LSR II flow cytometer. (A) Autophagy levels (Mean BDS) in CD8 + T cells from young (< 28 y, n = 8) and old (> 56 y, n = 8) donors under basal and basal+I (for 2 h) conditions (mean +- SEM, *p < 0.0499 between young and old basal+I). (B) Representative dot plots from a young and an old donor showing percentages of CD28 and CD57 cells gated on CD8 + T cells. (C) Bar graph showing % of CD8 + lymphocytes with CD28 and CD57 markers in four young and old donors (mean +- SEM, p = 0.0571 for CD8 CD28 population and *p = 0.0286 for CD8 CD57 population). (D) Overlaid histogram of gammaH2AX (DNA double-strand break) levels of CD8 + lymphocytes from three young and old donors gated on CD28 + CD57 - population (geometric mean +- SEM, *p = 0.0286). (E) Overlaid histogram of FAS (CD95) levels of CD8 + lymphocytes from four young and old donors gated on CD28 + CD57 - population (geometric mean +- SEM, *p = 0.0286). PBMCs from four healthy young and old donors were cultured under control and starved conditions for 2 h and stained for CD8, CD57, LC3 and Lyso-ID. (F) Colocalization of LC3 and lysosomal marker in CD8 + CD57 +/- cells, expressed as mean BDS ratio between starved and basal treatments (mean +- SEM, n = 5 (young donors), n = 8 (old donors), **p = 0.0049, *p = 0.035).
 Explore
 Validate
 Learn
Learn Flow cytometry