Antibody data
- Antibody Data
- Antigen structure
- References [7]
- Comments [0]
- Validations
- Western blot [1]
- Immunocytochemistry [1]
- Immunohistochemistry [1]
- Flow cytometry [1]
Submit
Validation data
Reference
Comment
Report error
- Product number
- PA1-041A - Provider product page

- Provider
- Invitrogen Antibodies
- Product name
- ADORA1 Polyclonal Antibody
- Antibody type
- Polyclonal
- Antigen
- Synthetic peptide
- Description
- PA1-041A detects adenosine receptor A1 (A1AR) in rat tissues. This antibody does not detect other AR subtypes. Previous lots of this antibody have been used in human and bovine samples. PA1-041A has been successfully used in Immunohistochemistry (paraffin) and Western blot procedures. By Western blot, this antibody detects an ~37 kDa protein in rat brain representing A1AR. The PA1-041A immunogen is a synthetic peptide corresponding to residues C(309) Q P K P P I D E D L P E E K A E D(326) of rat Adenosine Receptor A1.
- Reactivity
- Human, Rat
- Host
- Rabbit
- Isotype
- IgG
- Vial size
- 100 µL
- Concentration
- 1 mg/mL
- Storage
- -20° C, Avoid Freeze/Thaw Cycles
Submitted references Systematic protein-protein interaction mapping for clinically relevant human GPCRs.
Neonatal caffeine treatment up-regulates adenosine receptors in brainstem and hypothalamic cardio-respiratory related nuclei of rat pups.
Attenuation of cerebral vasospasm and secondary injury by 17beta-estradiol following experimental subarachnoid hemorrhage.
Cell cycle-dependent regulation of SFK, JAK1 and STAT3 signalling by the protein tyrosine phosphatase TCPTP.
Adenosine A 2B receptors modulate cAMP levels and induce CREB but not ERK1/2 and p38 phosphorylation in rat skeletal muscle cells.
Adenosine A 2B receptors modulate cAMP levels and induce CREB but not ERK1/2 and p38 phosphorylation in rat skeletal muscle cells.
Adenosine A(1) receptor-mediated presynaptic inhibition at the calyx of Held of immature rats.
Sokolina K, Kittanakom S, Snider J, Kotlyar M, Maurice P, Gandía J, Benleulmi-Chaachoua A, Tadagaki K, Oishi A, Wong V, Malty RH, Deineko V, Aoki H, Amin S, Yao Z, Morató X, Otasek D, Kobayashi H, Menendez J, Auerbach D, Angers S, Pržulj N, Bouvier M, Babu M, Ciruela F, Jockers R, Jurisica I, Stagljar I
Molecular systems biology 2017 Mar 15;13(3):918
Molecular systems biology 2017 Mar 15;13(3):918
Neonatal caffeine treatment up-regulates adenosine receptors in brainstem and hypothalamic cardio-respiratory related nuclei of rat pups.
Gaytan SP, Pasaro R
Experimental neurology 2012 Oct;237(2):247-59
Experimental neurology 2012 Oct;237(2):247-59
Attenuation of cerebral vasospasm and secondary injury by 17beta-estradiol following experimental subarachnoid hemorrhage.
Lin CL, Dumont AS, Su YF, Tsai YJ, Huang JH, Chang KP, Howng SL, Kwan AL, Kassell NF, Kao CH
Journal of neurosurgery 2009 Mar;110(3):457-61
Journal of neurosurgery 2009 Mar;110(3):457-61
Cell cycle-dependent regulation of SFK, JAK1 and STAT3 signalling by the protein tyrosine phosphatase TCPTP.
Shields BJ, Court NW, Hauser C, Bukczynska PE, Tiganis T
Cell cycle (Georgetown, Tex.) 2008 Nov 1;7(21):3405-16
Cell cycle (Georgetown, Tex.) 2008 Nov 1;7(21):3405-16
Adenosine A 2B receptors modulate cAMP levels and induce CREB but not ERK1/2 and p38 phosphorylation in rat skeletal muscle cells.
Lynge J, Schulte G, Nordsborg N, Fredholm BB, Hellsten Y
Biochemical and biophysical research communications 2003 Jul 18;307(1):180-7
Biochemical and biophysical research communications 2003 Jul 18;307(1):180-7
Adenosine A(1) receptor-mediated presynaptic inhibition at the calyx of Held of immature rats.
Kimura M, Saitoh N, Takahashi T
The Journal of physiology 2003 Dec 1;553(Pt 2):415-26
The Journal of physiology 2003 Dec 1;553(Pt 2):415-26
No comments: Submit comment
Supportive validation
- Submitted by
- Invitrogen Antibodies (provider)
- Main image

- Experimental details
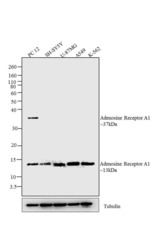
- Western blot analysis was performed on whole cell extracts (30 µg lysate) of PC 12 (Lane 1), SH-SY5Y (lane 2), U-87MG (lane 3), A549 (Lane 4) and K-562 (lane 5). The blots were probed with Anti-Adenosine receptor A1 Rabbit Polyclonal Antibody (Product # PA1-041A, 1:250-1:1000 dilution) and detected by chemiluminescence Goat Anti-Rabbit IgG Secondary Antibody, HRP conjugate (Product # G-21234, 1:5000 dilution). Two bands 37 and 13 kDa band corresponding to Adenosine receptor A1 was observed across cell lines tested.Known quantity of protein samples were electrophoresed using Novex® NuPAGE® 12 % Bis-Tris gel (Product # NP0342BOX), XCell SureLock™ Electrophoresis System (Product # EI0002) and Novex® Sharp Pre-Stained Protein Standard (Product # LC5800). Resolved proteins were then transferred onto a nitrocellulose membrane with iBlot® 2 Dry Blotting System (Product # IB21001). The membrane was probed with the relevant primary and secondary Antibody following blocking with 5 % skimmed milk. Chemiluminescent detection was performed using Pierce™ ECL Western Blotting Substrate (Product # 32106).
Supportive validation
- Submitted by
- Invitrogen Antibodies (provider)
- Main image

- Experimental details
- Immunofluorescence analysis of Adenosine Receptor A1 was done on 70% confluent log phase HeLa cells. The cells were fixed with 4% paraformaldehyde for 10 minutes, permeabilized with 0.1% Triton™ X-100 for 10 minutes, and blocked with 1% BSA for 1 hour at room temperature. The cells were labeled with Adenosine Receptor A1 Rabbit Polyclonal Antibody (Product # PA1-041A) at 2 µg/mL in 0.1% BSA and incubated for 3 hours at room temperature and then labeled with Goat anti-Rabbit IgG (H+L) Superclonal™ Secondary Antibody, Alexa Fluor® 488 conjugate (Product # A27034) at a dilution of 1:2000 for 45 minutes at room temperature (Panel a: green). Nuclei (Panel b: blue) were stained with SlowFade® Gold Antifade Mountant with DAPI (Product # S36938). F-actin (Panel c: red) was stained with Alexa Fluor® 555 Rhodamine Phalloidin (Product # R415, 1:300). Panel d is a merged image showing cytoplasmic localization. Panel e is a no primary antibody control. The images were captured at 60X magnification.
Supportive validation
- Submitted by
- Invitrogen Antibodies (provider)
- Main image

- Experimental details
- Immunohistochemistry analysis of Adenosine Receptor A1 showing positive staining in the cytoplasm of paraffin-treated Rat brain tissue (right) compared with a negative control in the absence of primary antibody (left). To expose target proteins, antigen retrieval method was performed using 10mM sodium citrate (pH 6.0) microwaved for 8-15 min. Following antigen retrieval, tissues were blocked in 3% H2O2-methanol for 15 min at room temperature, washed with ddH2O and PBS, and then probed with a Adenosine Receptor A1 polyclonal antibody (Product # PA1-041A) diluted by 3% BSA-PBS at a dilution of 1:100 overnight at 4°C in a humidified chamber. Tissues were washed extensively PBST and detection was performed using an HRP-conjugated secondary antibody followed by colorimetric detection using a DAB kit. Tissues were counterstained with hematoxylin and dehydrated with ethanol and xylene to prep for mounting.
Supportive validation
- Submitted by
- Invitrogen Antibodies (provider)
- Main image

- Experimental details
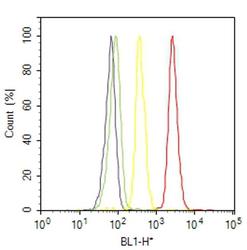
- Flow cytometry analysis of Adenosine Receptor A1 was done on A549 cells. Cells were fixed with 70% ethanol for 10 minutes, permeabilized with 0.25% Triton™ X-100 for 20 minutes, and blocked with 5% BSA for 30 minutes at room temperature. Cells were labeled with Adenosine Receptor A1 Rabbit Polyclonal Antibody (PA1041A, red histogram) or with rabbit isotype control (yellow histogram) at 3-5 ug/million cells in 2.5% BSA. After incubation at room temperature for 2 hours, the cells were labeled with Alexa Fluor® 488 Goat Anti-Rabbit Secondary Antibody (A11008) at a dilution of 1:400 for 30 minutes at room temperature. The representative 10,000 cells were acquired and analyzed for each sample using an Attune® Acoustic Focusing Cytometer. The purple histogram represents unstained control cells and the green histogram represents no-primary-antibody control.
 Explore
 Validate
 Learn
Learn Western blot