Explore
 Validate
 Learn
Learn Western blot
Antibody data
- Antibody Data
- Antigen structure
- References [3]
- Comments [0]
- Validations
- Western blot [1]
- Immunocytochemistry [3]
- Flow cytometry [1]
Submit
Validation data
Reference
Comment
Report error
- Product number
- PA3-111 - Provider product page

- Provider
- Invitrogen Antibodies
- Product name
- SSTR4 Polyclonal Antibody
- Antibody type
- Polyclonal
- Antigen
- Synthetic peptide
- Description
- PA3-111 detects the Somatostatin Receptor 4 in human and mouse samples.
- Concentration
- Conc. Not Determined
Submitted references Loss of IQSEC3 Disrupts GABAergic Synapse Maintenance and Decreases Somatostatin Expression in the Hippocampus.
Combined effects of octreotide and cisplatin on the proliferation of side population cells from anaplastic thyroid cancer cell lines.
Somatostatin receptor subtypes in human pheochromocytoma: subcellular expression pattern and functional relevance for octreotide scintigraphy.
Kim S, Kim H, Park D, Kim J, Hong J, Kim JS, Jung H, Kim D, Cheong E, Ko J, Um JW
Cell reports 2020 Feb 11;30(6):1995-2005.e5
Cell reports 2020 Feb 11;30(6):1995-2005.e5
Combined effects of octreotide and cisplatin on the proliferation of side population cells from anaplastic thyroid cancer cell lines.
Li Z, Jiang X, Chen P, Wu X, Duan A, Qin Y
Oncology letters 2018 Sep;16(3):4033-4042
Oncology letters 2018 Sep;16(3):4033-4042
Somatostatin receptor subtypes in human pheochromocytoma: subcellular expression pattern and functional relevance for octreotide scintigraphy.
Mundschenk J, Unger N, Schulz S, Höllt V, Schulz S, Steinke R, Lehnert H
The Journal of clinical endocrinology and metabolism 2003 Nov;88(11):5150-7
The Journal of clinical endocrinology and metabolism 2003 Nov;88(11):5150-7
No comments: Submit comment
Supportive validation
- Submitted by
- Invitrogen Antibodies (provider)
- Main image

- Experimental details
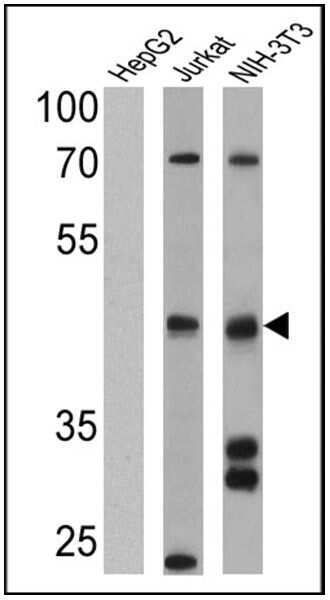
- Western blot analysis of Somatostatin Receptor 4 was performed by loading 25 µg of HepG2 (lane 1), Jurkat (lane 2) and NIH-3T3 (lane 3) cell lysates onto an SDS polyacrylamide gel. Proteins were transferred to a PVDF membrane and blocked at 4ºC overnight. The membrane was probed with a Somatostatin Receptor 4 polyclonal antibody (Product # PA3-111) at a dilution of 1:500 (HepG2) and 1:1000 (Jurkat and NIH-3T3) overnight at 4°C, washed in TBST, and probed with an HRP-conjugated secondary antibody for 1 hr at room temperature in the dark. Chemiluminescent detection was performed using Pierce ECL Plus Western Blotting Substrate (Product # 32132). Results show a band at ~42 kDa.
Supportive validation
- Submitted by
- Invitrogen Antibodies (provider)
- Main image
- Experimental details
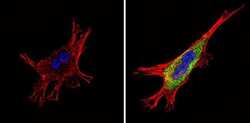
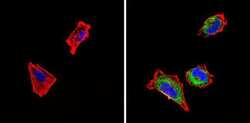
- Immunofluorescent analysis of Somatostatin Receptor 4 (green) showing staining in the cytoplasm of NIH-3T3 cells (right) compared to a negative control without primary antibody (left). Formalin-fixed cells were permeabilized with 0.1% Triton X-100 in TBS for 5-10 minutes and blocked with 3% BSA-PBS for 30 minutes at room temperature. Cells were probed with a Somatostatin Receptor 4 polyclonal antibody (Product # PA3-111) in 3% BSA-PBS at a dilution of 1:100 and incubated overnight at 4 ºC in a humidified chamber. Cells were washed with PBST and incubated with a DyLight-conjugated secondary antibody in PBS at room temperature in the dark. F-actin (red) was stained with a fluorescent red phalloidin and nuclei (blue) were stained with Hoechst or DAPI. Images were taken at a magnification of 60x.
- Submitted by
- Invitrogen Antibodies (provider)
- Main image
- Experimental details
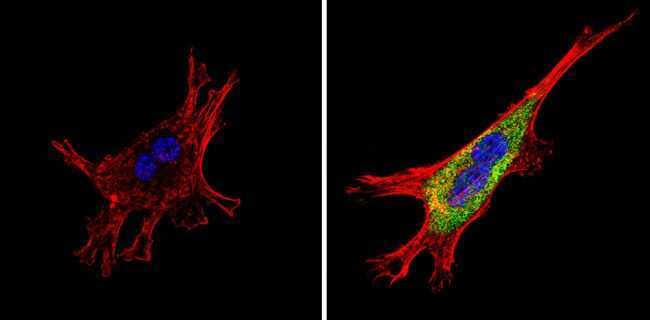
- Immunofluorescent analysis of Somatostatin Receptor 4 (green) showing staining in the cytoplasm of SH-SY5Y cells (right) compared to a negative control without primary antibody (left). Formalin-fixed cells were permeabilized with 0.1% Triton X-100 in TBS for 5-10 minutes and blocked with 3% BSA-PBS for 30 minutes at room temperature. Cells were probed with a Somatostatin Receptor 4 polyclonal antibody (Product # PA3-111) in 3% BSA-PBS at a dilution of 1:100 and incubated overnight at 4 ºC in a humidified chamber. Cells were washed with PBST and incubated with a DyLight-conjugated secondary antibody in PBS at room temperature in the dark. F-actin (red) was stained with a fluorescent red phalloidin and nuclei (blue) were stained with Hoechst or DAPI. Images were taken at a magnification of 60x.

- Submitted by
- Invitrogen Antibodies (provider)
- Main image
- Experimental details
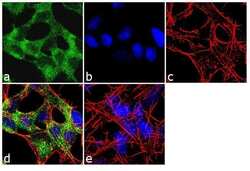
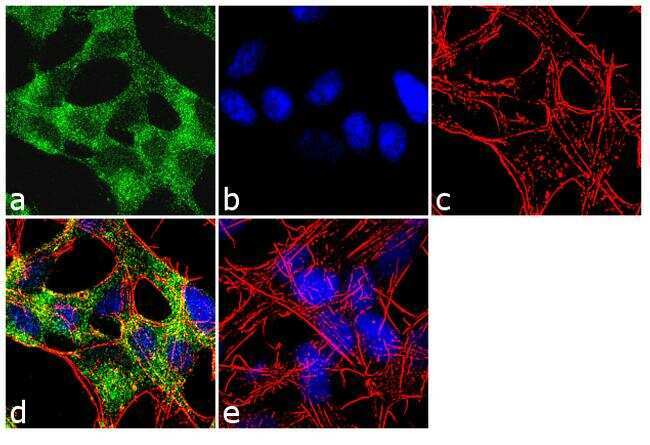
- Immunofluorescence analysis of SSTR4 was performed using 70% confluent log phase SH-SY5Y cells. The cells were fixed with 4% paraformaldehyde for 10 minutes, permeabilized with 0.1% Triton™ X-100 for 10 minutes, and blocked with 2% BSA for 1 hour at room temperature. The cells were labeled with SSTR4 Rabbit Polyclonal Antibody (Product # PA3-111) at 1:250 dilution in 0.1% BSA and incubated for 3 hours at room temperature and then labeled with Goat anti-Rabbit IgG (H+L) Superclonal™ Secondary Antibody, Alexa Fluor® 488 conjugate (Product # A27034) a dilution of 1:2000 for 45 minutes at room temperature (Panel a: green). Nuclei (Panel b: blue) were stained with SlowFade® Gold Antifade Mountant with DAPI (Product # S36938). F-actin (Panel c: red) was stained with Rhodamine Phalloidin (Product # R415, 1:300). Panel d represents the merged image showing cytoplasmic localization. Panel e shows the no primary antibody control. The images were captured at 60X magnification.
Supportive validation
- Submitted by
- Invitrogen Antibodies (provider)
- Main image
- Experimental details
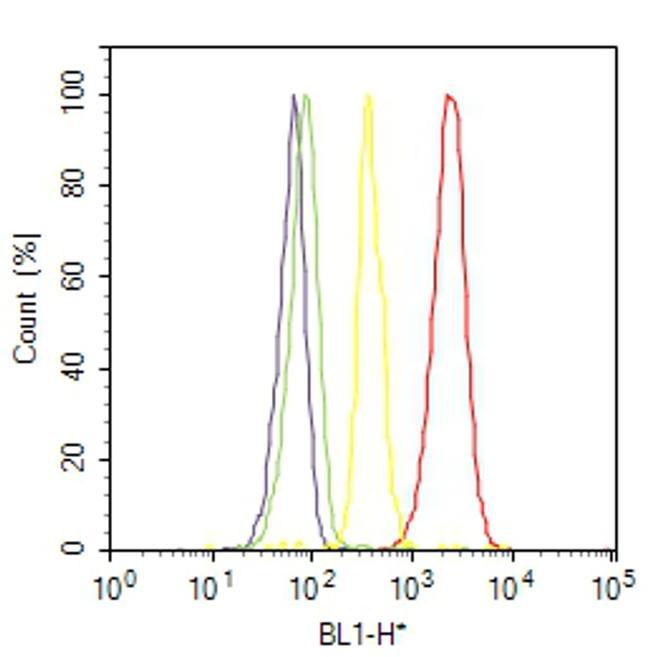
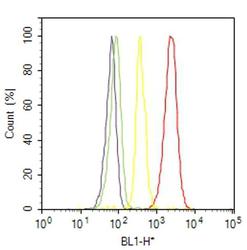
- Flow cytometry analysis of Somatostatin Receptor 4 was done on NIH/3T3 cells were fixed with 70% ethanol for 10 minutes, permeabilized with 0.25% Triton™ X-100 for 20 minutes, and blocked with 5% BSA for 30 minutes at room temperature. Cells were labeled with Somatostatin Receptor 4 Rabbit Polyclonal Antibody (PA3111, red histogram) or with rabbit isotype control (yellow histogram) at 3-5 ug/million cells in 2.5% BSA. After incubation at room temperature for 2 hours, the cells were labeled with Alexa Fluor® 488 Goat Anti-Rabbit Secondary Antibody (A11008) at a dilution of 1:400 for 30 minutes at room temperature. The representative 10,000 cells were acquired and analyzed for each sample using an Attune® Acoustic Focusing Cytometer. The purple histogram represents unstained control cells and the green histogram represents no-primary-antibody control.