 Explore
 Validate
 Learn
Learn Western blot
 ELISA
ELISAAntibody data
- Antibody Data
- Antigen structure
- References [5]
- Comments [0]
- Validations
- Western blot [3]
- Immunocytochemistry [2]
- Immunohistochemistry [3]
- Flow cytometry [1]
- Other assay [3]
Submit
Validation data
Reference
Comment
Report error
- Product number
- 33-3800 - Provider product page

- Provider
- Invitrogen Antibodies
- Product name
- HSP70 Monoclonal Antibody (MB-H1)
- Antibody type
- Monoclonal
- Antigen
- Other
- Reactivity
- Human, Mouse, Rat
- Host
- Mouse
- Isotype
- IgM
- Antibody clone number
- MB-H1
- Vial size
- 200 µg
- Concentration
- 0.5 mg/mL
- Storage
- -20°C
Submitted references Within the Ischemic Penumbra, Sub-Cellular Compartmentalization of Heat Shock Protein 70 Overlaps with Autophagy Proteins and Fails to Merge with Lysosomes.
The Autophagy-Related Organelle Autophagoproteasome Is Suppressed within Ischemic Penumbra.
Circulating microRNA‑135a‑3p in serum extracellular vesicles as a potential biological marker of non‑alcoholic fatty liver disease.
Cytokeratin and protein expression patterns in squamous cell carcinoma of the oral cavity provide evidence for two distinct pathogenetic pathways.
Tapered progesterone withdrawal promotes long-term recovery following brain trauma.
Mastroiacovo F, Biagioni F, Lenzi P, Lazzeri G, Ferrucci M, Puglisi-Allegra S, Frati A, Nicoletti F, Fornai F
Molecules (Basel, Switzerland) 2022 May 13;27(10)
Molecules (Basel, Switzerland) 2022 May 13;27(10)
The Autophagy-Related Organelle Autophagoproteasome Is Suppressed within Ischemic Penumbra.
Biagioni F, Mastroiacovo F, Lenzi P, Puglisi-Allegra S, Busceti CL, Ryskalin L, Ferese R, Bucci D, Frati A, Nicoletti F, Fornai F
International journal of molecular sciences 2021 Sep 26;22(19)
International journal of molecular sciences 2021 Sep 26;22(19)
Circulating microRNA‑135a‑3p in serum extracellular vesicles as a potential biological marker of non‑alcoholic fatty liver disease.
Jiang H, Qian Y, Shen Z, Liu Y, He Y, Gao R, Shen M, Chen S, Fu Q, Yang T
Molecular medicine reports 2021 Jul;24(1)
Molecular medicine reports 2021 Jul;24(1)
Cytokeratin and protein expression patterns in squamous cell carcinoma of the oral cavity provide evidence for two distinct pathogenetic pathways.
Frohwitter G, Buerger H, VAN Diest PJ, Korsching E, Kleinheinz J, Fillies T
Oncology letters 2016 Jul;12(1):107-113
Oncology letters 2016 Jul;12(1):107-113
Tapered progesterone withdrawal promotes long-term recovery following brain trauma.
Cutler SM, Vanlandingham JW, Stein DG
Experimental neurology 2006 Aug;200(2):378-85
Experimental neurology 2006 Aug;200(2):378-85
No comments: Submit comment
Supportive validation
- Submitted by
- Invitrogen Antibodies (provider)
- Main image

- Experimental details
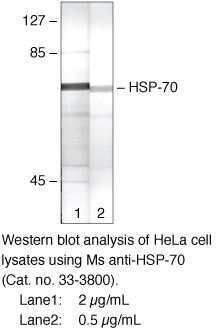
- Western blot analysis of HeLa cell lysates using Ms anti-HSP-70 (Product # 33-3800). Lane1: 2 µg/mL. Lane2: 0.5 µg/mL.
- Submitted by
- Invitrogen Antibodies (provider)
- Main image

- Experimental details
- Western blot analysis was performed on whole cell extracts (30 µg lysate) of HeLa (Lane 1), Caco-2 (Lane 2), Hep G2 (Lane 3), K562 (Lane 4), Raji (Lane 5), HL-60 (Lane 6), A-431 (Lane 7) and tissue extract of Mouse Heart (Lane 8). The blot was probed with Anti-HSP70 monoclonal Antibody (Product # 33-3800, 1:1000 dilution) and detected by chemiluminescence using Goat anti-Mouse IgG (H+L) Superclonal™ Secondary Antibody, HRP (Product # A28177, 0.25 µg/ml, 1:4000 dilution). A 70 kDa band corresponding to HSP70 was observed across all the cell lines and tissue tested.

- Submitted by
- Invitrogen Antibodies (provider)
- Main image

- Experimental details
- Western blot was performed using Anti-HSP70 Monoclonal Antibody (Product # 33-3800) and a 70kDa band corresponding to HSP70 was observed to be upregulated upon treatment with Heat Shock. Whole cell extracts (30 µg lysate) of Jurkat (Lane 1) and Jurkat treated with Heat Shock (42deg for 30 mins followed by 37deg for 3 hours) (Lane 2) were electrophoresed using Novex® NuPAGE® 4-12 % Bis-Tris gel (Product # NP0322BOX). Resolved proteins were then transferred onto a nitrocellulose membrane (Product # IB23001) by iBlot® 2 Dry Blotting System (Product # IB21001). The blot was probed with the primary antibody (1:1000 dilution) and detected by chemiluminescence with Goat anti-Mouse IgG (H+L), Superclonal™ Recombinant Secondary Antibody, HRP (Product # A28177, 1:4000 dilution) using the iBright FL 1000 (Product # A32752). Chemiluminescent detection was performed using Novex® ECL Chemiluminescent Substrate Reagent Kit (Product # WP20005)..

Supportive validation
- Submitted by
- Invitrogen Antibodies (provider)
- Main image
- Experimental details
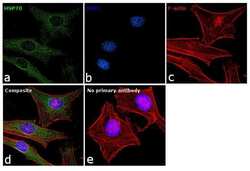
- Immunofluorescence analysis of HSP70 was performed using 70% confluent log phase HeLa cells. The cells were fixed with 4% paraformaldehyde for 10 minutes, permeabilized with 0.1% Triton™ X-100 for 15 minutes, and blocked with 1% BSA for 1 hour at room temperature. The cells were labeled with HSP70 (MB-H1) Mouse Monoclonal Antibody (Product # 33-3800) at 5 µg/mL in 0.1% BSA, incubated at 4 degree celsius overnight and then labeled with Goat anti-Mouse IgG, IgM, IgA (H+L) Secondary Antibody, Alexa Fluor 488 (Product # A-10667) at 2 microgram/mL for 45 minutes at room temperature (Panel a: green). Nuclei (Panel b: blue) were stained with SlowFade® Gold Antifade Mountant with DAPI (Product # S36938). F-actin (Panel c: red) was stained with Rhodamine Phalloidin (Product # R415, 1:300). Panel d represents the merged image showing predominant cytoplasmic localization. Panel e represents control cells with no primary antibody to assess background. The images were captured at 60X magnification.

- Submitted by
- Invitrogen Antibodies (provider)
- Main image

- Experimental details
- Immunofluorescence analysis of HSP70 was performed using 70% confluent log phase MCF7 cells. The cells were fixed with 4% paraformaldehyde for 10 minutes, permeabilized with 0.1% Triton™ X-100 for 15 minutes, and blocked with 1% BSA for 1 hour at room temperature. The cells were labeled with HSP70 (MB-H1) Mouse Monoclonal Antibody (Product # 33-3800) at 2 µg/mL in 0.1% BSA, incubated at 4 degree celsius overnight and then labeled with Goat anti-Mouse IgM (Heavy chain) Cross-Adsorbed Secondary Antibody, Alexa Fluor 568 (Product # A-21043) at 0.2 microgram/mL for 45 minutes at room temperature (Panel a: red). Nuclei (Panel b: blue) were stained with SlowFade® Gold Antifade Mountant with DAPI (Product # S36938). F-actin (Panel c: green) was stained with Alexa Fluor® 488 Phalloidin (Product # A12379, 1:300). Panel d represents the merged image showing predominant cytoplasmic localization. Panel e represents control cells with no primary antibody to assess background. The images were captured at 60X magnification.

Supportive validation
- Submitted by
- Invitrogen Antibodies (provider)
- Main image

- Experimental details
- Immunohistochemistry analysis of HSP70/Heat Shock Protein 70 showing staining in the cytoplasm of paraffin-embedded human colon carcinoma tissue (right) compared to a negative control without primary antibody (left). To expose target proteins, antigen retrieval was performed using 10mM sodium citrate (pH 6.0), microwaved for 8-15 min. Following antigen retrieval, tissues were blocked in 3% H2O2-methanol for 15 min at room temperature, washed with ddH2O and PBS, and then probed with a HSP70/Heat Shock Protein 70 monoclonal antibody (Product # 33-3800) diluted in 3% BSA-PBS at a dilution of 1:20 overnight at 4ºC in a humidified chamber. Tissues were washed extensively in PBST and detection was performed using an HRP-conjugated secondary antibody followed by colorimetric detection using a DAB kit. Tissues were counterstained with hematoxylin and dehydrated with ethanol and xylene to prep for mounting.

- Submitted by
- Invitrogen Antibodies (provider)
- Main image

- Experimental details
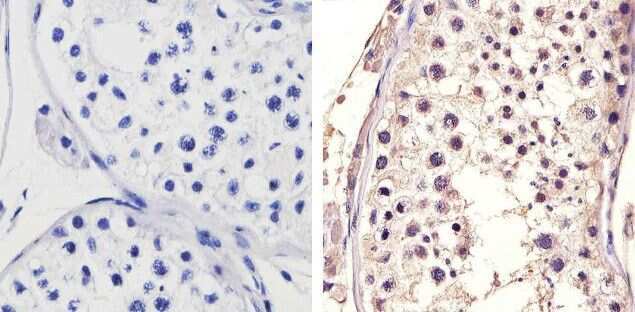
- Immunohistochemistry analysis of HSP70/Heat Shock Protein 70 showing staining in the cytoplasm of paraffin-embedded human testis tissue (right) compared to a negative control without primary antibody (left). To expose target proteins, antigen retrieval was performed using 10mM sodium citrate (pH 6.0), microwaved for 8-15 min. Following antigen retrieval, tissues were blocked in 3% H2O2-methanol for 15 min at room temperature, washed with ddH2O and PBS, and then probed with a HSP70/Heat Shock Protein 70 monoclonal antibody (Product # 33-3800) diluted in 3% BSA-PBS at a dilution of 1:100 overnight at 4ºC in a humidified chamber. Tissues were washed extensively in PBST and detection was performed using an HRP-conjugated secondary antibody followed by colorimetric detection using a DAB kit. Tissues were counterstained with hematoxylin and dehydrated with ethanol and xylene to prep for mounting.
- Submitted by
- Invitrogen Antibodies (provider)
- Main image

- Experimental details
- Immunohistochemistry analysis of HSP70/Heat Shock Protein 70 showing staining in the cytoplasm of paraffin-embedded rat testis tissue (right) compared to a negative control without primary antibody (left). To expose target proteins, antigen retrieval was performed using 10mM sodium citrate (pH 6.0), microwaved for 8-15 min. Following antigen retrieval, tissues were blocked in 3% H2O2-methanol for 15 min at room temperature, washed with ddH2O and PBS, and then probed with a HSP70/Heat Shock Protein 70 monoclonal antibody (Product # 33-3800) diluted in 3% BSA-PBS at a dilution of 1:20 overnight at 4ºC in a humidified chamber. Tissues were washed extensively in PBST and detection was performed using an HRP-conjugated secondary antibody followed by colorimetric detection using a DAB kit. Tissues were counterstained with hematoxylin and dehydrated with ethanol and xylene to prep for mounting.

Supportive validation
- Submitted by
- Invitrogen Antibodies (provider)
- Main image

- Experimental details
- Flow cytometry analysis of HSP70 was done on HeLa cells. Cells were fixed with 70% ethanol for 10 minutes, permeabilized with 0.25% Tritonª X-100 for 20 minutes, and blocked with 5% BSA for 30 minutes at room temperature. Cells were labeled with HSP70 Mouse Monoclonal Antibody (333800, red histogram) or with mouse isotype control (pink histogram) at 3-5 µg/million cells in 2.5% BSA. After incubation at room temperature for 2 hours, the cells were labeled with Alexa Fluor¨ 488 Rabbit Anti-Mouse Secondary Antibody (A11059) at a dilution of 1:400 for 30 minutes at room temperature. The representative 10,000 cells were acquired and analyzed for each sample using an Attune¨ Acoustic Focusing Cytometer. The purple histogram represents unstained control cells and the green histogram represents no-primary-antibody control.

Supportive validation
- Submitted by
- Invitrogen Antibodies (provider)
- Main image

- Experimental details
- Figure 2. Characterization of hepatocyte-released EVs. (A) Representative transmission electron microscopy images of morphology of EVs isolated from mice fed HFD or CD. (B) Size distribution of EVs was analyzed using nanoparticle tracking analysis. (C) Markers of EVs (CD9, calreticulin, HSP70, TSG101 and GAPDH) were measured in cells and EVs using western blot analysis. EVs, extracellular vesicles; HFD, high-fat diet; CD, chow diet; HSP70, heat shock protein 70; TSG101, tumor susceptibility 101.

- Submitted by
- Invitrogen Antibodies (provider)
- Main image

- Experimental details
- Figure 5 Representative HSP70 immuno-staining. This picture shows Heat Shock Protein 70 positive neurons stained with primary antibodies against inducible HSP70 within the area penumbra (Ischemia, in the representative picture) compared with the homologous area from a control mouse (Sham). Arrows point to HSP70 immuno-positive neurons. Scale bar = 100 mum; Scale bar (insert) = 50 mum.

- Submitted by
- Invitrogen Antibodies (provider)
- Main image
- Experimental details
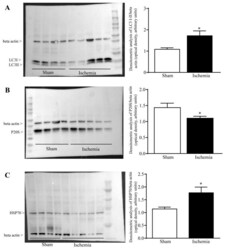
- Figure 8 Modulation of LC3, P20S and HSP70 proteins following ischemia. Representative Western Blotting for LC3 ( A ), P20S ( B ), HSP70 ( C ) and beta actin within the area penumbra (Ischemia, in the representative picture) compared with the homologous area from a control mouse (Sham). Each graph reports the semi-quantitative densitometric analysis of each antigen expressed compared with the house-keeping protein beta actin. ( A ) df = 7, t = 2.396, p = 0.0478; ( B ) df = 7, t = 2.367, p = 0.0498; ( C ) df = 7, t = 2.433, p = 0.0452, * p
