 Explore
 Validate
 Learn
LearnPA5-18467
antibody from Invitrogen Antibodies
Targeting: IFT88
D13S1056E, hTg737, MGC26259, Tg737, TTC10
 Western blot
Antibody data
- Antibody Data
- Antigen structure
- References [4]
- Comments [0]
- Validations
- Western blot [4]
- Immunocytochemistry [1]
- Flow cytometry [2]
- Other assay [2]
Submit
Validation data
Reference
Comment
Report error
- Product number
- PA5-18467 - Provider product page

- Provider
- Invitrogen Antibodies
- Product name
- IFT88 Polyclonal Antibody
- Antibody type
- Polyclonal
- Antigen
- Synthetic peptide
- Description
- This antibody is predicted to react with canine and rat based on sequence homology. This antibody is tested in Peptide ELISA: antibody detection limit dilution 128,000.
- Reactivity
- Human, Mouse
- Host
- Goat
- Isotype
- IgG
- Vial size
- 100 µg
- Concentration
- 0.5 mg/mL
- Storage
- -20° C, Avoid Freeze/Thaw Cycles
Submitted references Cilia proteins are biomarkers of altered flow in the vasculature.
Ciliogenesis-coupled accumulation of IFT-B proteins in a novel cytoplasmic compartment.
Dicam promotes proliferation and maturation of chondrocyte through Indian hedgehog signaling in primary cilia.
Ciliary membrane proteins traffic through the Golgi via a Rabep1/GGA1/Arl3-dependent mechanism.
Gupta A, Thirugnanam K, Thamilarasan M, Mohieldin AM, Zedan HT, Prabhudesai S, Griffin MR, Spearman AD, Pan A, Palecek SP, Yalcin HC, Nauli SM, Rarick KR, Zennadi R, Ramchandran R
JCI insight 2022 Mar 22;7(6)
JCI insight 2022 Mar 22;7(6)
Ciliogenesis-coupled accumulation of IFT-B proteins in a novel cytoplasmic compartment.
Lamri L, Twan WK, Katoh TA, Botilde Y, Takaoka K, Ikawa Y, Nishimura H, Fukumoto A, Minegishi K, Mizuno K, Hamada H
Genes to cells : devoted to molecular & cellular mechanisms 2019 Nov;24(11):731-745
Genes to cells : devoted to molecular & cellular mechanisms 2019 Nov;24(11):731-745
Dicam promotes proliferation and maturation of chondrocyte through Indian hedgehog signaling in primary cilia.
Han S, Park HR, Lee EJ, Jang JA, Han MS, Kim GW, Jeong JH, Choi JY, Beier F, Jung YK
Osteoarthritis and cartilage 2018 Jul;26(7):945-953
Osteoarthritis and cartilage 2018 Jul;26(7):945-953
Ciliary membrane proteins traffic through the Golgi via a Rabep1/GGA1/Arl3-dependent mechanism.
Kim H, Xu H, Yao Q, Li W, Huang Q, Outeda P, Cebotaru V, Chiaravalli M, Boletta A, Piontek K, Germino GG, Weinman EJ, Watnick T, Qian F
Nature communications 2014 Nov 18;5:5482
Nature communications 2014 Nov 18;5:5482
No comments: Submit comment
Supportive validation
- Submitted by
- Invitrogen Antibodies (provider)
- Main image

- Experimental details
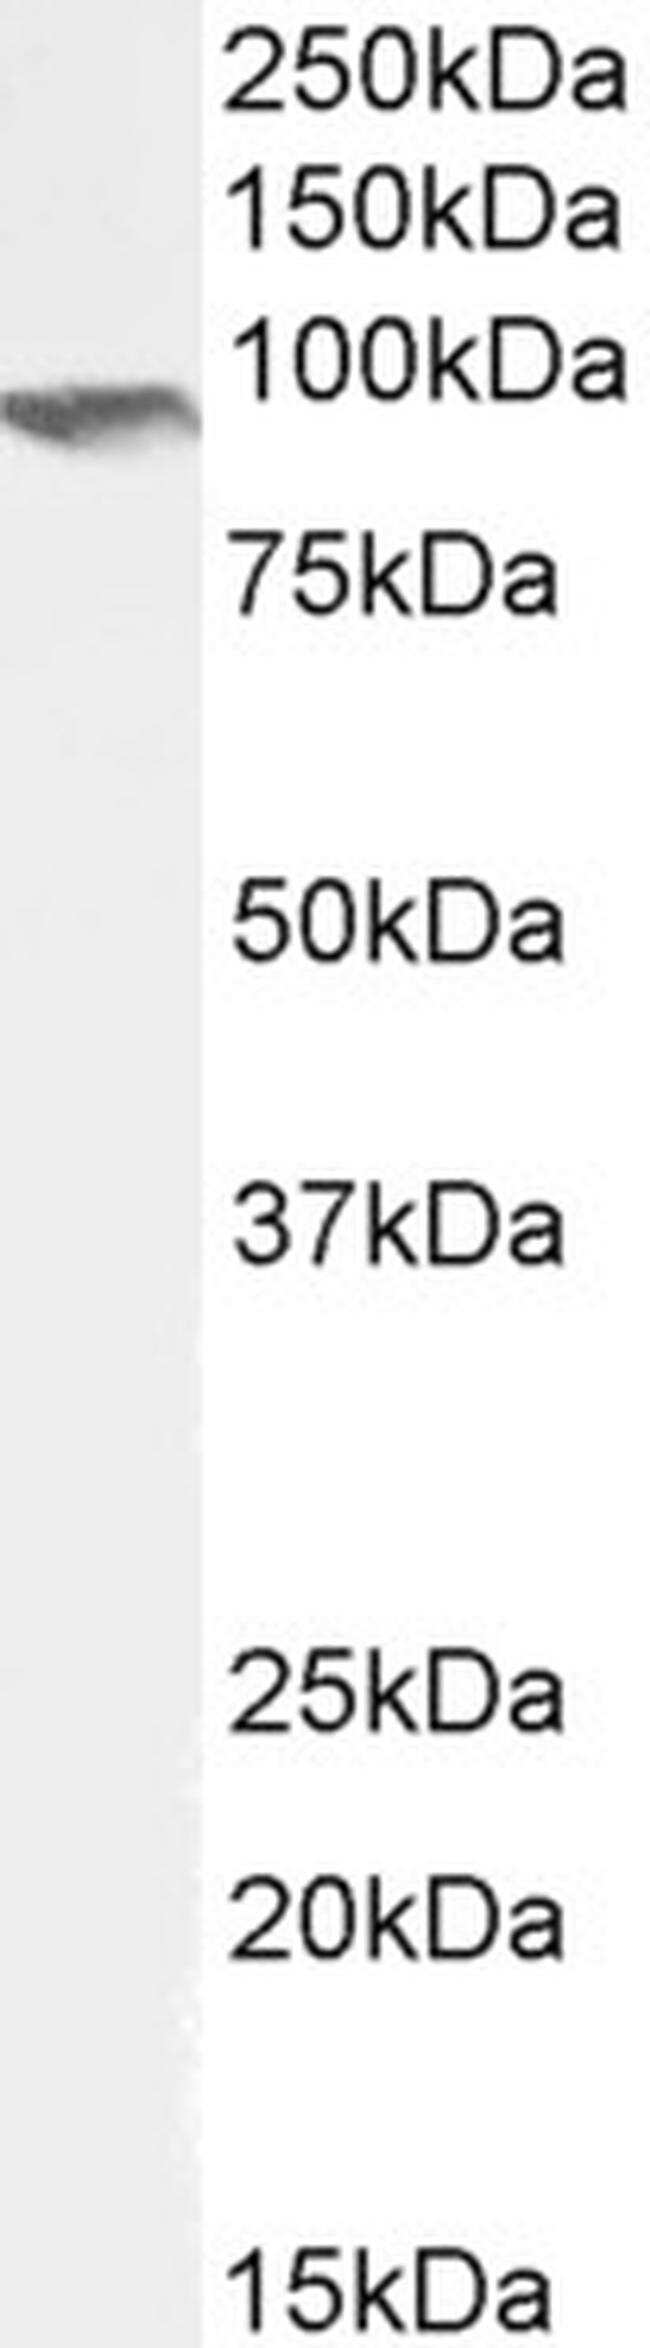
- Western blot analysis of IFT88 by a IFT88 monoclonal antibody (Product # PA5-18467) at a concentration of 0.5 µg/mL. Human Kidney lysate (35µg protein in RIPA buffer). Detected by chemiluminescence.
- Submitted by
- Invitrogen Antibodies (provider)
- Main image
- Experimental details
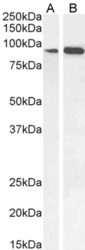
- Western blot analysis of IFT88 by a IFT88 monoclonal antibody (Product # PA5-18467) at a concentration of 0.5 µg/mL. HepG2 (A) and NIH3T3 (B) cell lysate (35µg protein in RIPA buffer). Detected by chemiluminescence.

- Submitted by
- Invitrogen Antibodies (provider)
- Main image

- Experimental details
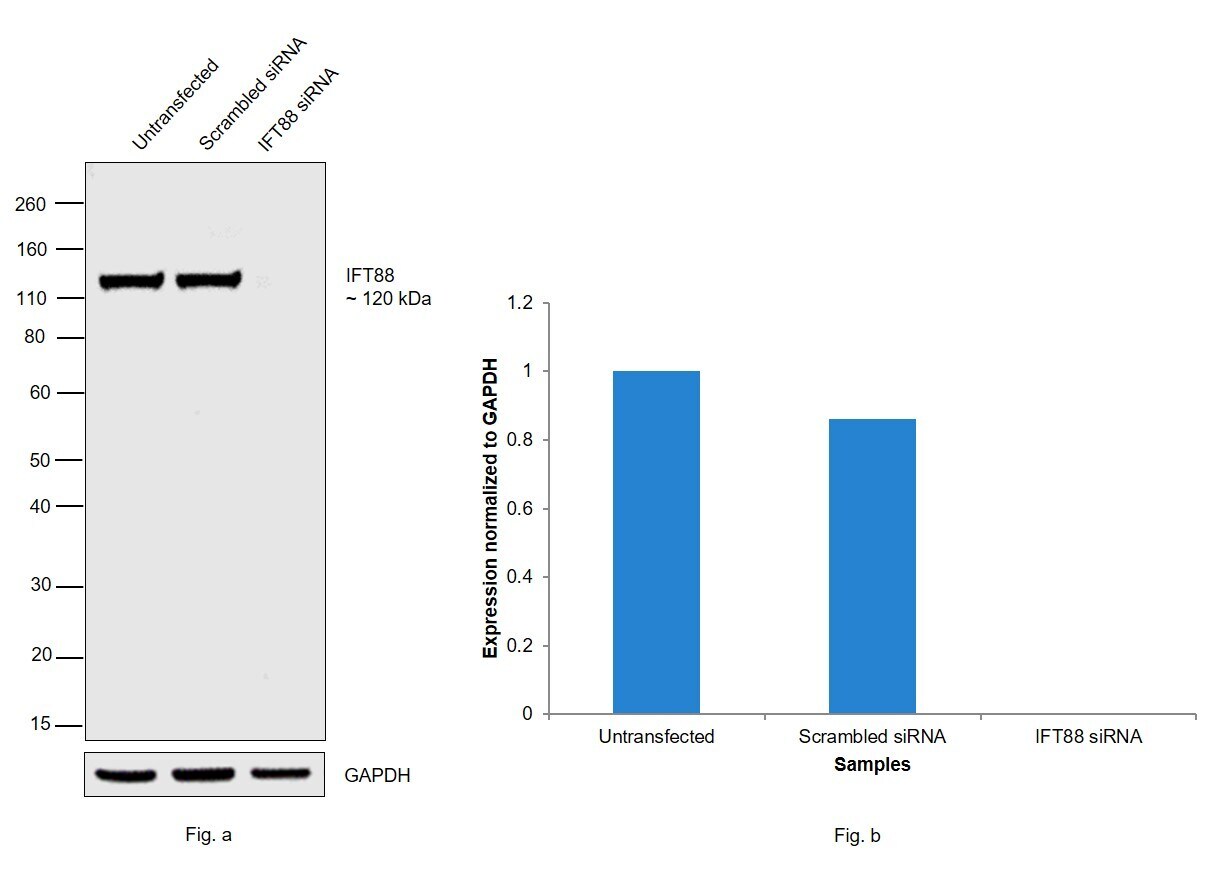
- Knockdown of IFT88 was achieved by transfecting Hep G2 cells with IFT88 specific siRNAs (Silencer® select Product # s15624, s15623). Western blot analysis (Fig. a) was performed using whole cell extracts from the IFT88 knockdown cells (Lane 3), non-specific scrambled siRNA transfected cells (Lane 2) and untransfected cells (Lane 1). The blots were probed with Anti-IFT88 Polyclonal Antibody (Product # PA5-18467, 1µg/ml) and Goat anti-Rabbit IgG (H+L) Superclonal™ Secondary Antibody, HRP conjugate (Product # A27036, 0.25 µg/ml, 1:4000 dilution). Densitometric analysis of this western blot is shown in histogram (Fig. b). Loss in signal upon siRNA mediated knock down confirms that antibody is specific to IFT88.
- Submitted by
- Invitrogen Antibodies (provider)
- Main image
- Experimental details
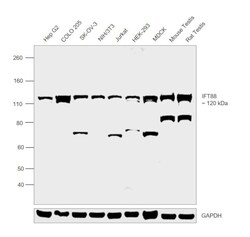
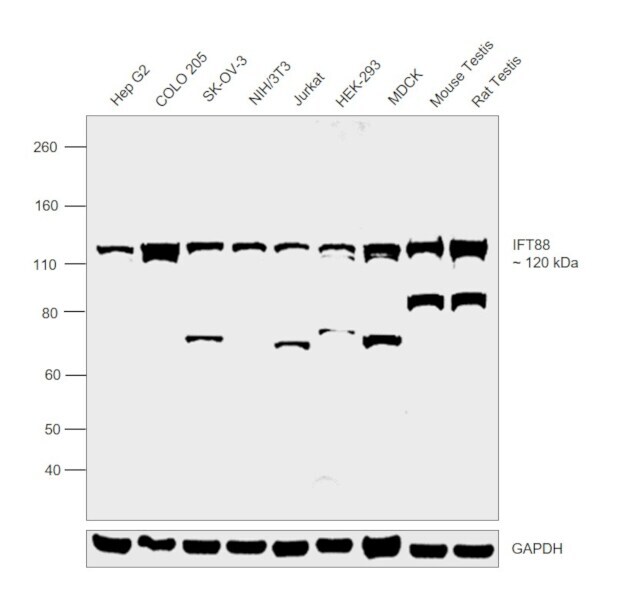
- Western blot was performed using Anti-IFT88 Polyclonal Antibody (Product # PA5-18467) and band at 120 kDa corresponding to IFT88 was observed across the cell lines and tissues tested. Whole cell extracts (30ug lysate) of Hep G2 (Lane 1), COLO 205 (Lane 2), SK-OV-3 (Lane 3), NIH/3T3 (Lane 4), Jurkat (Lane 5), HEK-293 (Lane 6), MDCK (Lane 7), tissue extracts (30 µg lysate) of Mouse Testis (Lane 8) and Rat Testis (Lane 9) were electrophoresed using Novex® NuPAGE® 4-12 % Bis-Tris gel (Product # NP0322BOX). Resolved proteins were then transferred onto a nitrocellulose membrane (Product # IB23001) by iBlot® 2 Dry Blotting System (Product # IB21001). The blot was probed with the primary antibody (1 µg/ml) and detected by Rabbit anti-Goat IgG (H+L) Superclonal™ Secondary Antibody, HRP conjugate (Product # A27014, 1:4000 dilution) using the iBright FL 1000 (Product # A32752). Chemiluminescent detection was performed using Novex® ECL Chemiluminescent Substrate Reagent Kit (Product # WP20005). Uncharacterized bands at ~70 and ~90 kDa were observed in some of the samples tested.
Supportive validation
- Submitted by
- Invitrogen Antibodies (provider)
- Main image
- Experimental details
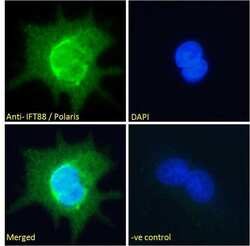
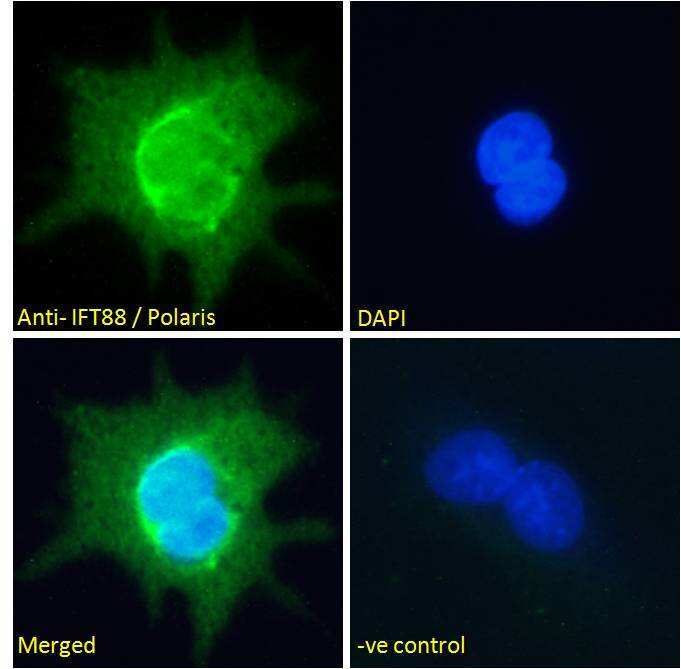
- Immunofluorescence analysis of IFT88 in HepG2 cells using a IFT88 monoclonal antibody (Product # PA5-18467) at 10 µg/mL for1hr. The cells were paraformaldehyde fixed and permeabilized with 0.15% Triton. Primary incubation was followed by Alexa Fluor 488 secondary antibody (2 µg/mL) showing nuclear and Golgi/cytoplasmic staining. The nuclear stain is DAPI (blue). Negative control: Unimmunized goat IgG (10 µg/mL)followed by Alexa Fluor 488 secondary antibody (2 µg/mL).
Supportive validation
- Submitted by
- Invitrogen Antibodies (provider)
- Main image
- Experimental details
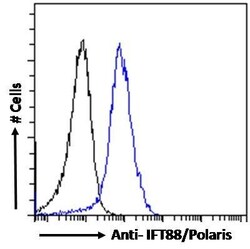
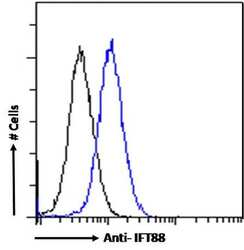
- Flow cytometric analysis of IFT88 in HepG2 cells using a polyclonal antibody (Product #PA5-18467). HepG2 cells (blue line) were paraformaldehyde fixed and permeabilized with 0.5% Triton. The primary antibody was incubated for one hour (10 µg/mL) followed by an Alexa Fluor 488 secondary antibody (1 µg/mL). IgG control: Unimmunized goat IgG (black line) followed by an Alexa Fluor 488 secondary antibody.

- Submitted by
- Invitrogen Antibodies (provider)
- Main image
- Experimental details
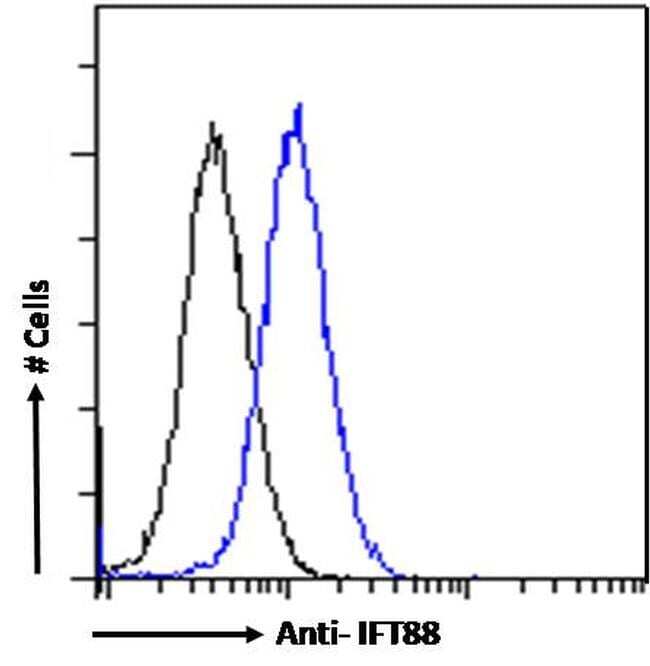
- Flow cytometric analysis of IFT88 in HepG2 cells using a IFT88 monoclonal antibody (Product # PA5-18467) at 10 µg/mL for 1hr, depicted by the blue line. The cells were paraformaldehyde fixed and permeabilized with 0.5% Triton. Primary incubation followed by Alexa Fluor 488 secondary antibody (1 µg/mL). IgG control: Unimmunized goat IgG (black line) followed by Alexa Fluor 488 secondary antibody.
Supportive validation
- Submitted by
- Invitrogen Antibodies (provider)
- Main image
- Experimental details
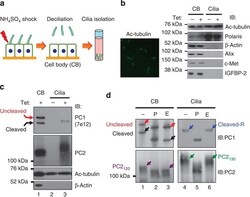
- Figure 4 Polycystin complex traffics to cilia through the Golgi apparatus. ( a ) Schematic diagram of cilium isolation from MDCK monolayers. ( b ) Visualization of intact cilia in the cilium preparation by immunofluorescence with anti-Ac-tubulin (left). Right panel shows the validation of the cilium preparations by western blot analysis for marker proteins as indicated at right. The cilium preparation (Cilia) and the cell body (CB) without ('-') or with ('+') tetracycline induction were analysed. ( c ) Western blot analysis of cilia isolated from non-induced ('-') and induced ('+') MDCK PC1WT cells with anti-PC1 or anti-PC2. ( d ) N -glycosylation analysis of ciliary PC1 and PC2 for the same sample as in ( c ). Parallel analysis of cell body (CB) served to identify cleavage status of ciliary polycystins. Note that only cleaved and EndoH-resistant PC1 and EndoH-resistant PC2 130 forms are present in cilia.

- Submitted by
- Invitrogen Antibodies (provider)
- Main image
- Experimental details
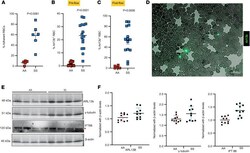
- Sickle RBCs adhere to brain ECs triggering deciliation, and cilia are found on sickle RBCs and plasma from SCD. HBMVECs exposed to sickle (SS) or healthy (AA) RBCs were subjected to shear stress (1 dyne/cm 2 ), and fraction of SS ( n = 6) and AA ( n = 5) RBCs adhered to ECs after stress induction was calculated, P = 0.0081 ( A ). SS and AA RBCs were tested for ARL13b cilia prior to flow and proportion of ARL13b cilia adhered to circulating SS RBCs ( n = 16) versus AA RBCs ( n = 12) were quantified, P < 0.0001 ( B ). After flow, ARL13b expression on SS RBCs ( n = 11), but not AA RBCs ( n = 6), upon interaction with ECs, P = 0.0006 ( C ). ( A - C ) Mann-Whitney-Wilcoxon test P values are provided. Representative field (magnification 63x; scale bar = 20 mum) of a smear of SS RBCs shows cilia presence on these sickle cells, detected with FITC-conjugated anti-Arl13b antibody ( D ). Western blot plot shows the detection of cilia-specific proteins in plasma samples of healthy controls (AA) versus sickle (SS). Red asterisk represents the top IFT88 band that was used for quantification ( E ). Please note that Western blots from only 4 AA and SS samples are shown in E . A separate gel for the other 6 samples was run and quantified. Quantification includes all 10 samples from each group. Cilia-specific proteins were quantified from plasma samples of healthy controls (AA) ( n = 10) versus sickle (SS) ( n = 10) and normalized against housekeeping protein bACTIN ( F ). * P < 0.05, *** P
