Explore
 Validate
 Learn
Learn Western blot
Antibody data
- Antibody Data
- Antigen structure
- References [7]
- Comments [0]
- Validations
- Western blot [2]
- Flow cytometry [1]
- Other assay [7]
Submit
Validation data
Reference
Comment
Report error
- Product number
- PA5-24237 - Provider product page

- Provider
- Invitrogen Antibodies
- Product name
- TMEM66 Polyclonal Antibody
- Antibody type
- Polyclonal
- Antigen
- Synthetic peptide
- Reactivity
- Human, Mouse
- Host
- Rabbit
- Vial size
- 400 µL
- Concentration
- 2 mg/mL
- Storage
- -20° C, Avoid Freeze/Thaw Cycles
Submitted references SARAF and Orai1 Contribute to Endothelial Cell Activation and Angiogenesis.
SARAF and EFHB Modulate Store-Operated Ca(2+) Entry and Are Required for Cell Proliferation, Migration and Viability in Breast Cancer Cells.
Saraf-dependent activation of mTORC1 regulates cardiac growth.
STIM1 phosphorylation at Y(316) modulates its interaction with SARAF and the activation of SOCE and I(CRAC).
Role of STIM1 in the surface expression of SARAF.
Dynamic interaction of SARAF with STIM1 and Orai1 to modulate store-operated calcium entry.
Translocation between PI(4,5)P2-poor and PI(4,5)P2-rich microdomains during store depletion determines STIM1 conformation and Orai1 gating.
Galeano-Otero I, Del Toro R, Khatib AM, Rosado JA, Ordóñez-Fernández A, Smani T
Frontiers in cell and developmental biology 2021;9:639952
Frontiers in cell and developmental biology 2021;9:639952
SARAF and EFHB Modulate Store-Operated Ca(2+) Entry and Are Required for Cell Proliferation, Migration and Viability in Breast Cancer Cells.
Jardin I, Nieto-Felipe J, Alvarado S, Diez-Bello R, Lopez JJ, Salido GM, Smani T, Rosado JA
Cancers 2021 Aug 19;13(16)
Cancers 2021 Aug 19;13(16)
Saraf-dependent activation of mTORC1 regulates cardiac growth.
Sanlialp A, Schumacher D, Kiper L, Varma E, Riechert E, Ho TC, Hofmann C, Kmietczyk V, Zimmermann F, Dlugosz S, Wirth A, Gorska AA, Burghaus J, Camacho Londoño JE, Katus HA, Doroudgar S, Freichel M, Völkers M
Journal of molecular and cellular cardiology 2020 Apr;141:30-42
Journal of molecular and cellular cardiology 2020 Apr;141:30-42
STIM1 phosphorylation at Y(316) modulates its interaction with SARAF and the activation of SOCE and I(CRAC).
Lopez E, Frischauf I, Jardin I, Derler I, Muik M, Cantonero C, Salido GM, Smani T, Rosado JA, Redondo PC
Journal of cell science 2019 May 15;132(10)
Journal of cell science 2019 May 15;132(10)
Role of STIM1 in the surface expression of SARAF.
Albarran L, Regodón S, Salido GM, Lopez JJ, Rosado JA
Channels (Austin, Tex.) 2017 Jan 2;11(1):84-88
Channels (Austin, Tex.) 2017 Jan 2;11(1):84-88
Dynamic interaction of SARAF with STIM1 and Orai1 to modulate store-operated calcium entry.
Albarran L, Lopez JJ, Amor NB, Martin-Cano FE, Berna-Erro A, Smani T, Salido GM, Rosado JA
Scientific reports 2016 Apr 12;6:24452
Scientific reports 2016 Apr 12;6:24452
Translocation between PI(4,5)P2-poor and PI(4,5)P2-rich microdomains during store depletion determines STIM1 conformation and Orai1 gating.
Maléth J, Choi S, Muallem S, Ahuja M
Nature communications 2014 Dec 17;5:5843
Nature communications 2014 Dec 17;5:5843
No comments: Submit comment
Supportive validation
- Submitted by
- Invitrogen Antibodies (provider)
- Main image

- Experimental details
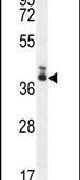
- Western blot analysis using a TMEM66 polyclonal antibody (Product # PA5-24237) in 293 cell lysates (35 µg per lane).
- Submitted by
- Invitrogen Antibodies (provider)
- Main image

- Experimental details
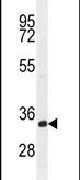
- Western blot analysis using a TMEM66 polyclonal antibody (Product # PA5-24237) in mouse cerebellum tissue lysates (35 µg per lane).
Supportive validation
- Submitted by
- Invitrogen Antibodies (provider)
- Main image
- Experimental details
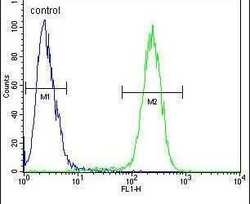
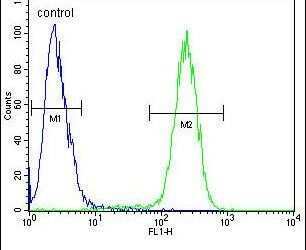
- Flow cytometry analysis of 293 cells using a TMEM66 polyclonal antibody (Product # PA5-24237) (right) compared to a negative control cell (left) at a dilution of 1:10-50, followed by a FITC-conjugated goat anti-rabbit antibody
Supportive validation
- Submitted by
- Invitrogen Antibodies (provider)
- Main image
- Experimental details
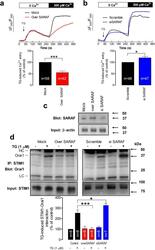
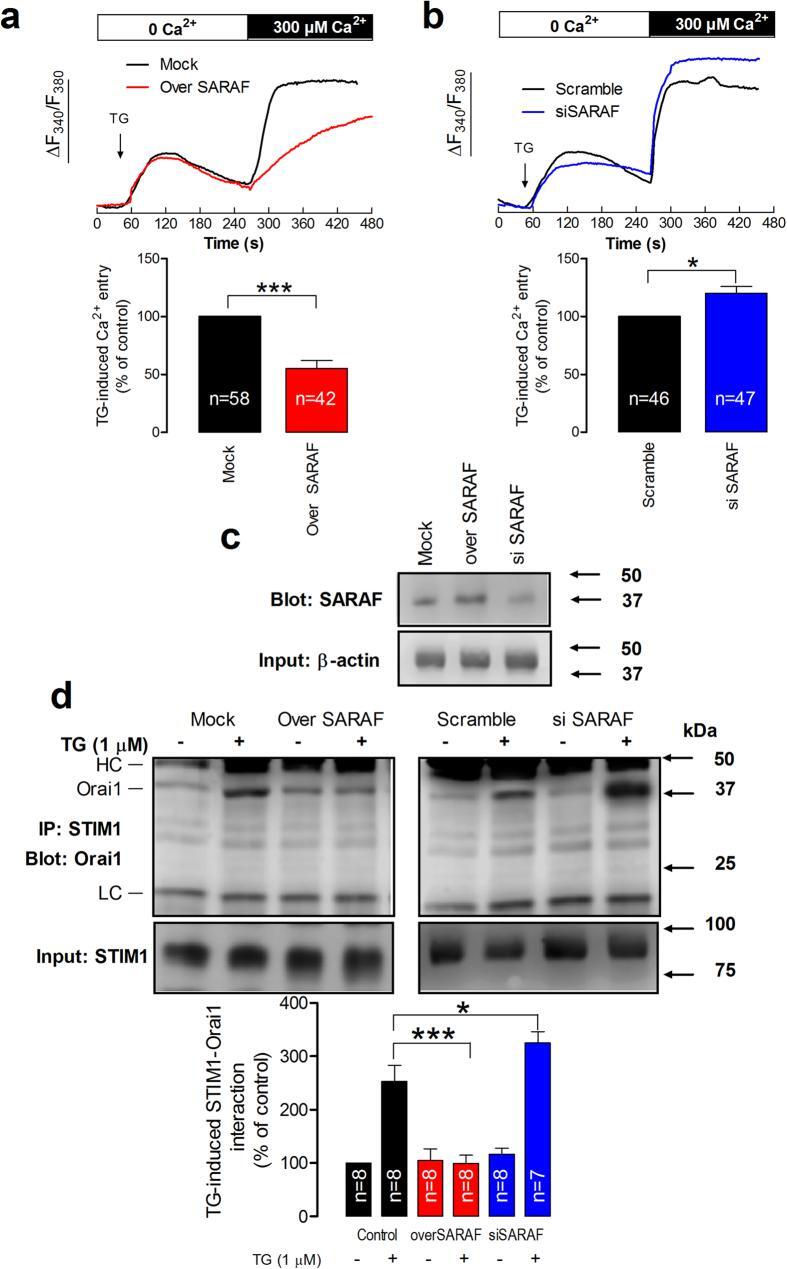
- Figure 1 SARAF regulates TG-induced SOCE and STIM1-Orai1 interaction. ( a,b ) MEG-01 cells overexpressing SARAF and mock-treated cells ( a ) or MEG-01 cells transfected with si SARAF or scramble plasmid ( b ) were perfused with a Ca 2+ -free medium (100 muM EGTA added) and then stimulated with TG (1 muM) followed by reintroduction of external Ca 2+ (final concentration 300 muM) to initiate Ca 2+ entry. Data are original traces representative of 42-58 experiments. Values are expressed as described in methods. The bar graph represents TG-induced Ca 2+ entry as mean +- SEM and data are presented as percentage of control. ( c ) Cells overexpressing SARAF, treated with siSARAF and mock-treated cells were lysed and subjected to Western blotting with anti-SARAF antibody, followed by reprobing with anti-actin antibody for protein loading control. ( d ) MEG-01 cells overexpressing SARAF or transfected with si SARAF and their respective controls were stimulated with TG (1 muM) in a Ca 2+ -free medium (100 muM EGTA added) and three min later lysed. Whole cell lysates were immunoprecipitated (IP) with anti-STIM1 antibody and immunoprecipitates were subjected to 10% SDS-PAGE and subsequent Western blotting with a specific anti-Orai1 (aa 288-301 (Sigma)) antibody. Membranes were reprobed with the antibody used for immunoprecipitation for protein loading control. The panels show results from one experiment representative of 6-7 others. Molecular masses indicated on the right were determined
- Submitted by
- Invitrogen Antibodies (provider)
- Main image
- Experimental details
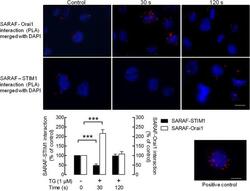
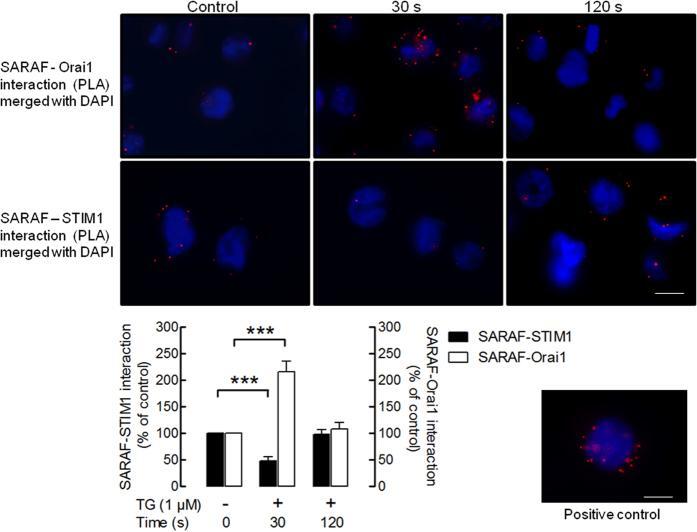
- Figure 3 Dynamic interaction of SARAF with Orai1 and STIM1. MEG-01 cells were suspended in HBS containing 300 muM CaCl 2 and were left untreated or stimulated with TG (1 muM) for 30 or 120 s. The cells were then fixed with 4% ice-cold paraformaldehyde and blocked using blocking solution from the Duolink In Situ Red kit (r) from Sigma. Samples were incubated with primary antibodies: rabbit anti-SARAF and mouse anti-STIM1 or mouse anti-Orai1 (SAB4200273, Sigma) antibodies. A Duolink assay was subsequently performed according to the manufacturer's instructions as described in Material and Methods. After performing the PLA procedure, images were taken with an Eclipse TE300 fluorescence microscope. Red spots represent individual dimers. The positive control is shown in the lower right corner. The bars indicate 10 mum. The bar graphs indicate association between SARAF and STIM1 or Orai1 expressed as the mean +- S.E.M. of 100-200 cells. The quantification of PLA signals was performed using ImageJ software. ***p < 0.001.
- Submitted by
- Invitrogen Antibodies (provider)
- Main image

- Experimental details
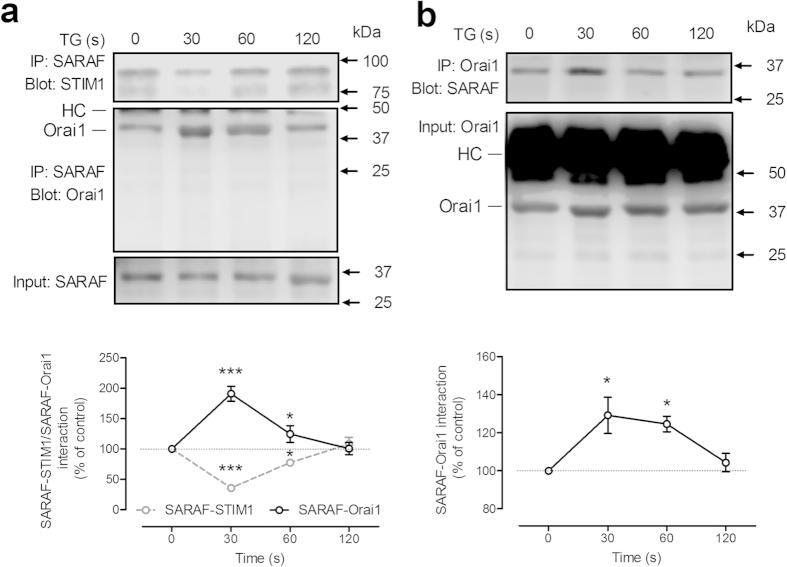
- Figure 4 Time-course of TG-induced SARAF-STIM1 and SARAF-Orai1 co-immunoprecipitation. MEG-01 cells ( a ) and NG115-401L cells ( b ) were stimulated with TG (1 muM) in the presence of 300 muM extracellular Ca 2+ . Samples were removed 30s before the addition of TG and 30, 60 and 120 s after the treatment with TG. Whole cell lysates were immunoprecipitated (IP) with the indicated antibody and immunoprecipitates were subjected to 10% SDS-PAGE and subsequent Western blotting with specific anti-Orai1 (aa 288-301 (Sigma)), anti-SARAF and anti-STIM1 antibodies. Membranes were reprobed with the antibody used for immunoprecipitation for protein loading control. The panels show results from one experiment representative of 5 others. Molecular masses indicated on the right were determined using molecular-mass markers run in the same gel. HC, heavy chain of the antibody used for immunoprecipitation. Data represent the quantification of SARAF-Orai1 and SARAF-STIM1 association in resting and TG-treated cells. Results are recorded as arbitrary optical density units, expressed as mean +- S.E.M. and presented as percentage of control (resting cells). * and *** represent p < 0.05 and p < 0.001, as compared to controls.
- Submitted by
- Invitrogen Antibodies (provider)
- Main image

- Experimental details
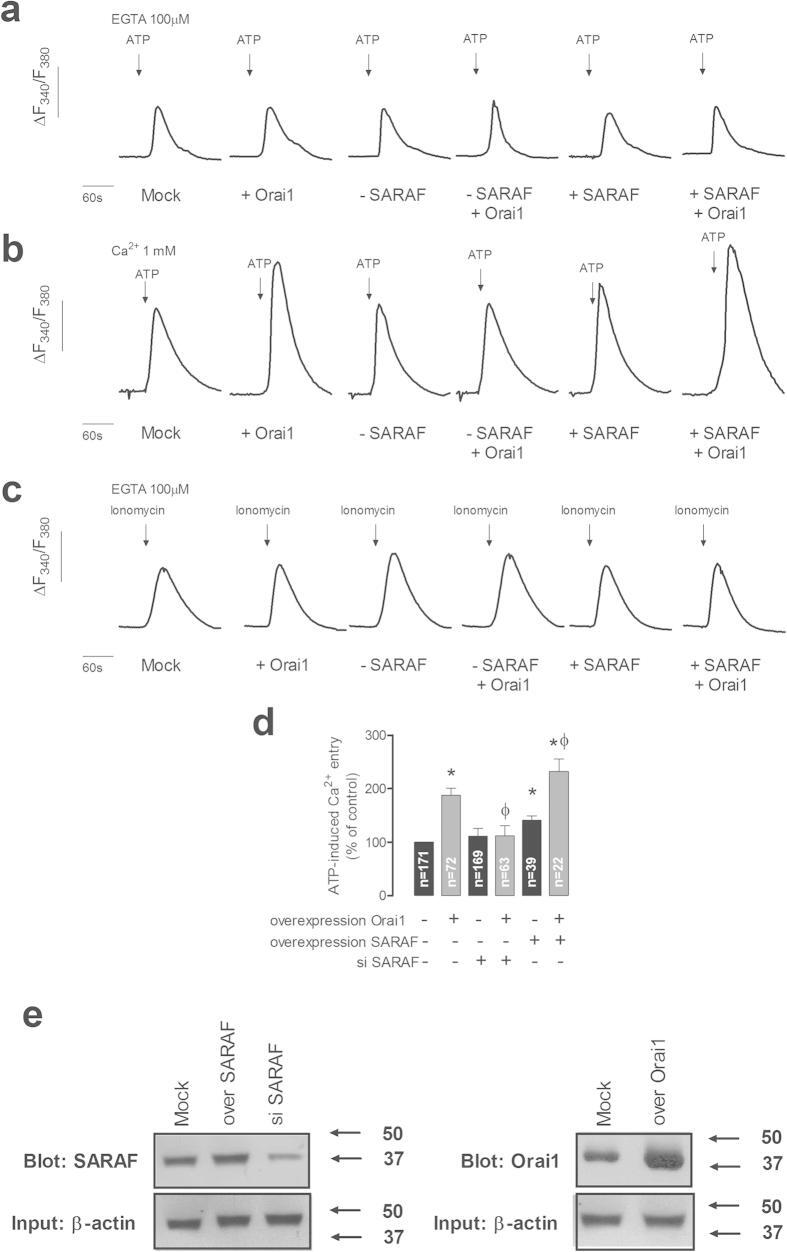
- Figure 5 SARAF regulates Orai1 channel function. ( a-c ) NG115-401L cells were transfected with Orai1, SARAF, siSARAF or empty vector as control (Mock). Cells were perfused with a Ca 2+ -free medium (100 muM EGTA added) ( a,c ) or a medium containing 1 mM Ca 2+ ( b ) and then stimulated with ATP (100 muM; ( a,b) ) or ionomycin (2 muM, ( c) ). Data are original traces representative of 22-171 experiments. ( d ) The bar graph represents ATP-evoked Ca 2+ entry estimated as the integral of the rise in [Ca 2+ ] c above basal for 11/2 min after the addition of ATP in the presence of external Ca 2+ , corrected by subtraction of the integral over the same period for stimulation with ATP in the absence of external Ca 2+ . Data are expressed as mean +- SEM and presented as percentage of control (mock-treated cells). * and ph represent p < 0.05 as compared to ATP-induced Ca 2+ entry in mock-treated controls or cells overexpressing Orai1, respectively. ( e ) Immunoblot analysis of SARAF and Orai1 expressed in NG115-401L cells before or after treatment with siSARAF or expression plasmids for SARAF and Orai1 using anti-SARAF antibody and anti-Orai1 antibody (aa 288-301 (Sigma)). Membranes were reprobed with anti-beta-actin antibody for protein loading control. The panel shows results from one experiment representative of 3 others. Molecular masses indicated on the right were determined using molecular-mass markers run in the same gel.
- Submitted by
- Invitrogen Antibodies (provider)
- Main image
- Experimental details
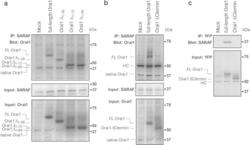
- Figure 6 Analysis of the Orai1 site that interacts with SARAF. NG115-401L cells were transfected with SARAF alone or in combination with either pEYFP-full-length Orai1 ( FL-Orai1 ), the N-terminal deletion mutants (pEYFP-Orai1 DeltaN 1-38 ( Orai1 Delta N 1-38 ), DeltaN 1-72 ( Orai1 Delta N 1-72 ) and DeltaN 1-89 ( Orai1 Delta N 1-89 ) ( a ), pEYFP-Orai1 C-terminal deletion mutant ( Orai1 -Delta Ctermin , amino acids 1-260 ( b , c ) or empty vector (Mock), as indicated. After 48 h cells were lysed and the whole cell lysates were immunoprecipitated (IP) with anti-SARAF antibody ( a , b ) or anti-YFP antibody ( c ). Immunoprecipitates were subjected to 10% SDS-PAGE and subsequent Western blotting with a specific anti-Orai1 (amino acids 288-301, Sigma) antibody ( a ), anti-Orai1 (ab177021, Abcam) antibody ( b ) or anti-SARAF antibody ( c ). Membranes were reprobed with the antibody used for immunoprecipitation for protein loading control (middle panels). ( a , b ) Alternatively, the cell lysates were subjected to 10% SDS-PAGE and subsequent Western blotting with anti-Orai1 antibody (specific for amino acids 288-301; panel a, bottom) or with anti-Orai1 (ab177021, Abcam; panel b, bottom). HC, heavy chain of the antibody used for immunoprecipitation. The panels show results from one experiment representative of 3 others. Molecular masses indicated on the right were determined using molecular-mass markers run in the same gel.

- Submitted by
- Invitrogen Antibodies (provider)
- Main image
- Experimental details
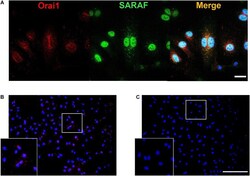
- FIGURE 6 SARAF and Orai1 colocalization in HUVECs. (A) Representative images with immunofluorescence (x40 objective with x2 zoom; scale bar = 25 mum) using specific antibodies show localization of SARAF (green) and Orai1 (red) in HUVECs stained with anti-rabbit SARAF and anti-mouse Orai1. Blue channel corresponds to DAPI. Merge image shows possible colocalization of SARAF with Orai1 as indicated by yellow color. (B,C) Representative images of fluorescence (20x; scale bar = 100 mum) in HUVECs using primary antibodies against Orai1 and SARAF ( B: both; C: only Orai1) conjugated with the appropriate proximity ligation assay (PLA) probes. The bottom box is a zoom of ( B and C ) original images (20x). Red puncta indicate that proteins are in close proximity (

- Submitted by
- Invitrogen Antibodies (provider)
- Main image
- Experimental details
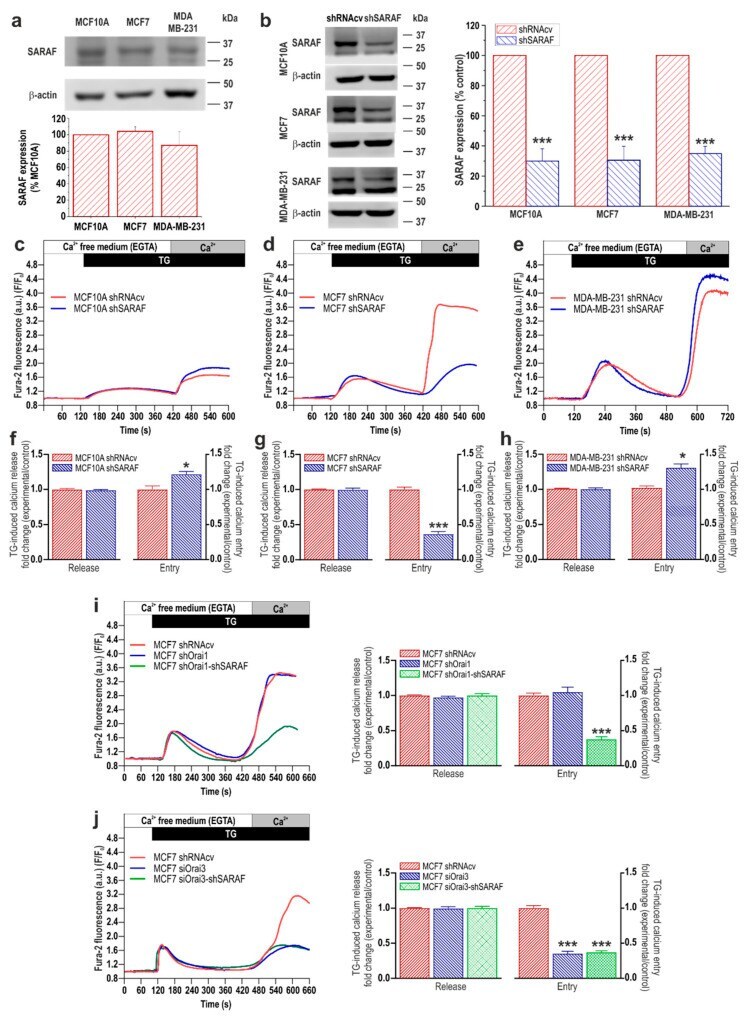
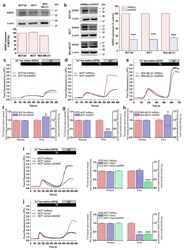
- Figure 2 SARAF expression and functional role in SOCE in breast cancer and pre-neoplastic cells. ( a ) MCF10A, MCF7, and MDA-MB-231 cells were lysed and analyzed using Western blotting with a specific anti-SARAF antibody. The membrane was reprobed with an anti-beta-actin antibody for protein loading control. Bar graphs represent SARAF expression normalized to the beta-actin content and expressed as percentage of the expression in MCF10A cells. Molecular masses indicated on the right were determined using molecular-mass markers run in the same gel. ( b ) MCF10A, MCF7, and MDA-MB-231 cells were transfected with shSARAF or scramble plasmids (shRNAcv), as indicated. After 48 h cells were lysed and analyzed using Western blotting with an anti-SARAF antibody, followed by reprobing with an anti-beta-actin antibody for protein loading control. Bar graphs represent SARAF expression normalized to the beta-actin content at the different experimental conditions and expressed as percentage of the expression in shRNAcv-treated cells (control). *** p < 0.001 compared to SARAF expression in shRNAcv-treated cells. Uncropped Western blot figures in Figure S2 . ( c - h ) MCF10A, MCF7. and MDA-MB-231 cells were transfected with shSARAF or scramble plasmids (shRNAcv), as indicated. Forty-eight hours after transfection, cells were loaded with fura-2 and perfused with a Ca 2+ -free medium (100 uM of EGTA was added). Cells were then stimulated with TG (2 uM) followed by reintroduction of external Ca