Explore
 Validate
 Learn
Learn Western blot
Antibody data
- Antibody Data
- Antigen structure
- References [4]
- Comments [0]
- Validations
- Western blot [6]
- Immunocytochemistry [2]
- Immunohistochemistry [1]
- Other assay [1]
Submit
Validation data
Reference
Comment
Report error
- Product number
- PA5-22976 - Provider product page

- Provider
- Invitrogen Antibodies
- Product name
- LDLR Polyclonal Antibody
- Antibody type
- Polyclonal
- Antigen
- Synthetic peptide
- Reactivity
- Human, Mouse
- Host
- Rabbit
- Isotype
- IgG
- Vial size
- 100 µL
- Concentration
- 1 mg/mL
- Storage
- Store at 4°C short term. For long term storage, store at -20°C, avoiding freeze/thaw cycles.
Submitted references Givinostat-Liposomes: Anti-Tumor Effect on 2D and 3D Glioblastoma Models and Pharmacokinetics.
The effect of statin treatment on intratumoral cholesterol levels and LDL receptor expression: a window-of-opportunity breast cancer trial.
Development of an LDL Receptor-Targeted Peptide Susceptible to Facilitate the Brain Access of Diagnostic or Therapeutic Agents.
Dysregulated Lipid Transport Proteins Correlate With Pathogenesis and Outcome in Severe Alcoholic Hepatitis.
Taiarol L, Bigogno C, Sesana S, Kravicz M, Viale F, Pozzi E, Monza L, Carozzi VA, Meregalli C, Valtorta S, Moresco RM, Koch M, Barbugian F, Russo L, Dondio G, Steinkühler C, Re F
Cancers 2022 Jun 16;14(12)
Cancers 2022 Jun 16;14(12)
The effect of statin treatment on intratumoral cholesterol levels and LDL receptor expression: a window-of-opportunity breast cancer trial.
Feldt M, Menard J, Rosendahl AH, Lettiero B, Bendahl PO, Belting M, Borgquist S
Cancer & metabolism 2020 Nov 23;8(1):25
Cancer & metabolism 2020 Nov 23;8(1):25
Development of an LDL Receptor-Targeted Peptide Susceptible to Facilitate the Brain Access of Diagnostic or Therapeutic Agents.
André S, Larbanoix L, Verteneuil S, Stanicki D, Nonclercq D, Vander Elst L, Laurent S, Muller RN, Burtea C
Biology 2020 Jul 11;9(7)
Biology 2020 Jul 11;9(7)
Dysregulated Lipid Transport Proteins Correlate With Pathogenesis and Outcome in Severe Alcoholic Hepatitis.
Maras JS, Das S, Bhat A, Kumar Vyas A, Yadav G, Chaudhary S, Sukriti S, Gupta AC, Bihari C, Mahiwall R, Sarin SK
Hepatology communications 2019 Dec;3(12):1598-1625
Hepatology communications 2019 Dec;3(12):1598-1625
No comments: Submit comment
Supportive validation
- Submitted by
- Invitrogen Antibodies (provider)
- Main image

- Experimental details
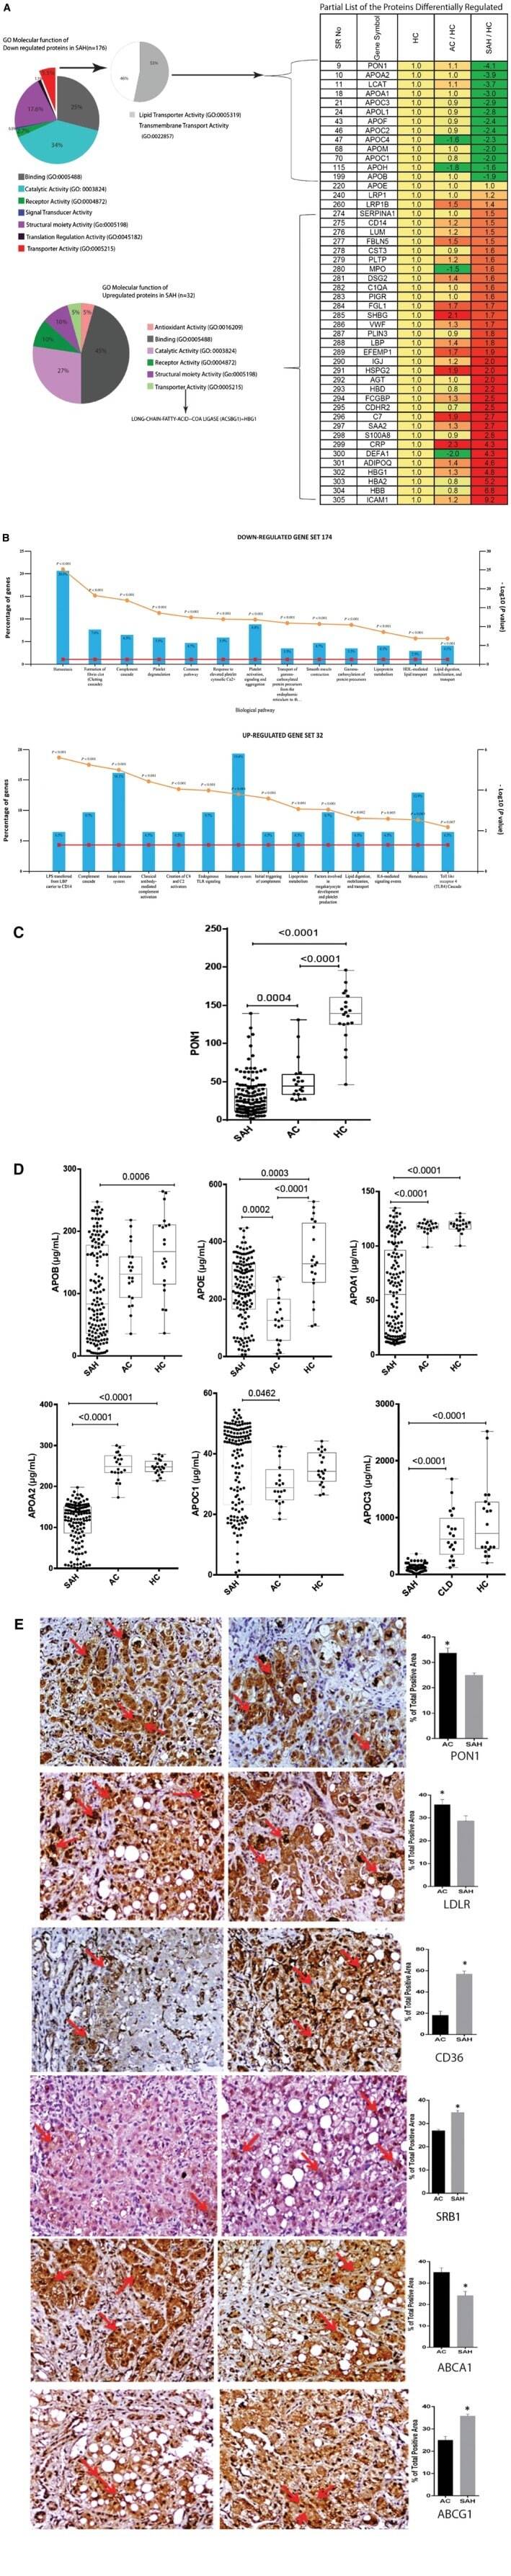
- Western blot analysis of LDLR using a polyclonal antibody (Product # PA5-22976).

- Submitted by
- Invitrogen Antibodies (provider)
- Main image
- Experimental details
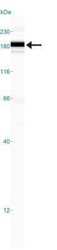
- Western blot analysis of LDLR in 0.5 mg/mL HepG2 lysate. Samples were incubated in LDLR polyclonal (Product # PA5-22976). This experiment was performed under reducing conditions using the 12-230 kDa separation system.

- Submitted by
- Invitrogen Antibodies (provider)
- Main image

- Experimental details
- Western blot analysis of LDLR in HepG2 whole cell lysate. Sample was incubated in LDLR polyclonal antibody (Product # PA5-22976).
- Submitted by
- Invitrogen Antibodies (provider)
- Main image
- Experimental details
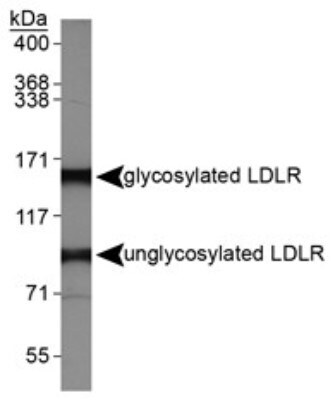
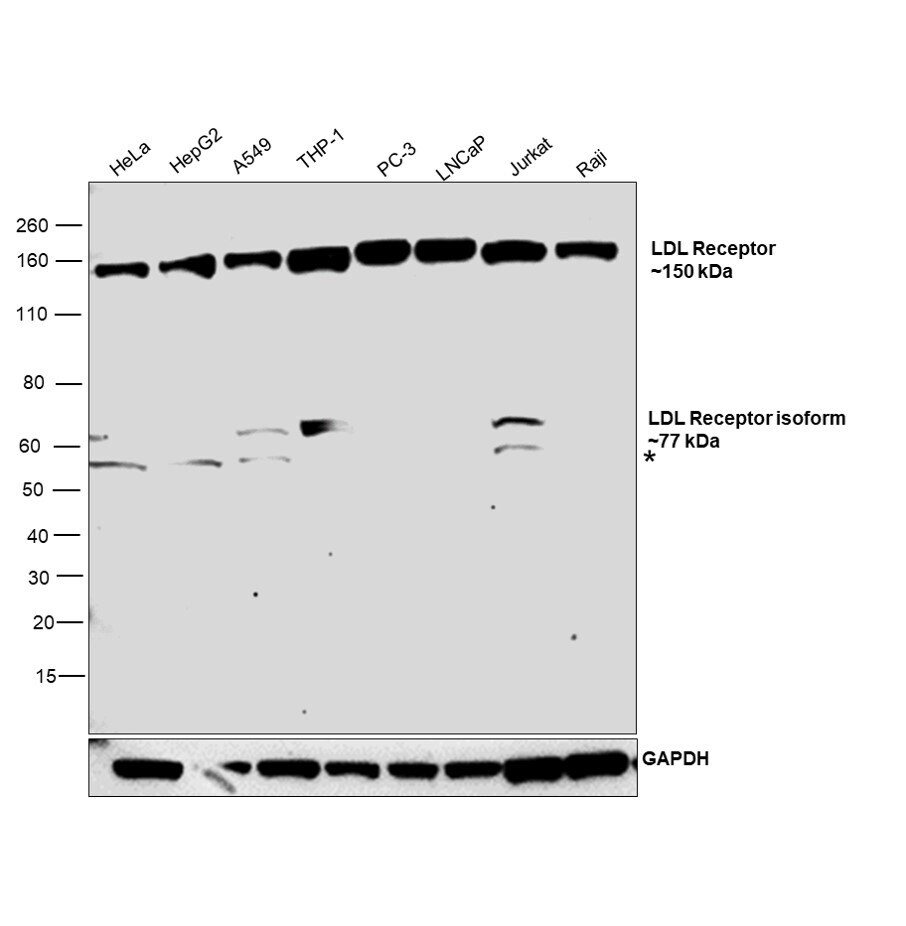
- Western blot was performed using Anti-LDLR Polyclonal Antibody (Product # PA5-22976) and a 150 kDa band corresponding to LDLR was observed across all the cell line tested. Membrane enriched extracts (30 µg lysate) of HeLa (Lane 1), Hep G2 (Lane 2), A549 (Lane 3), THP-1 (Lane 4), PC-3 (Lane 5), LNCaP (Lane 6), Jurkat (Lane 7), Raji (Lane 8) were electrophoresed using NuPAGE™ 4-12% Bis-Tris Protein Gel (Product # NP0322BOX). Resolved proteins were then transferred onto a nitrocellulose membrane (Product # IB23001) by iBlot® 2 Dry Blotting System (Product # IB21001). The blot was probed with the primary antibody (0.5 µg/mL) and detected by chemiluminescence with Goat anti-Rabbit IgG (H+L) Superclonal™ Recombinant Secondary Antibody, HRP (Product # A27036,1:20,000 dilution) using the iBright™ FL1500 Imaging System (Product # A44115). Chemiluminescent detection was performed using SuperSignal™ West Pico PLUS Chemiluminescent Substrate (Product # 34580). LDLR isoform was observed at 77 kDa in A549, THP-1 and Jurkat cell lines.
- Submitted by
- Invitrogen Antibodies (provider)
- Main image

- Experimental details
- Western blot analysis of LDLR in 0.5 mg/mL HepG2 lysate. Samples were incubated in LDLR polyclonal (Product # PA5-22976). This experiment was performed under reducing conditions using the 12-230 kDa separation system.

- Submitted by
- Invitrogen Antibodies (provider)
- Main image
- Experimental details
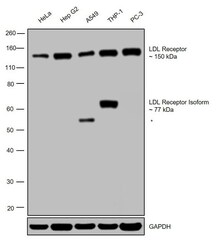
- Western blot was performed using Anti-LDLR Polyclonal Antibody (Product # PA5-22976) and a 150 kDa band corresponding to LDLR was observed in HeLa, HepG2, A549, THP1 and PC3 cell lines tested . Membrane enriched extracts (30 µg lysate) of HeLa (Lane 1), HepG2 (Lane 2), A549 (Lane 3), THP1 (Lane 4) and PC3 (Lane 5) were electrophoresed using NuPAGE™ 4-12% Bis-Tris Protein Gel (Product # NP0322BOX). Resolved proteins were then transferred onto a nitrocellulose membrane (Product # IB23001) by iBlot® 2 Dry Blotting System (Product # IB21001). The blot was probed with the primary antibody (0.5 µg/mL) and detected by chemiluminescence with Goat anti-Rabbit IgG (H+L) Superclonal™ Recombinant Secondary Antibody, HRP (Product # A27036, 1:4000 dilution) using the iBright FL 1000 (Product # A32752). Chemiluminescent detection was performed using Novex® ECL Chemiluminescent Substrate Reagent Kit (Product # WP20005).LDLR Isoform was observed at 77kDa in THP1 sample. (Note: Uncharacterized band (*) was observed in A549 sample).
Supportive validation
- Submitted by
- Invitrogen Antibodies (provider)
- Main image

- Experimental details
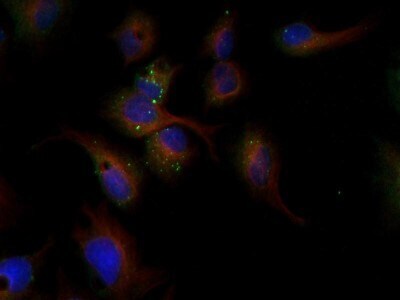
- Immunocytochemistry analysis of LDLR in HepG2 cells. Samples were incubated in LDLR polyclonal antibody (Product # PA5-22976) followed by DyLight 488 (green). Nuclei and alpha-tubulin were counterstained with DAPI (blue) and DyLight 550 (red).
- Submitted by
- Invitrogen Antibodies (provider)
- Main image

- Experimental details
- Immunofluorescence analysis of LDLR was performed using 90% confluent log phase Caco-2 cells. The cells were fixed with 4% paraformaldehyde for 10 minutes, permeabilized with 0.1% Triton™ X-100 for 15 minutes, and blocked with 2% BSA for 45 minutes at room temperature. The cells were labeled with LDLR Polyclonal Antibody (Product # PA5-22976) at 1:100 dilution in 0.1% BSA, incubated at 4 degrees celsius overnight, and then labeled with Donkey anti-Rabbit IgG (H+L) Highly Cross-Adsorbed Secondary Antibody, Alexa Fluor Plus 488 (Product # A32790), (1:2000 dilution), for 45 minutes at room temperature (Panel a: Green). Nuclei (Panel b: Blue) were stained with Hoechst 33342 (Product # H1399). F-actin (Panel c: Red) was stained with Alexa Fluor™ Plus 647 Phalloidin (Product # A30107, 1:2000 dilution). Panel d represents the merged image showing membranous and cytoplasmic localization. Panel e represents control cells with no primary antibody to assess the background. The images were captured at 40X magnification in CellInsight CX7 LZR High-Content Screening (HCS) Platform (Product # CX7A1110LZR) and externally deconvoluted (D.Sage et al. / Methods 115 (2017) 28–41).

Supportive validation
- Submitted by
- Invitrogen Antibodies (provider)
- Main image

- Experimental details
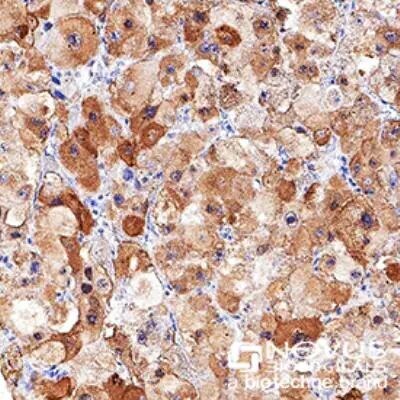
- Immunohistochemical analysis of LDLR in immersion fixed paraffin-embedded sections of human liver cancer. Samples were incubated in LDLR polyclonal antibody (Product # PA5-22976) using a dilution of 1:3000 overnight at 4 °C. Tissue was stained using the VisuCyte anti-rabbit HRP polymer detection reagent with DAB chromogen (brown) and counterstained with hematoxylin (blue).
Supportive validation
- Submitted by
- Invitrogen Antibodies (provider)
- Main image

- Experimental details
- Figure 1 Quantitative proteomic analysis identifies significantly down-regulated lipid transporter proteins in SAH. (A) Partial list of proteins differentially regulated (>1.5-fold; P < 0.05) between SAH, AC, HC, and its GO analysis, which documents enrichment of lipid transporters in SAH. (B) KEGG enrichment analysis of the up-regulated (n = 32) and down-regulated (n = 176) proteins in patients with SAH represents significant ( P < 0.05) enrichment. (C) Plasma level of PON1 was down-regulated in patients with SAH (median, 23.2; range, 2.3-139.4) compared to those with AC (median, 44.7; range, 25.8-131) and HC (median, 139.5; range, 46.6-196.0) ( P < 0.05). (D) Plasma level of apolipoproteins (APOB, APOE, APOA1, APOA2, APOC1, APOC3) in SAH compared to AC and HC ( P < 0.05 is significant). (E) IHC showing expression of PON1, LDL, CD36, SRA1, ABCA1, and ABCG1 in SAH (n = 5) and AC (n = 5). For all IHC analyses, relative quantization of positively stained cells are expressed as mean number of positive cells/10 high-power field (40x) and * P < 0.05. Abbreviations: COA, coenzyme A; HBG1, hemoglobin subunit gamma 1; KEGG, Kyoto Encyclopedia of Genes and Genomes; LBP, lipopolysaccharide binding protein; LPS, lipopolysaccharide; TLR4, toll-like receptor 4;