 Explore
 Validate
 Learn
Learn Western blot
 Immunohistochemistry
Antibody data
- Antibody Data
- Antigen structure
- References [2]
- Comments [0]
- Validations
- Western blot [1]
- Immunocytochemistry [2]
- Other assay [2]
Submit
Validation data
Reference
Comment
Report error
- Product number
- OSS00035W - Provider product page

- Provider
- Invitrogen Antibodies
- Product name
- VAMP2 Polyclonal Antibody
- Antibody type
- Polyclonal
- Antigen
- Synthetic peptide
- Reactivity
- Human, Mouse, Rat
- Host
- Rabbit
- Isotype
- IgG
- Vial size
- 100 µL
- Concentration
- Conc. Not Determined
- Storage
- Store at 4°C short term. For long term storage, store at -20°C, avoiding freeze/thaw cycles. Glycerol (1:1) may be added for added stability.
Submitted references Morphological and histochemical characterization of the secretory epithelium in the canine lacrimal gland.
Knockout of p75 neurotrophin receptor attenuates the hyperphosphorylation of Tau in pR5 mouse model.
Yasui T, Miyata K, Nakatsuka C, Tsukise A, Gomi H
European journal of histochemistry : EJH 2021 Nov 2;65(4)
European journal of histochemistry : EJH 2021 Nov 2;65(4)
Knockout of p75 neurotrophin receptor attenuates the hyperphosphorylation of Tau in pR5 mouse model.
Mañucat-Tan NB, Shen LL, Bobrovskaya L, Al-Hawwas M, Zhou FH, Wang YJ, Zhou XF
Aging 2019 Sep 3;11(17):6762-6791
Aging 2019 Sep 3;11(17):6762-6791
No comments: Submit comment
Supportive validation
- Submitted by
- Invitrogen Antibodies (provider)
- Main image
- Experimental details
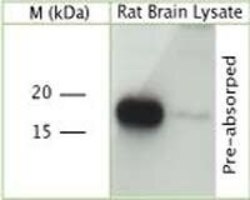
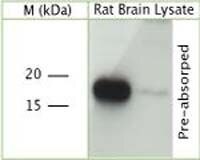
- Western blot analysis of VAMP2 using a polyclonal antibody (Product # OSS00035W).
Supportive validation
- Submitted by
- Invitrogen Antibodies (provider)
- Main image

- Experimental details
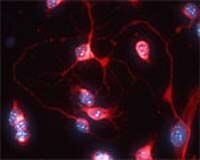
- Immunofluorescent analysis of VAMP2 using a polyclonal antibody (Product # OSS00035W).
- Submitted by
- Invitrogen Antibodies (provider)
- Main image
- Experimental details
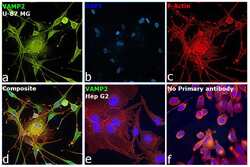
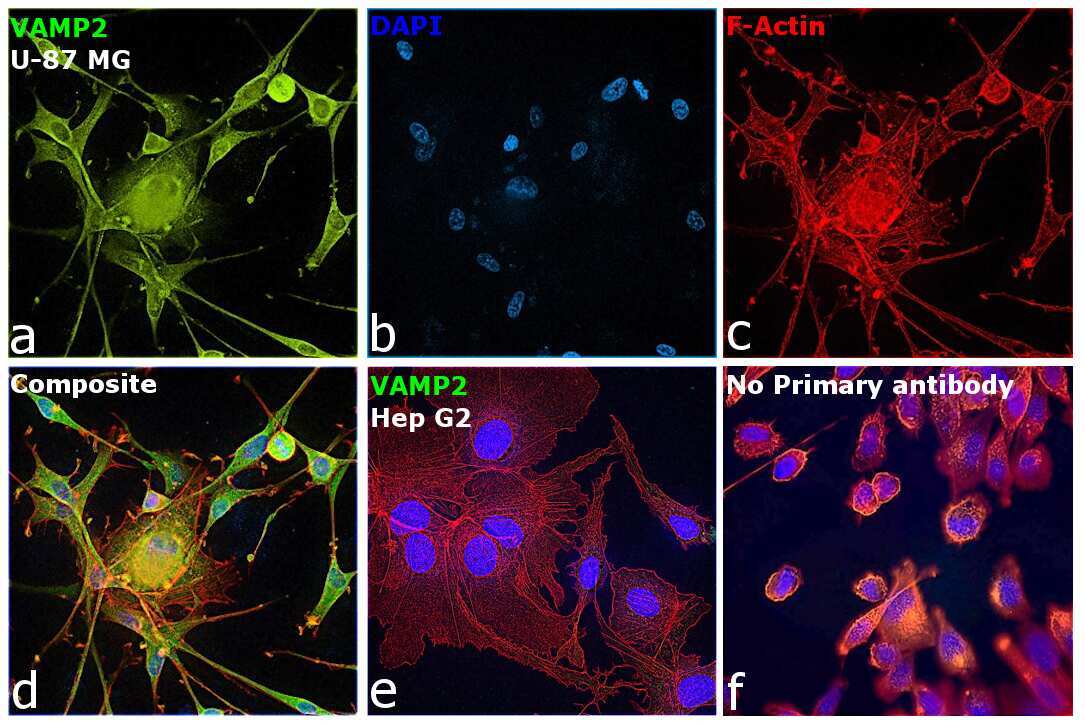
- Immunofluorescence analysis of Vesicle-associated membrane protein 2 was performed using 70% confluent log phase U-87 MG and Hep G2 cells. The cells were fixed with 4% paraformaldehyde for 10 minutes, permeabilized with 0.1% Triton™ X-100 for 15 minutes, and blocked with 2% BSA for 1 hour at room temperature. The cells were labeled with VAMP2 Polyclonal Antibody (Product # OSS00035W), at 1:100 in 0.1% BSA, incubated at 4 degree celsius overnight and then labeled with Donkey anti-Rabbit IgG (H+L) Highly Cross-Adsorbed Secondary Antibody, Alexa Fluor Plus 488 (Product # A32790), (1:2000), for 45 minutes at room temperature (Panel a: Green). Nuclei (Panel b:Blue) were stained with ProLong™ Diamond Antifade Mountant with DAPI (Product # P36962). F-actin (Panel c: Red) was stained with Rhodamine Phalloidin (Product # R415, 1:300). Panel d represents the merged image showing Plasma membrane localization of VAMP2 in U-87 MG cells. Panel e shows no staining in Hep G2 cells which is reported to be negative for the protein. Panel f represents control U-87 MG cells with no primary antibody to assess background. The images were captured at 60X magnification.
Supportive validation
- Submitted by
- Invitrogen Antibodies (provider)
- Main image
- Experimental details
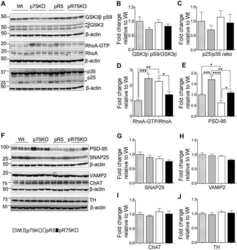
- Figure 3 Synaptic proteins, neuronal markers and Tau kinase activity in pR75KO at 6 months. ( A ) Protein blots of kinases involved in Tau phosphorylation, GSK3beta, RhoA and Cdk5 activators, p35 and p25 proteins in the forebrain of Wt, p75KO, pR5, and pR75KO mice. Protein band intensity quantification of inactive GSK3:GSK3beta pS9 normalised with total GSK3beta ( B ), Cdk5 activators, p25/p35 ratio ( C ), and active RhoA-GTP normalised with total RhoA ( D ). All band intensities showing B-D are expressed as fold change relative to Wt. F) Protein blots of post-synaptic protein, PSD-95 and pre-synaptic proteins, SNAP25 and VAMP2, tyrosine hydroxylase (TH) and choline acetyl transferase (ChAT). Protein band intensity quantification of PSD-95 ( E ), SNAP25 ( G ), VAMP2 ( H ), choline acetyl transferase (ChAT) ( I ), and tyrosine hydroxylase (TH) ( J ) normalised with total beta-actin of respective blot and expressed as fold change relative to Wt. Data are represented as the mean +- SEM, n=6. Statistical comparisons were performed using one-way ANOVA and Tukey's test. Statistical significance: *P

- Submitted by
- Invitrogen Antibodies (provider)
- Main image
- Experimental details
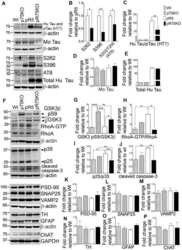
- Figure 4 Knock out of p75 NTR attenuated Tau hyperposphorylation and the elevated Tau kinases and caspase-3 activities observed in pR5 mice with P301L Tau at 9 months. ( A ) Protein blots of phosphorylated and non-phosphorylated human Tau in in the forebrain of Wt, p75KO, pR5, and pR75KO mice. ( B ) Protein band intensity quantification of phosphorylated human Tau at sites S262, S396 and S202/T205 (AT8) normalised to the total human Tau and expressed as fold change relative to pR5. Protein band intensity quantification of total human Tau and pTau detected by HT7 ( C ), total mouse Tau detected by Tau5 ( D ), and total human Tau detected by sheep-anti human Tau ( E ) normalised to beta-actin and expressed as fold change relative to Wt. ( F ) Protein blots of kinases involved in Tau phosphorylation, GSK3, RhoA and Cdk5-activators, p25 and p35 proteins in the forebrain of Wt, p75KO, pR5, and pR75KO mice; of cleaved caspase-3; and of post-synaptic protein, PSD-95 and pre-synaptic proteins, SNAP25 and VAMP2, GFAP, TH ChAT. Protein band intensity quantification of inactive GSK3: GSK3beta pS9 normalised with total GSK3beta ( G ), active RhoA-GTP normalised with total RhoA ( H ), and Cdk5 activators, p25/p35 ratio ( I ). All band intensities showing ( G - I ) are expressed as fold change relative to Wt. Protein band intensity quantification of cleaved caspase-3 levels ( J ), PSD-95 ( K ), SNAP25 ( L ), VAMP2 ( M ), TH ( N ), GFAP ( O ), ChAT ( P ) normalized with their respective bet
