Antibody data
- Antibody Data
- Antigen structure
- References [4]
- Comments [0]
- Validations
- Western blot [2]
- Immunohistochemistry [1]
- Other assay [5]
Submit
Validation data
Reference
Comment
Report error
- Product number
- PA5-41484 - Provider product page

- Provider
- Invitrogen Antibodies
- Product name
- ETV1 Polyclonal Antibody
- Antibody type
- Polyclonal
- Antigen
- Synthetic peptide
- Description
- Peptide sequence: PDNQRPLLKT DMERHINEED TVPLSHFDES MAYMPEGGCC NPHPYNEGYV Sequence homology: Cow: 100%; Dog: 100%; Guinea Pig: 100%; Horse: 100%; Human: 100%; Mouse: 100%; Rabbit: 86%; Rat: 100%; Zebrafish: 86%
- Reactivity
- Human
- Host
- Rabbit
- Isotype
- IgG
- Vial size
- 100 µL
- Concentration
- 0.5 mg/mL
- Storage
- -20° C, Avoid Freeze/Thaw Cycles
Submitted references The Etv1/Er81 transcription factor coordinates myelination-related genes to regulate Schwann cell differentiation and myelination.
Cross-testing of major molecular markers indicates distinct pathways of tumorigenesis in gastric adenocarcinomas and synchronous gastrointestinal stromal tumors.
The role of miR-24 as a race related genetic factor in prostate cancer.
Differential expression of miR-34b and androgen receptor pathway regulate prostate cancer aggressiveness between African-Americans and Caucasians.
Askar P, Xu J, Hu J, Shangguan J, Sun H, Zhou S, Yang X, Chen G, Su W, Gu Y
Annals of translational medicine 2022 Aug;10(16):875
Annals of translational medicine 2022 Aug;10(16):875
Cross-testing of major molecular markers indicates distinct pathways of tumorigenesis in gastric adenocarcinomas and synchronous gastrointestinal stromal tumors.
Kocsmár É, Kocsmár I, Szalai L, Lendvai G, Szijártó A, Schaff Z, Kiss A, Kovalszky I, Papp G, Lotz G
Scientific reports 2020 Dec 17;10(1):22212
Scientific reports 2020 Dec 17;10(1):22212
The role of miR-24 as a race related genetic factor in prostate cancer.
Hashimoto Y, Shiina M, Kato T, Yamamura S, Tanaka Y, Majid S, Saini S, Shahryari V, Kulkarni P, Dasgupta P, Mitsui Y, Sumida M, Deng G, Tabatabai L, Kumar D, Dahiya R
Oncotarget 2017 Mar 7;8(10):16581-16593
Oncotarget 2017 Mar 7;8(10):16581-16593
Differential expression of miR-34b and androgen receptor pathway regulate prostate cancer aggressiveness between African-Americans and Caucasians.
Shiina M, Hashimoto Y, Kato T, Yamamura S, Tanaka Y, Majid S, Saini S, Varahram S, Kulkarni P, Dasgupta P, Mitsui Y, Sumida M, Tabatabai L, Deng G, Kumar D, Dahiya R
Oncotarget 2017 Jan 31;8(5):8356-8368
Oncotarget 2017 Jan 31;8(5):8356-8368
No comments: Submit comment
Supportive validation
- Submitted by
- Invitrogen Antibodies (provider)
- Main image
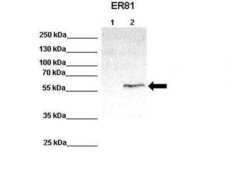
- Experimental details
- Western blot analysis of HEK293 cell lysate using an anti-ETV1 polyclonal antibody (Product # PA5-41484). Primary Antibody Dilution: 1:1000; Secondary Antibody: Anti-rabbit-HRP. LANE 1) 100µg untransfected HEK293 lysate; LANE 2) 33µg ER81 transfected HEK293 lysate.
- Submitted by
- Invitrogen Antibodies (provider)
- Main image
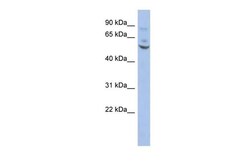
- Experimental details
- Western blot analysis of human HT1080 cell lysate using an anti-ETV1 polyclonal antibody (Product # PA5-41484).
Supportive validation
- Submitted by
- Invitrogen Antibodies (provider)
- Main image
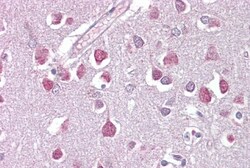
- Experimental details
- Immunohistochemistry analysis of brain, cortex tissue using an anti-ETV1 polyclonal antibody (Product # PA5-41484).
Supportive validation
- Submitted by
- Invitrogen Antibodies (provider)
- Main image
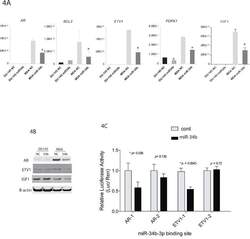
- Experimental details
- Figure 4 miR-34b target genes and luciferase reporter assay A. qPCR analysis of AR, BCL2, ETV1, PDPK1 and IGF1 from MDA-PCa-2b or DU-145 cells transfected with miR-34b-3p mimic. Asterisks indicate a p-value
- Submitted by
- Invitrogen Antibodies (provider)
- Main image
- Experimental details
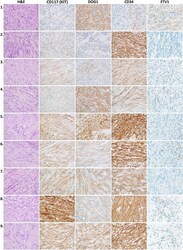
- Figure 2 Immunohistochemical analysis of micro-GIST samples of the nine cases. H&E hematoxylin and eosin, CD cluster of differentiation, DOG1 discovered on GIST-1. Original magnification: 600 x.
- Submitted by
- Invitrogen Antibodies (provider)
- Main image
- Experimental details
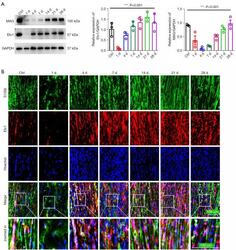
- Etv1 expression and cellular localization in the crushed mouse sciatic nerve. (A) WB analysis showing the expression of Etv1 and MAG in nerves on days 1, 4, 7, 14, 21, and 28 after nerve injury. The uninjured nerve served as the control (Ctrl). Quantitative statistical comparisons of Etv1 and MAG protein levels in regenerated nerve segments after nerve crush are shown in the histograms. ***, P < 0.001, one-way ANOVA, n=3 per group. (B) Immunofluorescence staining of the injured sciatic nerve sections of mice show only a small amount of Etv1 and S100beta co-localization on day 1 post-injury. Etv1 is mainly localized in SCs from day 4 after injury. Scale bar =100 mum. S100beta (a marker of SCs) is stained green and Etv1 is stained red. MAG, myelin-associated glycoprotein; GAPDH, glyceraldehyde 3-phosphate dehydrogenase; SC, Schwann cell; WB, Western blotting; ANOVA, analysis of variance.
- Submitted by
- Invitrogen Antibodies (provider)
- Main image
- Experimental details
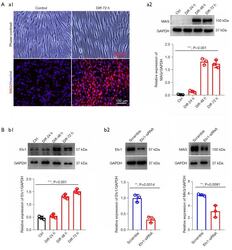
- Etv1 knockdown in Schwann cells antagonizes its differentiation. (A) (a1) Representative images of phase contrast microscopy and ICC analysis, showing that dB-cAMP can effectively induce SC differentiation. Red staining represents MAG expression and cell nuclei (blue) are marked with Hoechst staining. Scale bar =100 mum. (a2) WB comparing the expression of MAG in SCs treated with dB-cAMP or vehicle for 24, 48, and 72 hours. ***, P < 0.001; one-way ANOVA; n=3 per group. (B) (b1) Western blot comparing Etv1 levels in SCs differentiated for 24, 48, and 72 hours. ***, P < 0.001; one-way ANOVA; n=3 per group. (b2) WB showing Etv1 and MAG expression in differentiated SCs transfected with Etv1-siRNA and scrambled siRNA. The histogram shows that the knockdown of Etv1 in SCs significantly reduced the expression of MAG after the induction of differentiation. Student's t -test; **, P < 0.01 vs. scramble; n=3 per group. MAG, myelin-associated glycoprotein; GAPDH, glyceraldehyde 3-phosphate dehydrogenase; Ctrl, control; Dif, differentiation; siRNA, small interfering RNA; ICC, immunocytochemistry; SC, Schwann cell; WB, Western blotting; ANOVA, analysis of variance.
- Submitted by
- Invitrogen Antibodies (provider)
- Main image
- Experimental details
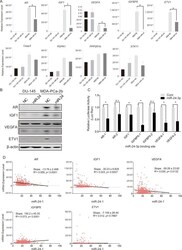
- Figure 5 Predicted target gene expression changes after miR-24 induction ( A ) qPCR analyses for the predicted target genes of miR-24. We checked candidate gene expression levels after miR-24 over-expression. * p < 0.05, Bar = +- SEM. ( B ) Western blotting of miR-24 target genes. ( C )The results of Dual Luciferase Reporter Assays. Except for IGF1, all genes have two different binding sites (for instance; AR-1 and AR-2 mean that miR-24 was predicted that it may bind to two different site of AR mRNA). * p < 0.05, n.s; no significance, Bar = +- SEM. ( D ) Linear regression model of mRNA expression levels between miR-24-1 and its five target genes in human PCa samples.
 Explore
 Validate
 Learn
Learn Western blot