 Explore
 Validate
 Learn
Learn Western blot
Antibody data
- Antibody Data
- Antigen structure
- References [1]
- Comments [0]
- Validations
- Western blot [1]
- Immunohistochemistry [1]
- Other assay [1]
Submit
Validation data
Reference
Comment
Report error
- Product number
- PA5-100892 - Provider product page

- Provider
- Invitrogen Antibodies
- Product name
- CYP7A1 Polyclonal Antibody
- Antibody type
- Polyclonal
- Antigen
- Synthetic peptide
- Reactivity
- Human, Mouse, Rat
- Host
- Rabbit
- Isotype
- IgG
- Vial size
- 100 µL
- Concentration
- 1 mg/mL
- Storage
- -20°C
Submitted references Rosmarinic Acid Exhibits a Lipid-Lowering Effect by Modulating the Expression of Reverse Cholesterol Transporters and Lipid Metabolism in High-Fat Diet-Fed Mice.
Nyandwi JB, Ko YS, Jin H, Yun SP, Park SW, Kim HJ
Biomolecules 2021 Oct 6;11(10)
Biomolecules 2021 Oct 6;11(10)
No comments: Submit comment
Supportive validation
- Submitted by
- Invitrogen Antibodies (provider)
- Main image

- Experimental details
- Western blot analysis of CYP7A1 in K562 cell lysate (left lane: treated with the antigen-specific peptide). Samples were incubated with CYP7A1 polyclonal antibody (Product # PA5-100892).

Supportive validation
- Submitted by
- Invitrogen Antibodies (provider)
- Main image
- Experimental details
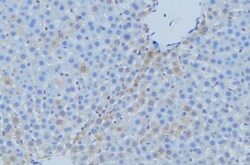
- Immunohistochemistry analysis of paraffin-embedded CYP7A1 in mouse liver tissue. Antigen retrieval was performed using citrate buffer. Samples were blocked with blocking buffer (1.5 hr, 22°C), incubated with CYP7A1 polyclonal antibody (Product # PA5-100892) using a dilution of 1:100 (1.5 hr, 22°C), followed by HRP conjugated goat anti-rabbit.

Supportive validation
- Submitted by
- Invitrogen Antibodies (provider)
- Main image

- Experimental details
- Figure 4 RA significantly induces ABCG5/8 and ABCA1 protein levels, which are involved in hepatobilial cholesterol excretion, and CYP7A1 protein levels, a key rate-limiting enzyme for bile acid biosynthesis in HFD-fed mice. ( A - D ) ABCG5, ABCG8, ABCA1, and ( E , F ) CYP7A1 protein levels were examined in liver tissues by western blot analysis, and the relative protein levels are presented as the mean +- SD ( n = 4-6). ** p < 0.01 vs. ND control mice; # p < 0.05, ## p < 0.01, vs. HFD mice; $ p < 0.05, $$ p < 0.01 vs. RA 50.
