 Explore
 Validate
 Learn
Learn Western blot
Antibody data
- Antibody Data
- Antigen structure
- References [1]
- Comments [0]
- Validations
- Western blot [2]
- Immunohistochemistry [1]
- Other assay [2]
Submit
Validation data
Reference
Comment
Report error
- Product number
- PA5-25406 - Provider product page

- Provider
- Invitrogen Antibodies
- Product name
- MTCH2 Polyclonal Antibody
- Antibody type
- Polyclonal
- Antigen
- Synthetic peptide
- Reactivity
- Human, Mouse
- Host
- Rabbit
- Isotype
- IgG
- Vial size
- 400 µL
- Concentration
- 0.5 mg/mL
- Storage
- -20° C, Avoid Freeze/Thaw Cycles
Submitted references Stop codon read-through of mammalian MTCH2 leading to an unstable isoform regulates mitochondrial membrane potential.
Manjunath LE, Singh A, Sahoo S, Mishra A, Padmarajan J, Basavaraju CG, Eswarappa SM
The Journal of biological chemistry 2020 Dec 11;295(50):17009-17026
The Journal of biological chemistry 2020 Dec 11;295(50):17009-17026
No comments: Submit comment
Supportive validation
- Submitted by
- Invitrogen Antibodies (provider)
- Main image

- Experimental details
- Western blot analysis using a MTCH2 polyclonal antibody (Product # PA5-25406) in MDA-MB435 cell lysates (35 µg per lane).

- Submitted by
- Invitrogen Antibodies (provider)
- Main image

- Experimental details
- Western blot analysis using a MTCH2 polyclonal antibody (Product # PA5-25406) in mouse NIH-3T3 cell lysates (35 µg per lane).

Supportive validation
- Submitted by
- Invitrogen Antibodies (provider)
- Main image

- Experimental details
- Immunohistochemistry analysis in formalin-fixed, paraffin-embedded human brain tissue using a MTCH2 polyclonal antibody (Product # PA5-25406), followed by HRP-conjugated secondary antibody and DAB staining.

Supportive validation
- Submitted by
- Invitrogen Antibodies (provider)
- Main image
- Experimental details
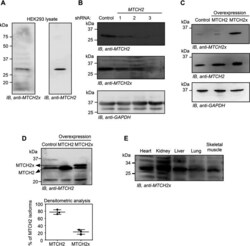
- Figure 5. Detection of endogenous MTCH2x. A, Western blotting performed using an antibody (anti-MTCH2x) generated against the peptide encoded by the ISR1 (RCGAGTVTFL) in HEK293 cell lysate. B, Western blotting performed using the same antibody in HEK293 cells transfected with MTCH2 -specific shRNAs. C, detection of exogenous overexpressed MTCH2x by anti-MTCH2x antibody in HEK293 cells. D, amount of MTCH2x relative to MTCH2 was estimated by performing a prolonged SDS-PAGE followed by Western blotting using anti-MTCH2 antibody that can potentially recognize all isoforms. Quantification is shown below (mean +- S.D., n = 3). Lysates from cells overexpressing MTCH2 or MTCH2x (without any tag) were used to distinguish endogenous MTCH2 and MTCH2x. E, detection of endogenous MTCH2x in mitochondrial extracts from multiple mouse organs.

- Submitted by
- Invitrogen Antibodies (provider)
- Main image

- Experimental details
- Figure 8. Double-SCR of MTCH2 is required to maintain normal mitochondrial membrane potential. A, CRISPR-Cas9 technique was used to delete the most part of ISR1 and ISR2 in the genome of HEK293 cells (termed DeltaRT MTCH2 ). Deletion was confirmed by PCR amplification from genomic DNA using primers flanking the targeted region, and by sequencing the product. Sequencing was performed using a reverse primer that generated reverse-complement sequence. A part of this is shown as an electropherogram. The deleted part in ISR1 and ISR2 is shown in gray background. Three in-frame stop codons are shown in boldface . B, Western blotting showing the absence of MTCH2x and increased levels of MTCH2 in DeltaRT MTCH2 cells compared with the WT cells ( WT ). Long and short exposures are shown for MTCH2. C, JC-1 fluorescence profile shows reduced mitochondrial membrane potential in two different DeltaRT MTCH2 clones ( left ). H 2 O 2 treatment was used as a positive control for mitochondrial membrane depolarization. Ratio of fluorescence at lambda 594 to lambda 538 is shown ( right ) ( n = 4). D, DeltaRT MTCH2 cells show reduced ATP levels compared with the WT cells. Cells were incubated in serum-free DMEM containing 10 mu m galactose for 48 h before measuring ATP levels using a luminescence-based assay ( n = 3). E, WT and DeltaRT MTCH2 cells have comparable mitochondrial mass. The flow cytometry was performed using the fluorescent probe, nonyl acridine orange ( NAO ) ( n = 3). F, quantitativ
