 Explore
 Validate
 Learn
Learn Flow cytometry
Antibody data
- Antibody Data
- Antigen structure
- References [12]
- Comments [0]
- Validations
- Flow cytometry [1]
- Other assay [9]
Submit
Validation data
Reference
Comment
Report error
- Product number
- 25-1079-42 - Provider product page

- Provider
- Invitrogen Antibodies
- Product name
- CD107a (LAMP-1) Monoclonal Antibody (eBioH4A3), PE-Cyanine7, eBioscience™
- Antibody type
- Monoclonal
- Antigen
- Other
- Description
- Description: The eBioH4A3 monoclonal antibody reacts with human CD107a, also known as lysosomal-associated membrane protein-1 (LAMP-1). CD107a is a highly glycosylated protein of approximately 110kDa. It is predominantly expressed intracellularly in the lysosomal/endosomal membrane in nearly all cells. CD107a is transiently expressed on the cell surface of degranulating cytolytic T cells, and is also upregulated on the surface of activated platelets and some cancer cells. Applications Reported: This eBioH4A3 antibody has been reported for use in intracellular staining followed by flow cytometric analysis. Applications Tested: This eBioH4A3 antibody has been pre-titrated and tested by intracellular staining and flow cytometric analysis of Jurkat cells. This can be used at 5 µL (0.06 µg) per test. A test is defined as the amount (µg) of antibody that will stain a cell sample in a final volume of 100 µL. Cell number should be determined empirically but can range from 10^5 to 10^8 cells/test. Light sensitivity: This tandem dye is sensitive to photo-induced oxidation. Please protect this vial and stained samples from light. Fixation: Samples can be stored in IC Fixation Buffer (Product # 00-822-49) (100 µL of cell sample + 100 µL of IC Fixation Buffer) or 1-step Fix/Lyse Solution (Product # 00-5333-54) for up to 3 days in the dark at 4°C with minimal impact on brightness and FRET efficiency/compensation. Some generalizations regarding fluorophore performance after fixation can be made, but clone specific performance should be determined empirically. Excitation: 488-561 nm; Emission: 775 nm; Laser: Blue Laser, Green Laser, Yellow-Green Laser. Filtration: 0.2 µm post-manufacturing filtered.
- Reactivity
- Human
- Host
- Mouse
- Isotype
- IgG
- Antibody clone number
- eBioH4A3
- Vial size
- 100 Tests
- Concentration
- 5 µL/Test
- Storage
- 4° C, store in dark, DO NOT FREEZE!
Submitted references Circulating prostate cancer cells have differential resistance to fluid shear stress-induced cell death.
PBRM1 and the glycosylphosphatidylinositol biosynthetic pathway promote tumor killing mediated by MHC-unrestricted cytotoxic lymphocytes.
MAVS Genetic Variation Is Associated with Decreased HIV-1 Replication In Vitro and Reduced CD4(+) T Cell Infection in HIV-1-Infected Individuals.
HLA-B*27:05 alters immunodominance hierarchy of universal influenza-specific CD8+ T cells.
Complement receptor CD46 co-stimulates optimal human CD8(+) T cell effector function via fatty acid metabolism.
PD1 is expressed on exhausted T cells as well as virus specific memory CD8+ T cells in the bone marrow of myeloma patients.
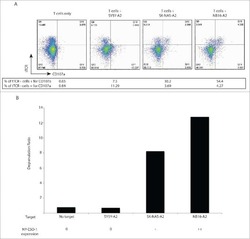
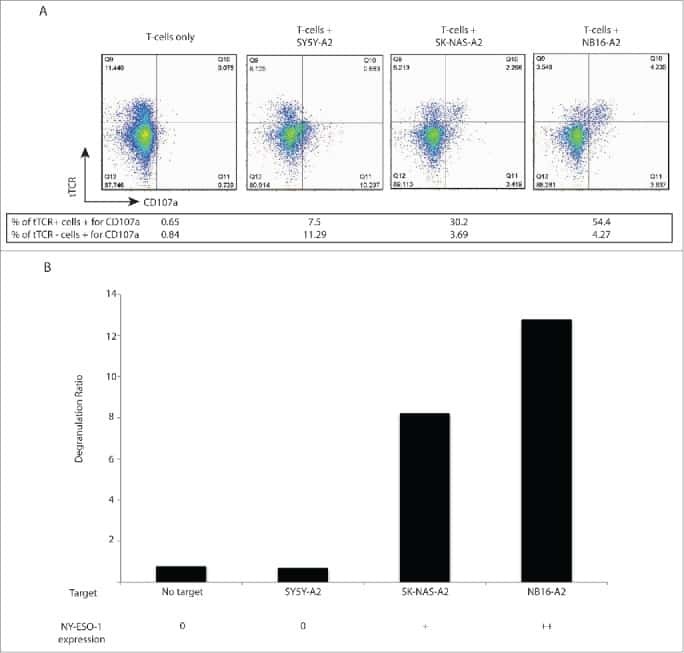
T cells targeting NY-ESO-1 demonstrate efficacy against disseminated neuroblastoma.
Inhibition of CD39 enzymatic function at the surface of tumor cells alleviates their immunosuppressive activity.
The small chemical vacuolin-1 alters the morphology of lysosomes without inhibiting Ca2+-regulated exocytosis.
Detection of T-cell degranulation: CD107a and b.
LAMP-1 and LAMP-2, but not LAMP-3, are reliable markers for activation-induced secretion of human mast cells.
Expression of Lamp-1 and Lamp-2 and their interactions with galectin-3 in human tumor cells.
Hope JM, Bersi MR, Dombroski JA, Clinch AB, Pereles RS, Merryman WD, King MR
Journal of cell science 2021 Feb 22;134(4)
Journal of cell science 2021 Feb 22;134(4)
PBRM1 and the glycosylphosphatidylinositol biosynthetic pathway promote tumor killing mediated by MHC-unrestricted cytotoxic lymphocytes.
Menasche BL, Davis EM, Wang S, Ouyang Y, Li S, Yu H, Shen J
Science advances 2020 Nov;6(48)
Science advances 2020 Nov;6(48)
MAVS Genetic Variation Is Associated with Decreased HIV-1 Replication In Vitro and Reduced CD4(+) T Cell Infection in HIV-1-Infected Individuals.
Stunnenberg M, van Pul L, Sprokholt JK, van Dort KA, Gringhuis SI, Geijtenbeek TBH, Kootstra NA
Viruses 2020 Jul 16;12(7)
Viruses 2020 Jul 16;12(7)
HLA-B*27:05 alters immunodominance hierarchy of universal influenza-specific CD8+ T cells.
Sant S, Quiñones-Parra SM, Koutsakos M, Grant EJ, Loudovaris T, Mannering SI, Crowe J, van de Sandt CE, Rimmelzwaan GF, Rossjohn J, Gras S, Loh L, Nguyen THO, Kedzierska K
PLoS pathogens 2020 Aug;16(8):e1008714
PLoS pathogens 2020 Aug;16(8):e1008714
Complement receptor CD46 co-stimulates optimal human CD8(+) T cell effector function via fatty acid metabolism.
Arbore G, West EE, Rahman J, Le Friec G, Niyonzima N, Pirooznia M, Tunc I, Pavlidis P, Powell N, Li Y, Liu P, Servais A, Couzi L, Fremeaux-Bacchi V, Placais L, Ferraro A, Walsh PR, Kavanagh D, Afzali B, Lavender P, Lachmann HJ, Kemper C
Nature communications 2018 Oct 10;9(1):4186
Nature communications 2018 Oct 10;9(1):4186
PD1 is expressed on exhausted T cells as well as virus specific memory CD8+ T cells in the bone marrow of myeloma patients.
Sponaas AM, Yang R, Rustad EH, Standal T, Thoresen AS, Dao Vo C, Waage A, Slørdahl TS, Børset M, Sundan A
Oncotarget 2018 Aug 10;9(62):32024-32035
Oncotarget 2018 Aug 10;9(62):32024-32035
T cells targeting NY-ESO-1 demonstrate efficacy against disseminated neuroblastoma.
Singh N, Kulikovskaya I, Barrett DM, Binder-Scholl G, Jakobsen B, Martinez D, Pawel B, June CH, Kalos MD, Grupp SA
Oncoimmunology 2016;5(1):e1040216
Oncoimmunology 2016;5(1):e1040216
Inhibition of CD39 enzymatic function at the surface of tumor cells alleviates their immunosuppressive activity.
Bastid J, Regairaz A, Bonnefoy N, Déjou C, Giustiniani J, Laheurte C, Cochaud S, Laprevotte E, Funck-Brentano E, Hemon P, Gros L, Bec N, Larroque C, Alberici G, Bensussan A, Eliaou JF
Cancer immunology research 2015 Mar;3(3):254-65
Cancer immunology research 2015 Mar;3(3):254-65
The small chemical vacuolin-1 alters the morphology of lysosomes without inhibiting Ca2+-regulated exocytosis.
Huynh C, Andrews NW
EMBO reports 2005 Sep;6(9):843-7
EMBO reports 2005 Sep;6(9):843-7
Detection of T-cell degranulation: CD107a and b.
Betts MR, Koup RA
Methods in cell biology 2004;75:497-512
Methods in cell biology 2004;75:497-512
LAMP-1 and LAMP-2, but not LAMP-3, are reliable markers for activation-induced secretion of human mast cells.
Grützkau A, Smorodchenko A, Lippert U, Kirchhof L, Artuc M, Henz BM
Cytometry. Part A : the journal of the International Society for Analytical Cytology 2004 Sep;61(1):62-8
Cytometry. Part A : the journal of the International Society for Analytical Cytology 2004 Sep;61(1):62-8
Expression of Lamp-1 and Lamp-2 and their interactions with galectin-3 in human tumor cells.
Sarafian V, Jadot M, Foidart JM, Letesson JJ, Van den Brûle F, Castronovo V, Wattiaux R, Coninck SW
International journal of cancer 1998 Jan 5;75(1):105-11
International journal of cancer 1998 Jan 5;75(1):105-11
No comments: Submit comment
Supportive validation
- Submitted by
- Invitrogen Antibodies (provider)
- Main image

- Experimental details
- Staining of Jurkat cells with Mouse IgG1 K Isotype Control PE-Cyanine7 (Product # 25-4714-80) (blue histogram) or Anti-Human CD107a (LAMP-1) PE-Cyanine7 (purple histogram). Total cells were used for analysis.

Supportive validation
- Submitted by
- Invitrogen Antibodies (provider)
- Main image
- Experimental details
- NULL
- Submitted by
- Invitrogen Antibodies (provider)
- Main image
- Experimental details
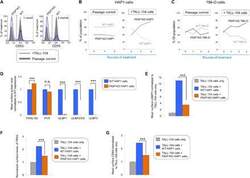
- Fig. 4 The GPI biosynthetic pathway is essential to CL activation and cytolytic granule secretion. ( A ) A mixed population of WT and PIGP KO HAP1 cells was either untreated or treated with TALL-104 cells. Negative surface staining of CD55, a GPI-AP not involved in CL-mediated killing, was used as a marker for PIGP KO cells. CD55 + WT cells and CD55 - PIGP KO cells were analyzed by flow cytometry. ( B ) Percentage of WT and PIGP KO HAP1 cells in the passage control or TALL-104-treated population. ( C ) Percentage of WT and PIGP KO 786-O cells in the passage control or TALL-104-treated population. CD55 + WT cells and CD55 - PIGP KO 786-O cells were quantified by flow cytometry after each round of treatment. Data in (B) and (C) are presented as mean values ( n = 3). ( D ) Normalized surface levels of immune regulators on WT and PIGP KO HAP1 cells. ( E ) TALL-104 degranulation presented as normalized surface levels of LAMP1 on TALL-104 cells. ( F ) Normalized surface levels of TRAIL on TALL-104 cells. ( G ) Normalized surface levels of CD69 on TALL-104 cells. Data in (D) to (G) are presented as means +- SD ( n = 3). P values were calculated using Student's t test. n.s., P > 0.05. *** P < 0.001.

- Submitted by
- Invitrogen Antibodies (provider)
- Main image
- Experimental details
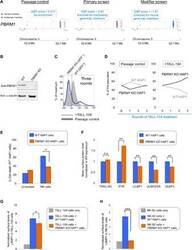
- Fig. 5 PBRM1 regulates ULBP expression in target cells and promotes cytolytic granule secretion in CLs. ( A ) Visual representations of gene-trap insertions in the PBRM1 gene in the screens. The gray boxes indicate exons, and the gray lines indicate introns. The gray arrows depict the direction of transcription. ( B ) Immunoblot showing PBRM1 expression in WT HAP1 cells and a clonal PBRM1 KO HAP1 cell line. PBRM1 mRNA expression in these cells is shown in fig. S13. ( C ) WT (GFP + ) and PBRM1 KO (GFP - ) cells in mixed populations were quantified by flow cytometry after three rounds of passage or TALL-104 treatment. ( D ) Percentage of WT and PBRM1 KO HAP1 cells in the passage control or TALL-104-treated population. Data are presented as mean values ( n = 3). ( E ) Percentage of propidium iodide-positive WT and PBRM1 KO HAP1 cells after treatment with primary human NK cells. ( F ) Mean surface levels of immune regulators on WT and PBRM1 KO HAP1 cells. ( G ) TALL-104 degranulation presented as normalized surface levels of LAMP1 on TALL-104 cells after incubation with target cells. ( H ) NK-92 degranulation presented as normalized surface levels of LAMP1 in NK-92 cells. Data in (E) to (H) are presented as means +- SD ( n = 3). P values were calculated using Student's t test. n.s., P > 0.05. * P < 0.05, ** P < 0.01, *** P < 0.001.

- Submitted by
- Invitrogen Antibodies (provider)
- Main image
- Experimental details
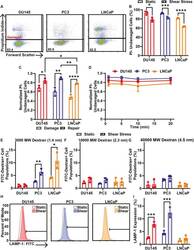
- Fig. 3. Cell membrane repair of cancer cells treated with 10 pulses of elevated FSS. (A) Representative PI flow cytometry scatter plots of membrane damage for DU145, PC3 and LNCaP cells after allowing 20 min of time for cell membrane repair. The percentage of the cell population in the undamaged cell gate (PI negative) is shown for each plot. (B) Average percentage of cancer cells treated with (shear stress) or without (static) 10 pulses of FSS that were undamaged after 20 min of cell membrane repair time. (C) Average proportion of undamaged cells for cell membrane damage measurements taken during FSS (damage) and for cells provided with 20 min of repair time after FSS (repair). (D) Normalized PI-negative (undamaged) cancer cells after different cell membrane repair times, ranging from 1 to 20 min. (E) Uptake of FITC-tagged 3000 MW, (F) 10,000 MW and (G) 40,000 MW dextran by cancer cells treated with or without 10 FSS pulses following 20 min of cell membrane repair. (H) Representative flow cytometry histograms of surface LAMP-1 staining. Horizontal bar indicates the LAMP-1-positive cell gate. (I) Average surface LAMP-1 expression for cancer cells treated with (hatched bars) or without (open bars) 10 pulses of FSS. Data are presented as mean+-s.d. N =3 independent experiments. * P

- Submitted by
- Invitrogen Antibodies (provider)
- Main image
- Experimental details
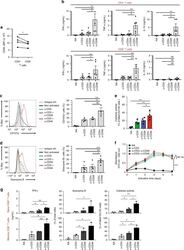
- Fig. 1 CD46 co-stimulation provides superior support for CTL activity. a CD46 expression on the surface of resting human CD4 + and CD8 + T cells assessed by FACS analysis ( n = 4, gating strategy in Supplementary Fig. 7a ). b Comparison of IFN-gamma, TNF-alpha and IL-10 secretion by CD3 + CD46-activated T cells. Purified CD4 + and CD8 + T cells from healthy donors were left non-activated (NA) or stimulated with immobilized antibodies to CD3, CD3 + CD28 or CD3 + CD46 and cytokines measured 60 h post activation ( n = 5). c, d Degranulation (CD107a staining, ( c )) and granzyme B expression ( d ) by CD8 + T cells upon CD46 co-stimulation. CD8 + T cells were stimulated as in ( a ) and CD107a and granzyme B expression assessed with left panels showing representative cytometry images and right panels corresponding quantifications ( n = 3, gating strategy in Supplementary Fig. 7b ). e Killing activity of CD46-activated CD8 + T cells. T cells were stimulated as depicted for 24 h and cytotoxic activity of differently activated CD8 + T cells towards DU145 target cells assessed 24 h post co-culture of T cells and DU145 cells ( n = 4, gating strategy in Supplementary Fig. 7c ). f Effect of CD46 co-stimulation on CD8 + T-cell proliferation. Purified T cells were activated as indicated for 5 days and cell proliferation measured each day ( n = 4) (black circles, non-activated cells; green, blue, and red circles, CD3, CD3 + CD28 or CD3 + CD46-activated cells, res

- Submitted by
- Invitrogen Antibodies (provider)
- Main image

- Experimental details
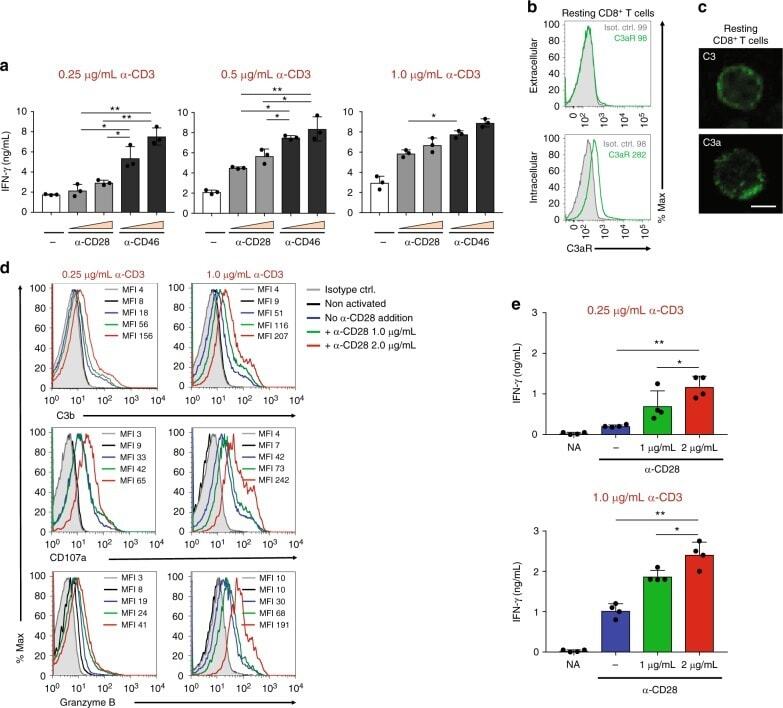
- Fig. 2 Autocrine CD46 engagement supports CTL activation. a Comparison of effects of TCR stimulation as well as CD28 and CD46 co-stimulation on IFN-gamma secretion by CTLs. Purified CD8 + T cells were activated with the depicted antibody combinations (for CD28 and CD46 either 1 mug/mL or 2 mug/mL at all tested CD3 stimulation conditions) for 60 h and IFN-gamma secretion measured ( n = 3). b , c Extracellular and intracellular C3aR, C3, and C3a presence in resting human CD8 + T cells. Freshly purified CD8 + T cells were either left non-permeabilized or were permeabilized and stained with antibodies to the C3aR, to C3 and C3a and evaluated by FACS ( b ) or confocal microscopy ( c , scale bar = 7 mum) for presence and localization of the respective antigens (data shown are one representative of n = 3). d , e Effects of increasing TCR and CD28 activation on C3b generation, CD107a and granzyme B expression and cytokine secretion. CD8 + T cells were left non-activated (NA) or activated with the depicted antibody combinations and C3b surface presence, CD107a and granzyme B positivity ( d , shows a representative FACS analysis of two similarly performed experiments; gray histograms, isotype controls; black histograms, non-activated cells; blue histograms, no CD28 stimulation; green and red histograms, addition of 1 or 2 mug/mL alpha-CD28, respectively) and IFN-gamma production ( e ) measured at 12 h post activation ( n = 3). The gating strategy for CD8 + T cells flow
- Submitted by
- Invitrogen Antibodies (provider)
- Main image

- Experimental details
- Figure 3 High tumor load is associated with increased number of CD8+EOMES high T bet low cells (A, B, C) Frequency of EOMES high Tbet low of PD1+CD8+ T cells. Bone marrow cells were surface stained with anti CD3, CD4, CD8 and PD1 followed by intranuclear staining with anti-Tbet and anti-EOMES, or isotype controls ( Supplementary Figure 4A ). Gates were set on isotype controls. Figure shows % EOMES high Tbet low (A) and Tbet high EOMES low (B) of PD1+CD8+ T cells in patients with low plasma cell percentage (10 % PC). (C) % EOMES high Tbet low and Tbet high EOMES low of PD1 expressing CD8 T cells in patients with high tumor load of 40% and above. (D-G) Cytotoxic activity against autologous myeloma cells. Purified CD8+ T cells from the bone marrow of patients were co-cultured with anti CD3/CD28 beads (D) or purified, autologous myeloma cells (E) or the T cells alone (F). For the last 4 hours of the culture period, anti CD8, PD1 and CD107a or isotype controls were added as described in the Materials and Method section. Figures show the staining of isotype control (dashed lines) and CD107a (solid lines) on one representative sample of three positive ( Supplementary Figure 4C ). (G) Pooled data for cytotoxic activity (% CD107a expression) of CD8+ T cells co-cultured with autologous myeloma cells. (H, I) Proliferation of CD8+PD1+ T cells in response to autologous APCs. CFSE labeled CD3+PD1+ cells from the bone marrow of two myelo

- Submitted by
- Invitrogen Antibodies (provider)
- Main image

- Experimental details
- Figure 5 MAVS genetic variation does not affect intracellular cytokine levels of HIV-1-specific T cells. ( a ) PBMCs of individuals carrying a MAVS minor or MAVS major genotype obtained 2.5-3.5 years p.SC were left unstimulated (-), or were treated with HIV-1 consensus B Gag peptide pool (Gag) or staphylococcal enterotoxin B (SEB). After 6 h, the percentages of surface molecules expressing CD137 + and CD107a + and intracellular expression of IFN-gamma + , IL-2 + , Mip-1beta + , and TNF-alpha + CD4 + T cells and ( b ) CD8 + T cells were analyzed using flow cytometry. Each square or dot represents a different study participant (median +- IQR). No significant differences between HIV-1-infected individuals with a MAVS minor or MAVS major genotype were observed.

- Submitted by
- Invitrogen Antibodies (provider)
- Main image

- Experimental details
- Fig 4 Diminished polyfunctionality of A2/M158+CD8 + T cells in HLA-A2 + /B27 + individuals. ( A ) Representative FACS plots of CD107a, IFN-gamma and TNF responses of day 10 peptide-expanded CD8 + T cell lines from HLA-A2 + /non-B27 and HLA-A2 + /B27 + donors. ( B ) Pie charts representing the average fractions of expanded CD8 + T cells expressing different combinations of CD107a, IFN-gamma and TNF were generated using Pestle v1.8 and SPICE v5.35 software. Arcs represent average frequency of individual cytokines. Exact p -values are calculated using Spice permutation test (10,000) replicates. ( C ) Frequencies of the CD8 + T cell functional response producing different combinations of CD107a, IFN-gamma and TNF. Data (mean+-SEM) are pooled from blood and spleen donors over 2-3 independent experiments (n = 7-8). For each cytokine combination, statistically significant exact p -values are shown for each response ( p
