Explore
 Validate
 Learn
Learn Western blot
Antibody data
- Antibody Data
- Antigen structure
- References [1]
- Comments [0]
- Validations
- Western blot [3]
- Immunocytochemistry [1]
- Other assay [1]
Submit
Validation data
Reference
Comment
Report error
- Product number
- 42-1700 - Provider product page

- Provider
- Invitrogen Antibodies
- Product name
- GDF15 Polyclonal Antibody
- Antibody type
- Polyclonal
- Antigen
- Synthetic peptide
- Reactivity
- Human
- Host
- Rabbit
- Isotype
- IgG
- Vial size
- 100 µg
- Concentration
- 0.25 mg/mL
- Storage
- -20°C
Submitted references GDF15 Is an Eribulin Response Biomarker also Required for Survival of DTP Breast Cancer Cells.
Bellio C, Emperador M, Castellano P, Gris-Oliver A, Canals F, Sánchez-Pla A, Zamora E, Arribas J, Saura C, Serra V, Tabernero J, Littlefield BA, Villanueva J
Cancers 2022 May 23;14(10)
Cancers 2022 May 23;14(10)
No comments: Submit comment
Supportive validation
- Submitted by
- Invitrogen Antibodies (provider)
- Main image
- Experimental details
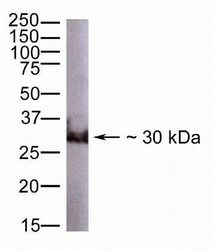
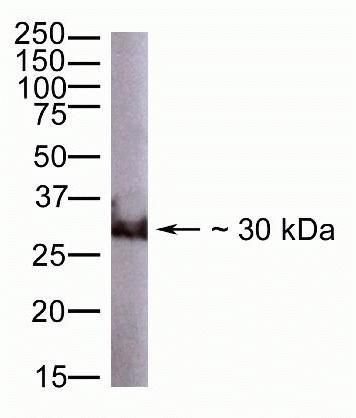
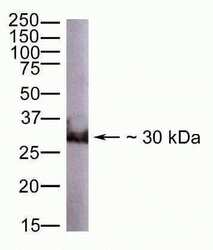
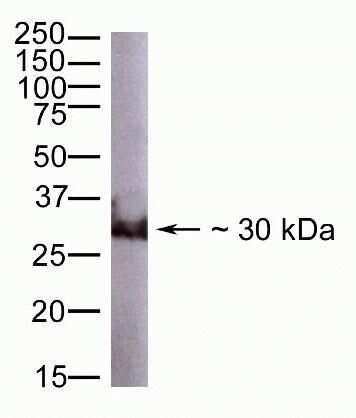
- Western blot analysis of LNCaP.FGC cell lysates using Zymed Rb anti-GDF-15 (Product # 42-1700).
- Submitted by
- Invitrogen Antibodies (provider)
- Main image
- Experimental details
- Western blot analysis of LNCaP.FGC cell lysates using Zymed Rb anti-GDF-15 (Product # 42-1700).
- Submitted by
- Invitrogen Antibodies (provider)
- Main image
- Experimental details
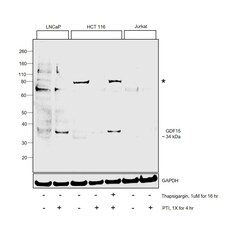
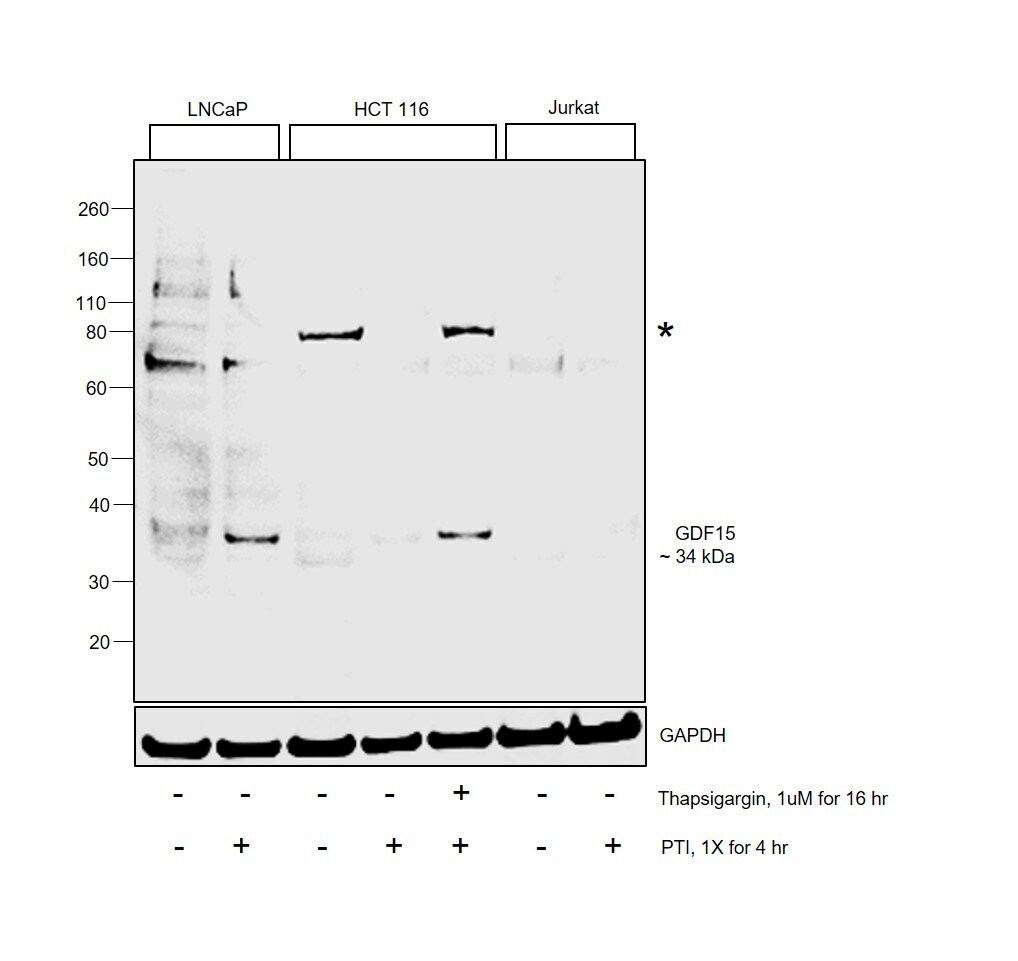
- Western blot was performed using Anti-GDF15 Polyclonal Antibody(Product # 42-1700) and a 34 kDa band corresponding to GDF15 was observed across cell lines tested except Jurkat which is reported to be negative. The expression of protein was also increased upon thapsigargin treatment in HCT 116. Whole cell extracts (50 µg lysate) of LNCaP (Lane 1), LNCaP treated with PTI (1X for 4hr) (Lane 2), HCT 116 (Lane 3), HCT 116 treated with PTI (1X for 4hr) (Lane 4), HCT 116 treated with thapsigargin (1 µM for 16hr) followed by PTI (1X for 4hr) (Lane 5), Jurkat (Lane 6) and Jurkat treated with PTI (1X for 4hr) (Lane 7) were electrophoresed using NuPAGE™ 4-12% Bis-Tris Protein Gel (Product # NP0322BOX). Resolved proteins were then transferred onto a Nitrocellulose membrane (Product # IB23001) by iBlot® 2 Dry Blotting System (Product # IB21001). The blot was probed with the primary antibody (1 µg/mL) and detected by chemiluminescence with Goat anti-Rabbit IgG (H+L) Superclonal™ Recombinant Secondary Antibody, HRP (Product # A27036,1:4000 dilution) using the iBright FL 1000 (Product # A32752). Chemiluminescent detection was performed using Novex® ECL Chemiluminescent Substrate Reagent Kit (Product # WP20005).
Supportive validation
- Submitted by
- Invitrogen Antibodies (provider)
- Main image
- Experimental details
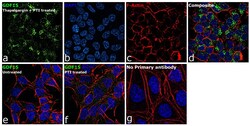
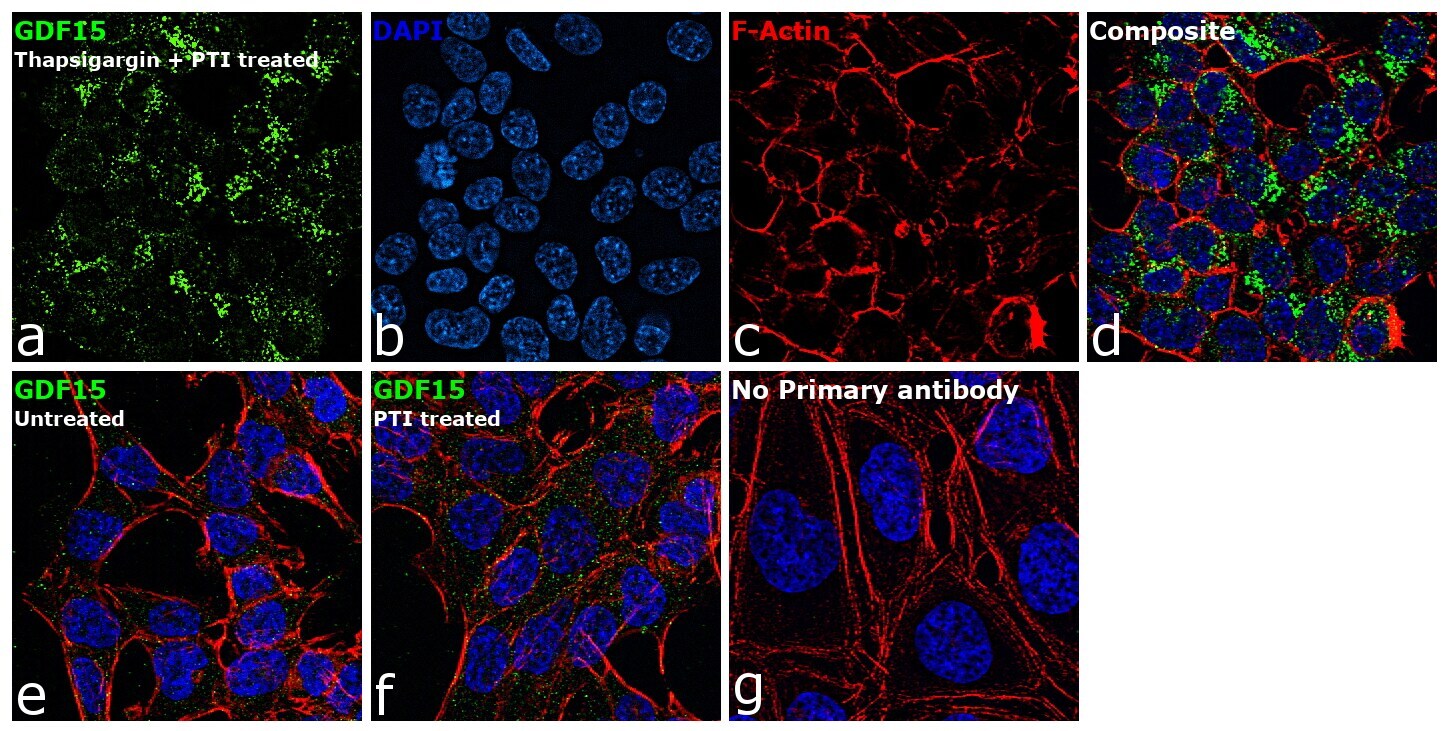
- Immunofluorescence analysis of GDF15 was performed using 70% confluent log phase HCT 116 cells treated with 1 µm of Thapsigargin for 16 hours and PTI. The cells were fixed with 4% paraformaldehyde for 10 minutes, permeabilized with 0.1% Triton™ X-100 for 15 minutes, and blocked with 2% BSA for 45 minutes at room temperature. The cells were labeled with GDF15 Polyclonal Antibody (Product # 42-1700) at 5 µg/mL in 0.1% BSA, incubated at 4 degree celsius overnight and then labeled with Donkey anti-Rabbit IgG (H+L) Highly Cross-Adsorbed Secondary Antibody, Alexa Fluor Plus 488 (Product # A32790), (1:2000), for 45 minutes at room temperature (Panel a: Green). Nuclei (Panel b:Blue) were stained with ProLong™ Diamond Antifade Mountant with DAPI (Product # P36962). F-actin (Panel c: Red) was stained with Rhodamine Phalloidin (Product # R415, 1:300). Panel d represents the merged image showing cytoplasmic(Golgi complex like pattern) localization. Panel e represents untreated cells . Panel f represents cells treated with PTI alone. Panel g represents control cells with no primary antibody to assess background. The images were captured at 60X magnification.
Supportive validation
- Submitted by
- Invitrogen Antibodies (provider)
- Main image

- Experimental details
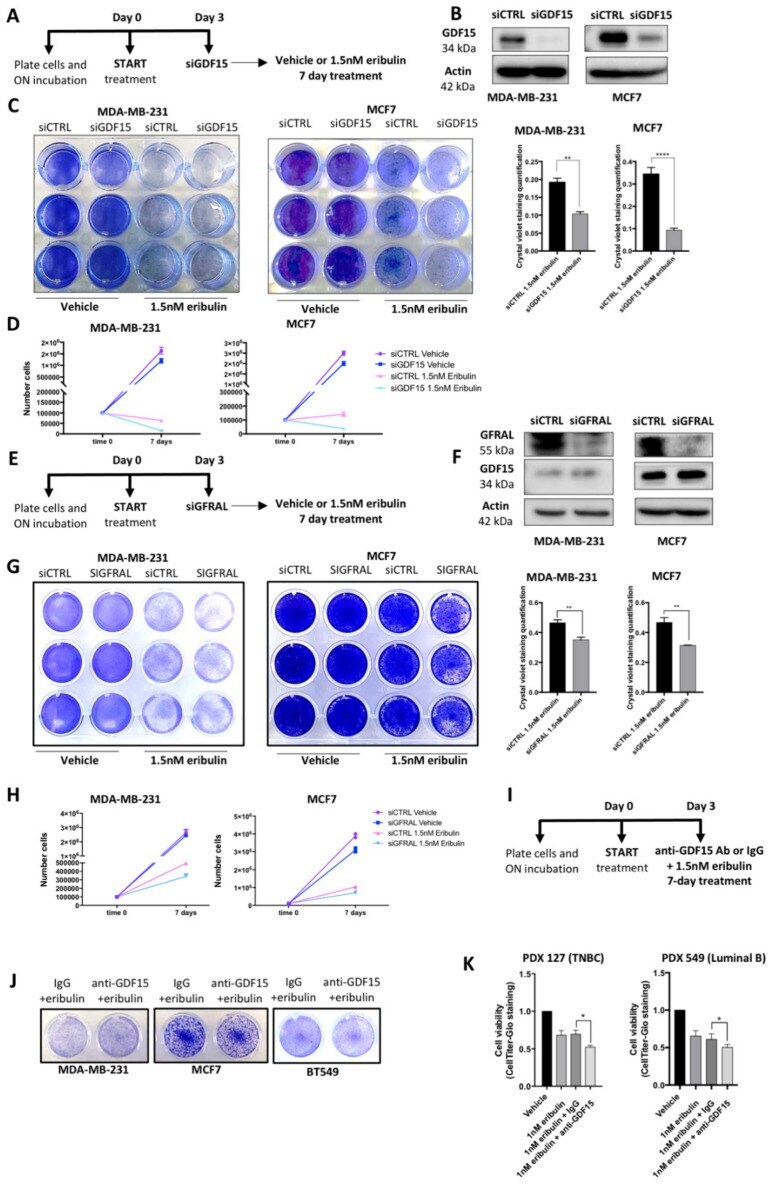
- Figure 5 GDF15 contributes to the maintenance of the DTP state in cells responding to eribulin. ( A ) Schematic representation of siGDF15 experiment and following 7-day eribulin treatment. ( B ) WB analysis of GDF15 protein in siCTRL and siGDF15 cells. Normalization was carried out with Actin as a loading control. ( C ) Representative image of crystal violet staining in siCTRL and siGDF15 cells treated for 7 days with the vehicle and 1.5 nM eribulin treatment. Graphs (right panel) show the quantification of cell viability in siGDF15 cells during eribulin treatment compared with siCTRL cells. ** p -value < 0.01, **** p -value < 0.0001. ( D ) Cell-counting experiment performed in siCTRL and siGDF15 cells after a 7-day vehicle and 1.5 nM eribulin treatment. The graphs show higher sensitivity to eribulin of siGDF15 cells compared with siCTRL cells. The graph for each cell line shows the mean viable cell number +- SD calculated from three independent experiments. ( E ) Schematic representation of siGFRAL experiment and following 7-day eribulin treatment. ( F ) WB analysis of GFRAL and GDF15 protein in siCTRL and siGFRAL cells. Normalization was carried out with Actin as a loading control. ( G ) Representative image of crystal violet staining in siCTRL and siGFRAL cells treated for 7 days with the vehicle and 1.5 nM eribulin treatment. Graphs (right panel) show the quantification of cell viability in siGFRAL cells during eribulin treatment compared with siCTRL cells. ** p -value