Explore
 Validate
 Learn
Learn Western blot
Antibody data
- Antibody Data
- Antigen structure
- References [2]
- Comments [0]
- Validations
- Western blot [1]
- Other assay [6]
Submit
Validation data
Reference
Comment
Report error
- Product number
- PA5-31814 - Provider product page

- Provider
- Invitrogen Antibodies
- Product name
- ZC3H10 Polyclonal Antibody
- Antibody type
- Polyclonal
- Antigen
- Recombinant protein fragment
- Description
- Recommended positive controls: 293T, Jurkat, Raji. Predicted reactivity: Mouse (97%), Rat (96%), Bovine (97%). Store product as a concentrated solution. Centrifuge briefly prior to opening the vial.
- Reactivity
- Human
- Host
- Rabbit
- Isotype
- IgG
- Vial size
- 100 µL
- Concentration
- 0.89 mg/mL
- Storage
- Store at 4°C short term. For long term storage, store at -20°C, avoiding freeze/thaw cycles.
Submitted references Dot1l interacts with Zc3h10 to activate Ucp1 and other thermogenic genes.
Zc3h10 Acts as a Transcription Factor and Is Phosphorylated to Activate the Thermogenic Program.
Yi D, Nguyen HP, Dinh J, Viscarra JA, Xie Y, Lin F, Zhu M, Dempersmier JM, Wang Y, Sul HS
eLife 2020 Oct 27;9
eLife 2020 Oct 27;9
Zc3h10 Acts as a Transcription Factor and Is Phosphorylated to Activate the Thermogenic Program.
Yi D, Dempersmier JM, Nguyen HP, Viscarra JA, Dinh J, Tabuchi C, Wang Y, Sul HS
Cell reports 2019 Nov 26;29(9):2621-2633.e4
Cell reports 2019 Nov 26;29(9):2621-2633.e4
No comments: Submit comment
Supportive validation
- Submitted by
- Invitrogen Antibodies (provider)
- Main image

- Experimental details
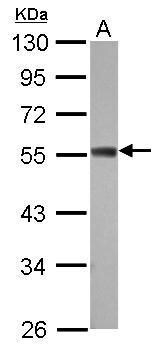
- Western Blot using ZC3H10 Polyclonal Antibody (Product # PA5-31814). Sample (30 µg of whole cell lysate). Lane A: 293T . 10% SDS PAGE. ZC3H10 Polyclonal Antibody (Product # PA5-31814) diluted at 1:1,000.
Supportive validation
- Submitted by
- Invitrogen Antibodies (provider)
- Main image
- Experimental details
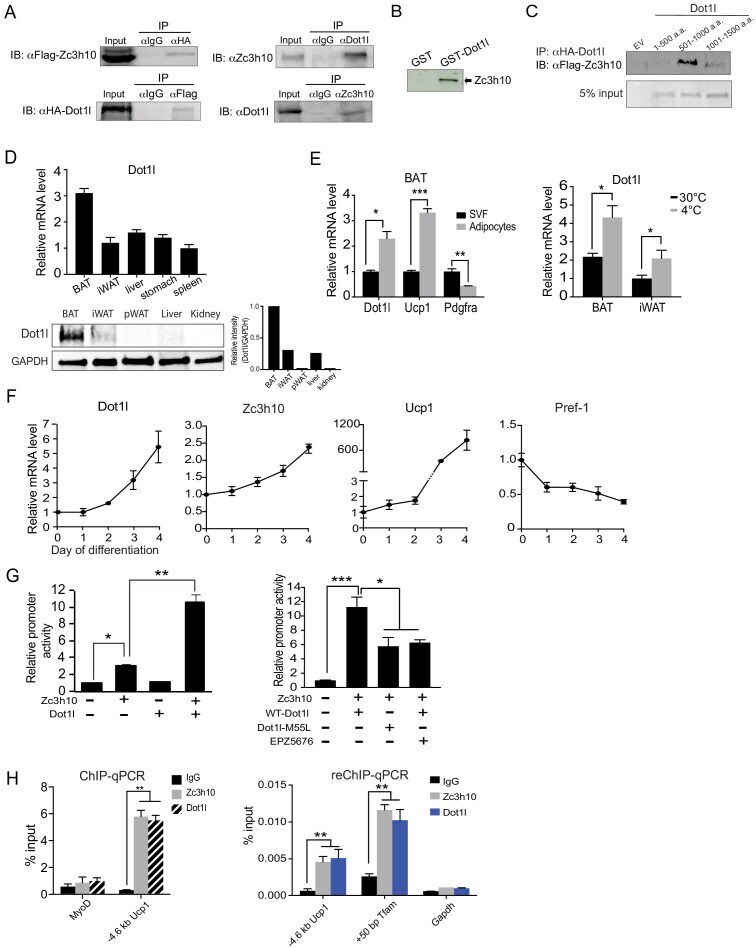
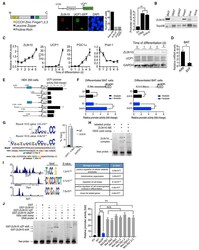
- Figure 1. Dot1l directly interacts with Zc3h10 for its recruitment and activation of BAT gene program. ( A ) (Left) CoIP using alphaFlag for Zc3h10 or alphaHA for Dot1l after immunoprecipitation with either alphaHA- or alphaFlag, respectively, using lysates from HEK293FT cells transfected with Flag- Zc3h10 and HA- Dot1l . (Right) CoIP of endogenous Zc3h10 and Dot1l protein using BAT tissue of C57BL/6 using alphaZc3h10 and alphaDot1l. ( B ) Autoradiograph of GST pull-down using GST-Dot1l and 35 S-labeled in vitro transcribed/translated Zc3h10. ( C ) CoIP using alphaFlag for Zc3h10 after immunoprecipitation with alphaHA for Dot1l using lysates from HEK293FT cells transfected with Flag- Zc3h10 and various HA- Dot1l constructs. ( D ) RT-qPCR and western blot analysis of Dot1l in various tissues from 10-week-old C57BL/6 mice (n = 5). (Bottom right) Quantification of intensity of protein bands, calculated by Dot1l / Gapdh . ( E ) (Left) RT-qPCR for indicated genes in the adipocyte fraction and SVF from BAT. (Right) RT-qPCR for Dot1l mRNA of BAT and iWAT from mice housed at either 30degC or 4degC (n = 5). ( F ) RT-qPCR for indicated genes during the course of BAT cell differentiation. ( G ) (Left) HEK293 cells were cotransfected with the -5.5 kb Ucp1 -Luc promoter with Zc3h10 or Dot1l either together or individually (n = 5). (Right) Luciferase assay with HEK293 cells transfected with M55L- Dot1l or WT- Dot1l with the -5.5 kb Ucp1 -Luc promoter with Zc3h10 . ( H ) (Left) ChIP-qPCR fo
- Submitted by
- Invitrogen Antibodies (provider)
- Main image
- Experimental details
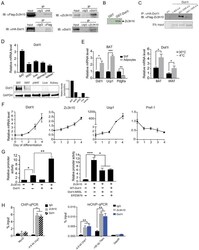
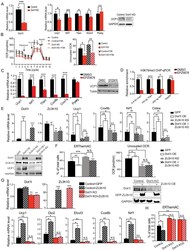
- Figure 2. Dot1l is critical for the thermogenic gene program, and its action is dependent on Zc3h10. ( A ) (Left) RT-qPCR for Dot1l and thermogenic genes in BAT cells infected either scrambled (Control) or adenovirus expressing short hairpin targeting Dot1l (Dot1l KD) after D2 of adipogenic differentiation (n = 6). (Right) Immunoblotting for Ucp1. ( B ) (Left) OCR measured in Dot1l KD cells using Seahorse XF24 analyzer (n = 5). (Right) Uncoupled OCR in BAT cells infected with control or shDot1l under oligomycin (0.5 uM). ( C ) (Left) RT-qPCR for BAT cells treated with Dot1l chemical inhibitor, EPZ5676 (5 nM). (Right) Western blotting analysis for Ucp1 protein. ( D ) ChIP-qPCR for H3K79me3 at indicating genes using chromatin from differentiated BAT cells overexpressing Dot1l and treated with EPZ5676 (n = 5). ( E ) (Top) RT-qPCR for indicated genes and (Bottom) immunoblotting for indicated proteins in differentiated BAT cells that were transduced with either Ad GFP or Ad Dot1l or sh Zc3h10 individually or in combination for overexpression of Dot1l and knockdown of Zc3h10 (n = 6). The differentiated cells were treated with forskolin (10 µM) for 6 hr. ( F ) (Left) FACS analysis and quantification of ERthermAC, that inversely correlates with heat production. (Right) Uncoupled OCR measured in BAT cells by Seahorse assay (n = 5). ( G ) RT-qPCR for indicated genes and immunoblotting for indicated proteins in the control BAT cells or Dot1l -CRISPR KO pool, overexpressing either

- Submitted by
- Invitrogen Antibodies (provider)
- Main image
- Experimental details
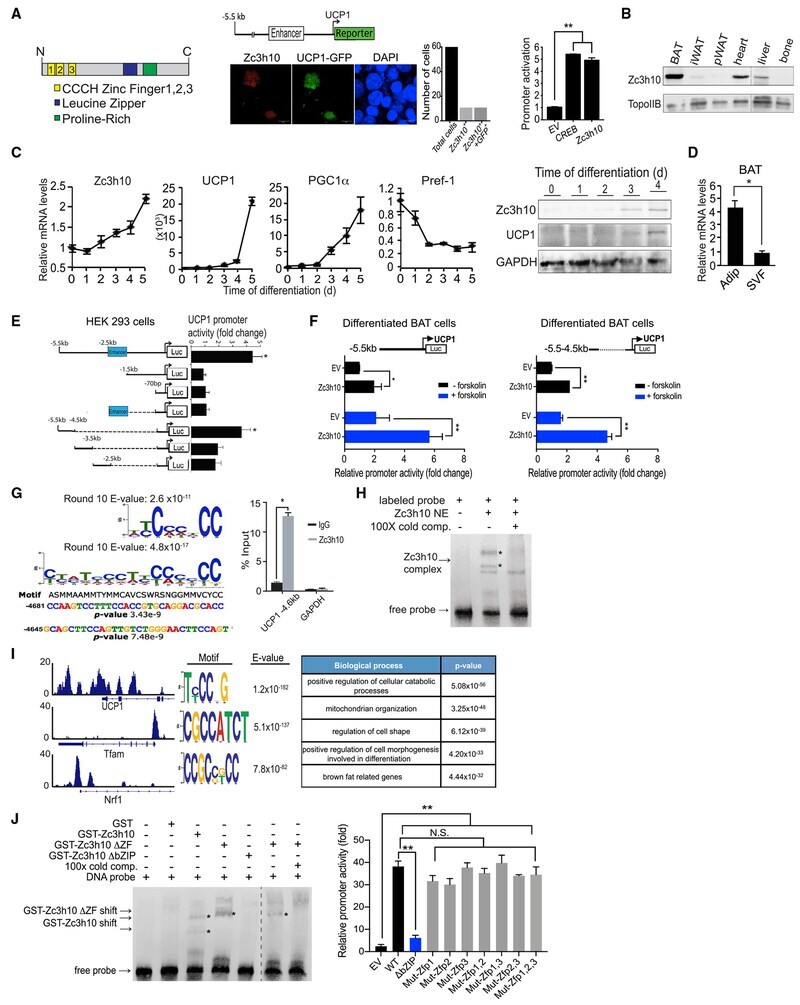
- Figure 1. Zc3h10 Activates the UCP1 Promoter by Binding at a Distal Region (A) (Left) Diagram of Zc3h10 structure. (Middle) Immunofluorescence of HEK293FT cells transfected with Zc3h10 (red) and -5.5 kb UCP1-GFP (green). (Right) Luciferase activity in HEK293FT cells cotransfected with the -5.5 kb UCP1-luc and indicated vector. (B) Western blot analysis of Zc3h10 protein in various tissues from 10-week-old C57BL/6 mice. (C) (Left) qRT-PCR for indicated genes in BAT cells at day 0-5 of differentiation. (Right) Immunoblotting for indicated proteins during BAT cell differentiation. (D) Zc3h10 mRNA levels in the adipocyte fraction and SVF from BAT. (E) Schematic representation of 5' deletion constructs of the UCP1 promoter-Luc. Luciferase activity in HEK293FT cells, co-transfected with Zc3h10. (F) Luciferase activity in differentiated BAT cells -/+ forskolin, cotransfected with indicated plasmids. (G) (Top left) Zc3h10-binding sequences after 10 rounds of SELEX enrichment followed by MEME using 8-mer and 30-mer analysis. (Bottom left) Analysis of the UCP1 promoter using the IUPAC nucleotide for the Zc3h10 binding sites identified by SELEX. (Right) ChIP-qPCR of Zc3h10 at the binding region identified by SELEX using BAT cells. (H) Gel shift assay performed with nuclear extracts of HEK293FT cells transfected with FLAG-Zc3h10 and oligos corresponding to the -4.6 kb UCP1 binding site. (I) (Left) ChIP-seq of Zc3h10 occupancy at the promoters of UCP1, Tfam and Nrf1 in BAT of C57BL/6 mice
- Submitted by
- Invitrogen Antibodies (provider)
- Main image
- Experimental details
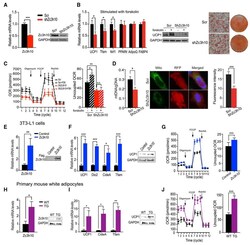
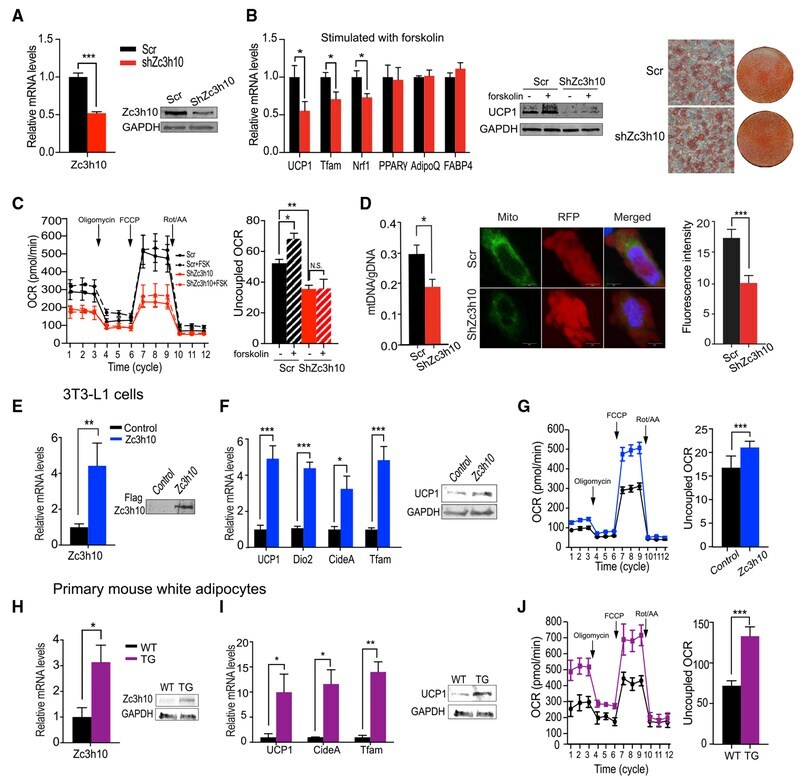
- Figure 2. Zc3h10 Promotes Thermogenic Gene Program In Vitro (A) (Left) qRTqPCR and immunoblotting for Zc3h10KD in BAT cells. (B) (Left) qRT-PCR for indicated genes in forskolin-treated differentiated Zc3h10KD BAT cells (Middle) Immunoblotting for indicated proteins. (Right) ORO staining of BAT cells (20x magnification) at day 5 of differentiation. (C) OCR (pMol/min) measured using Seahorse XF24 analyzer in Zc3h10 KD BAT cells. (D) (Left) Quantification of mitochondria number in Zc3h10KD BAT cells. (Middle) Mitochondria staining and quantification of MitoTraker Green signals in shZc3h10-infected cells (shown in red, n = 30). (E) qRT-PCR/western blot for Zc3h10 in 3T3-L1 cells infected with Zc3h10 adenovirus. (F) qRT-PCR/western blot for indicated genes in 3T3-L1 cells after 6 h of forskolin (10 muM) treatment. (G) OCR (pMol/min) measured in Zc3h10-overexpressing 3T3-L1 cells. (H) qRT-PCR for Zc3h10 in primary white adipocytes differentiated from SVF of WT and AQ-Zc3h10 TG. (I) qRT-PCR/western blot for indicated genes in primary white adipocytes after 6 h of forskolin (10 muM) treatment. (J) OCR measured by Seahorse assay. Data presented as mean +- SEM. *p < 0.05, **p < 0.01, ***p < 0.001.
- Submitted by
- Invitrogen Antibodies (provider)
- Main image
- Experimental details
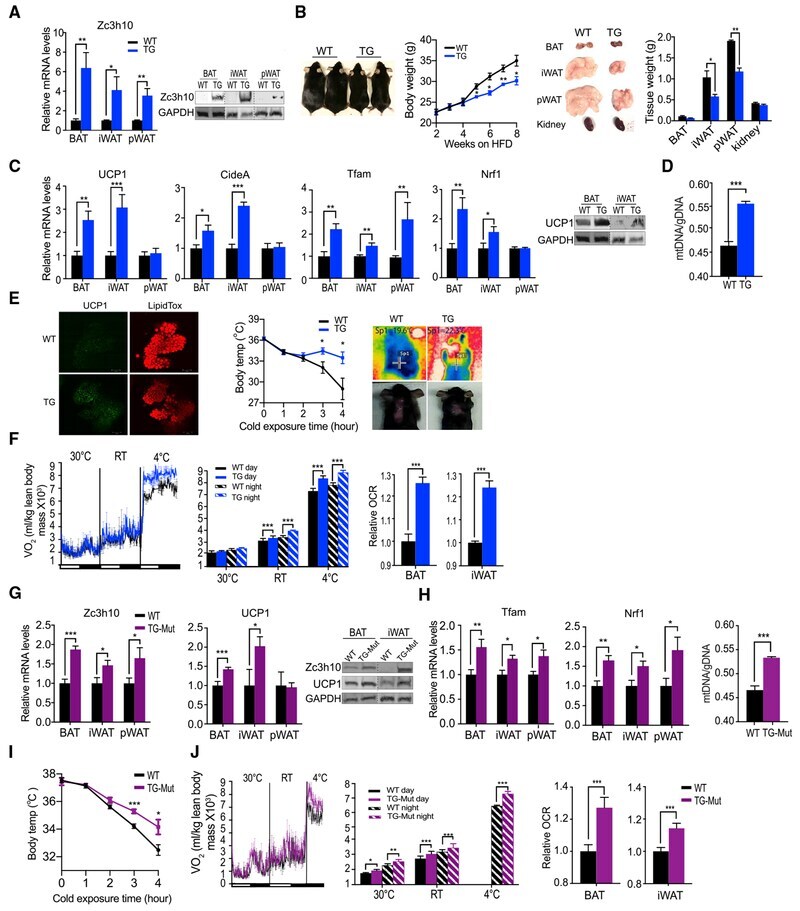
- Figure 3. Overexpression Zc3h10 Promotes BAT Gene Program and Enhances Energy Expenditure, Preventing Diet-Induced Obesity (A) qRT-PCR/immunoblotting for Zc3h10 in adipose depots of WT and AQ-Zc3h10 mice (TG). (B) Representative photograph and body weight of 16-week-old WT and TG mice fed high-fat diet (HFD) for 8 weeks (n = 5-6 mice per group). (C) (Left) qRT-PCR for indicated genes in adipose depots of WT and TG mice housed at RT (n = 5-6 mice per group) (Right) Immunoblotting for UCP1 in BAT and iWAT. (D) Quantification of mitochondria number in BAT (n = 12). (E) (Left) Whole-mount immunostaining for UCP1 (green) and LipidTox staining (red) in BAT of 10-week-old mice. (Middle) Rectal temperature measured in 15-week-old mice at 4degC (n = 6 mice per group). (Right) Infrared thermography of 4-h cold-induced BAT activity; Sp1, temperature of specific area of BAT. (F) (Left, middle) VO 2 assayed in mice, housed at indicated ambient temperatures by indirect calorimetry using CLAMS (n = 5 per group). (Right) OCR measured in BAT and iWAT of mice using Seahorse XF24 Analyzer (n = 5). (G) qRT-PCR/immunoblotting for Zc3h10 and UCP1 in various adipose depots of WT and TG-Mut, overexpressing Zc3h10-mutated RNA-binding domains, ZF1 and ZF2. (H) (Left) qRT-PCR for indicated genes in adipose depots of WT and TG-Mut mice. (Right) Quantification of mitochondria number in BAT of WT and TG-Mut mice. (I) Rectal temperature measured in 15-week-old mutant mice at 4degC at indicated time points
- Submitted by
- Invitrogen Antibodies (provider)
- Main image

- Experimental details
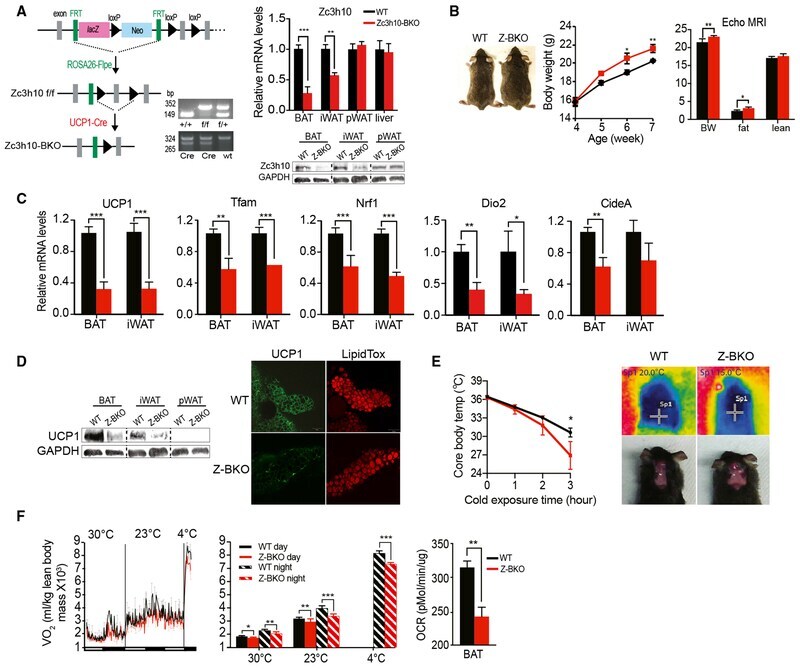
- Figure 4. Zc3h10 Is Required for Full Activation of BAT Gene Program (A) (Left) Schematic diagram of the strategy used to generate BAT-specific Zc3h10 conditional knockout mice. PCR genotyping of the mice: (top) Zc3h10 allele; (bottom) Cre. (Right) qRT-PCR/immunoblotting for Zc3h10 with GAPDH as the loading control in tissues from Zc3h10 f/f (WT) and Zc3h10-BKO mice. (B) Representative photograph of 8-week-old mice and their body weights and body composition. (C) qRT-PCR for indicated genes in BAT/iWAT of mice. (D) (Left) Immunoblotting for UCP1 and the same loading control GAPDH blot in various tissues (n = 5) as Zc3h10 and UCP1 were blotted using the same amount of lysate. (Right) Whole-mount immunostaining of UCP1 (shown in green) and LipidTox (shown in red) staining in BAT of 10-week-old mice (n = 5). (E) (Left) Rectal temperature of 13-week-old mice maintained at 4degC. (Right) Infrared thermography of 4-h cold-induced BAT activity. (F) (Left) VO 2 assayed in WT and Zc3h10-BKO mice on CD using CLAMS. (Right) OCR measured in BAT from mice using Seahorse XF24 (n = 5). Data presented as mean +- SEM. *p < 0.05, **p < 0.01, ***p < 0.001. See also Figure S3 .