 Explore
 Validate
 Learn
Learn Western blot
Antibody data
- Antibody Data
- Antigen structure
- References [2]
- Comments [0]
- Validations
- Western blot [1]
- Immunocytochemistry [1]
- Immunohistochemistry [3]
- Other assay [5]
Submit
Validation data
Reference
Comment
Report error
- Product number
- PA5-59383 - Provider product page

- Provider
- Invitrogen Antibodies
- Product name
- HOMER3 Polyclonal Antibody
- Antibody type
- Polyclonal
- Antigen
- Recombinant full-length protein
- Description
- Immunogen sequence: ALVQTKDQEI QTLKSQTGGP REALEAAERE ETQQKVQDLE TRNAELEHQL RAMERSLEEA RAERERARAE VGRAAQLLDV RLFELSELRE GL
- Concentration
- 0.5 mg/mL
Submitted references A New Mouse Model Related to SCA14 Carrying a Pseudosubstrate Domain Mutation in PKCγ Shows Perturbed Purkinje Cell Maturation and Ataxic Motor Behavior.
Glycoproteomics identifies HOMER3 as a potentially targetable biomarker triggered by hypoxia and glucose deprivation in bladder cancer.
Shimobayashi E, Kapfhammer JP
The Journal of neuroscience : the official journal of the Society for Neuroscience 2021 Mar 3;41(9):2053-2068
The Journal of neuroscience : the official journal of the Society for Neuroscience 2021 Mar 3;41(9):2053-2068
Glycoproteomics identifies HOMER3 as a potentially targetable biomarker triggered by hypoxia and glucose deprivation in bladder cancer.
Peixoto A, Ferreira D, Azevedo R, Freitas R, Fernandes E, Relvas-Santos M, Gaiteiro C, Soares J, Cotton S, Teixeira B, Paulo P, Lima L, Palmeira C, Martins G, Oliveira MJ, Silva AMN, Santos LL, Ferreira JA
Journal of experimental & clinical cancer research : CR 2021 Jun 9;40(1):191
Journal of experimental & clinical cancer research : CR 2021 Jun 9;40(1):191
No comments: Submit comment
Supportive validation
- Submitted by
- Invitrogen Antibodies (provider)
- Main image

- Experimental details
- Western blot analysis of HOMER3 in Lane 1: Marker (kDa) 250, 130, 95, 72, 55, 36, 28, 17, 10; Lane 2: Human cell line RT-4; Lane 3: Human cell line U-251MG sp; Lane 4: Human plasma (IgG/HSA depleted); Lane 5: Human liver tissue.; Lane 6: Human tonsil tissue. tissue. Samples were probed using a HOMER3 Polyclonal Antibody (Product # PA5-59383).

Supportive validation
- Submitted by
- Invitrogen Antibodies (provider)
- Main image

- Experimental details
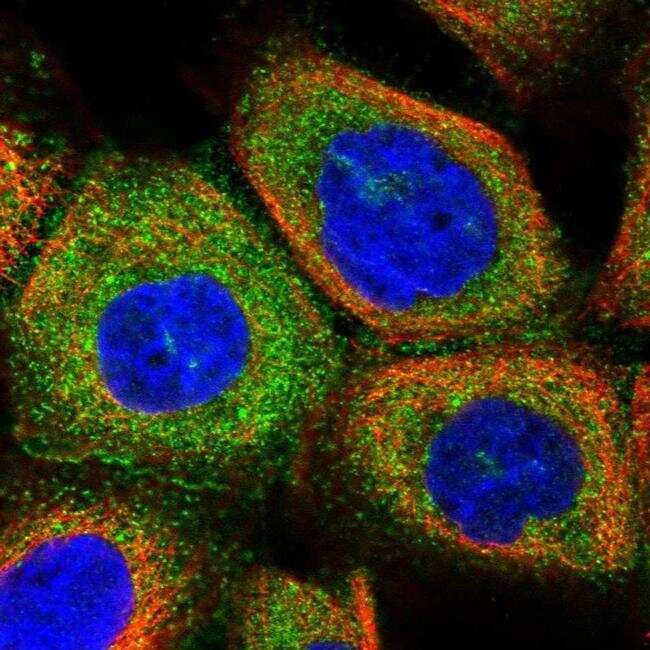
- Immunofluorescent staining of HOMER3 in human cell line A-431 shows positivity in plasma membrane & cytoplasm. Samples were probed using a HOMER3 Polyclonal Antibody (Product # PA5-59383).
Supportive validation
- Submitted by
- Invitrogen Antibodies (provider)
- Main image

- Experimental details
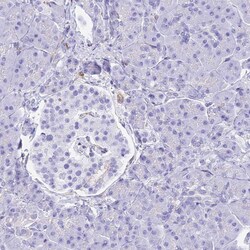
- Immunohistochemical staining of HOMER3 in human spleen and pancreas tissues using HOMER3 Polyclonal Antibody (Product # PA5-59383). Corresponding HOMER3 RNA-seq data are presented for the same tissues.

- Submitted by
- Invitrogen Antibodies (provider)
- Main image

- Experimental details
- Immunohistochemical staining of HOMER3 in human spleen using HOMER3 Polyclonal Antibody (Product # PA5-59383) shows high expression.

- Submitted by
- Invitrogen Antibodies (provider)
- Main image
- Experimental details
- Immunohistochemical staining of HOMER3 in human pancreas using HOMER3 Polyclonal Antibody (Product # PA5-59383) shows low expression as expected.

Supportive validation
- Submitted by
- Invitrogen Antibodies (provider)
- Main image

- Experimental details
- Figure 8. RNA sequence analysis and phosphoproteomics analysis. A , B , Many oxidative phosphorylation-related genes in Complex I, Complex III, Complex IV, and Chemiosmosis are upregulated in Het PKC gamma -A24E mice in RNA sequencing. A , IPA showed that many ubiquinone oxidoreductase subunits and cytochrome c oxidase subunits are significantly upregulated in Het PKC gamma -A24E mice. y axis is log2 fold change. B , Red complexes are upregulated in Het PKC gamma -A24E mice, which locate in the mitochondrial membrane. C , Network analysis was performed by IPA of gene sets upregulated or downregulated in Het PKC gamma -A24E mice compared with Wt littermates. Green genes represent decreases. Red genes represent increases. Many genes related to Purkinje cell morphology are downregulated in Het PKC gamma -A24E mice. D , Volcano plot of phospho-proteomics analysis of Wt versus Homo PKC gamma -A24E mice ( n = 3). Lysates from 7-week-old Wt and PKC gamma -A24E mice were subjected to phosphoproteomic analysis by mass spectrometry. Differentially enriched phosphopeptides are shown in the volcano plot. x axis is log2 fold change, and y axis is p value. Rmdn3 and Homer3 are among the proteins with a significantly increased phosphorylation in PKC gamma -A24E mice. E , RNA sequence data show that Rmdn3 and Homer3 are upregulated in PKC gamma -A24E mice. F , Western blot analysis of Rmdn3 and Homer3 from organotypic slice cultures. Homer3 protein expression (Wt = 100.0%, n = 4; Het = 149.7

- Submitted by
- Invitrogen Antibodies (provider)
- Main image

- Experimental details
- Fig. 3 A ) HOMER3 is expressed by the majority of 5637 and T24 cells (> 90%) showing mostly intracellular origin, whereas a small subpopulation also exhibits HOMER3 at the cell surface (3-5%). The left panel shows the expression of HOMER3 at the cell surface in a small subset of T24 cells (3-5%) and a massive expression of total HOMER3 (> 90% of the cells). The graph histogram at right highlights that 5637 and T24 cells presented the same HOMER3 phenotype. Experiments assessing HOMER3 at the cell surface were conducted in cells showing non-permeabilized membranes and without incorporation of propidium iodide. The analysis of permeabilized cells showed HOMER3 total levels. Results are the average of three independent replicates **** p < 0.0001 (student t-test). B ) Immunofluorescence microscopy for HOMER3 (green) in non-permeabilized and permeabilized cells highlighting HOMER3 at the cell membrane (left panel). C ) Immunofluorescence microscopy for HOMER3 (green) at the cell surface of non-permeabilized cells, as confirmed by a uniform expression of CellMask (orange) and the absence of signal for propidium iodine (red). Propidium iodine staining was used as cell death control for exclusion of cells with compromised plasma membranes (lower panel). In addition to PI, dead T24 cells also stained more intensely for cell mask than live cells due to dye diffusion into the intracellular space. D ) Expression of HOMER3 in whole cell extracts, HOMER3 immunoprecipitates (IP) and corresp

- Submitted by
- Invitrogen Antibodies (provider)
- Main image

- Experimental details
- Fig. 4 Hypoxia and glucose deprivation drive the accumulation of HOMER3 at the cell membrane. A ) Hypoxia and Glucose deprivation significantly increased the number of T24 and 5637 cells expressing HOMER3 at the cell surface. T24 flow cytometry analysis (included in the left panel as a representative example) and graph A (right panel) shows that the vast majority of T24 and 5637 cancer cells express HOMER3, which remains unchanged upon tremendous reduction in oxygen levels and glucose deprivation. On the other hand, this microenvironmental feature promoted a massive increase of cells (approximately 5-fold) showing HOMER3 at the cell surface. B ) Induction of HOMER3 upregulation and downregulation in T24 cells. Blots confirm the development of two HOMER3 knockdown (T24_HOMER3_KD1 and KD2; 30-50% decrease), one knockout model (T24_HOMER3_KO; total HOMER3 abrogation) and an HOMER3 knock-in (T24_HOMER3_KI; 60% increase compared with the control). C ) T24 overexpression is mainly observed at the cell surface after exposure to hypoxia and glucose deprivation. The percentage of cells expressing HOMER3 increases significantly in relation to the controls in both normoxia and hypoxia plus glucose deprivation; however, this increase is more pronounced under microenvironmental pressure. D ) HOMER3 downregulation or deletion leads to a massive decrease in the number of cells expressing the protein in normoxia, irrespectively of the sub-cellular localization, which is not compensated by ex

- Submitted by
- Invitrogen Antibodies (provider)
- Main image

- Experimental details
- Fig. 7 Sialylated HOMER3 glycoforms can be found at the cell-surface of bladder cancer cells and display significant inter-patient structural variability. A ) HOMER3 at the cell membrane co-localizes in the same tumour area with sialylated Tn and T antigens in bladder cancer. According to immunohistochemistry, HOMER3 was diffusely expressed in wide tumour areas, both at the cytoplasm and cell membranes. These areas co-localized with very high STn and/or ST expressions areas. B ) Immunofluorescence microscopy highlighting the co-localization (in white) of HOMER3 (violet) with sialylated Tn and T antigens (green) at the cell membrane of bladder cancer cells. HOMER3 was detected in both cytoplasm and cell membrane of a high number of cancer cells in invasive tumours. The tumours were also screened for the Tn and T antigens and their sialylated counterparts STn and ST. Tumours were negative for neutral glycans but showed high sialospecies, in accordance with immunohistochemistry analysis in panel A. C ) MS/MS HOMER3 glycopeptide with cancer-associated glycans isolated from an invasive bladder tumour. Briefly, invasive tumours showing no Tn and T antigens were elected for this analysis. Glycoproteins were extracted from these tumours and digested with neuraminidase to expose Tn and T antigens derived from their sialylated counterparts. VVA and PNA lectins were then used to pulldown glycoproteins carrying these glycans for downstream analysis by nanoLC-MS/MS. Peptide and glycopepti

- Submitted by
- Invitrogen Antibodies (provider)
- Main image

- Experimental details
- Fig. 8 HOMER3 and STn are not co-expressed at the cell membrane in relevant human healthy tissues (thyroid, liver, gallbladder, testis, lung, stomach, pancreas, colon, small intestine, appendix). HOMER3 was not detected in these tissues, except for few cells in the submucosa of digestive organs as well as in thyroid follicular cells, all of which showing weak/moderate cytoplasmic staining. HOMER3 was also detected in respiratory tract secretions, suggesting potential translocation of the protein to the extracellular space, warranting confirmation in future studies. Moreover, HOMER3 was not found at the cell surface of healthy cells, contracting with observations for cancer cells. The STn antigens could only be found in mucinous secretions of the gastrointestinal and respiratory tracts, being also scarcely observed at the cell surface of cells facing the lumen of these organs. No evidence of co-localization between both antigens could be observed
