Explore
 Validate
 Learn
Learn Western blot
Antibody data
- Antibody Data
- Antigen structure
- References [1]
- Comments [0]
- Validations
- Western blot [1]
- Immunohistochemistry [1]
- Flow cytometry [1]
- Other assay [1]
Submit
Validation data
Reference
Comment
Report error
- Product number
- PA5-23986 - Provider product page

- Provider
- Invitrogen Antibodies
- Product name
- GNAT3 Polyclonal Antibody
- Antibody type
- Polyclonal
- Antigen
- Synthetic peptide
- Reactivity
- Human
- Host
- Rabbit
- Isotype
- IgG
- Vial size
- 400 µL
- Concentration
- 0.4 mg/mL
- Storage
- -20° C, Avoid Freeze/Thaw Cycles
Submitted references TAS2R16 Activation Suppresses LPS-Induced Cytokine Expression in Human Gingival Fibroblasts.
Zhou Z, Xi R, Liu J, Peng X, Zhao L, Zhou X, Li J, Zheng X, Xu X
Frontiers in immunology 2021;12:726546
Frontiers in immunology 2021;12:726546
No comments: Submit comment
Supportive validation
- Submitted by
- Invitrogen Antibodies (provider)
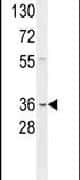
- Main image

- Experimental details
- Western blot analysis using a GNAT3 polyclonal antibody (Product # PA5-23986) in A549 cells lysates (35 µg per lane).
Supportive validation
- Submitted by
- Invitrogen Antibodies (provider)
- Main image
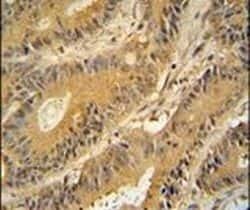
- Experimental details
- Immunohistochemistry analysis in formalin-fixed, paraffin-embedded human colon carcinoma using a GNAT3 polyclonal antibody (Product # PA5-23986), followed by HRP-conjugated secondary antibody and DAB staining.

Supportive validation
- Submitted by
- Invitrogen Antibodies (provider)
- Main image
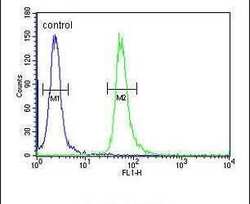
- Experimental details
- Flow cytometry analysis of A549 cells using a GNAT3 polyclonal antibody (Product # PA5-23986) (right) compared to a negative control cell (left) at a dilution of 1:10-50, followed by a FITC-conjugated goat anti-rabbit antibody

Supportive validation
- Submitted by
- Invitrogen Antibodies (provider)
- Main image
- Experimental details
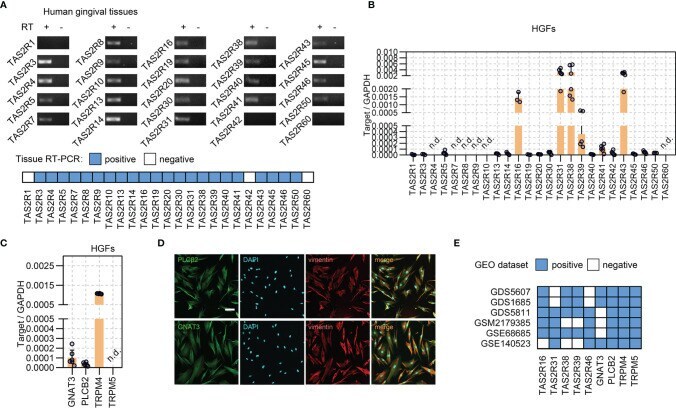
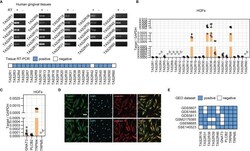
- Figure 1 Expressions of TAS2Rs and downstream signaling components in HGFs. (A) Expression of TAS2Rs in human gingival tissues (pooled from 8 volunteers) examined by RT-PCR. RT +/-: with/without reverse transcription. Expression levels of TAS2Rs (B) and downstream signaling components (C) in primary HGFs determined by qPCR. Data are present as mean +- standard deviation (s.d.). Each circle in the bar represents an individual replicate. n.d., not detected. (D) Immunofluorescence staining of HGFs with vimentin (red) and PLCbeta2 (green), or vimentin (red) and Galpha-Gustducin (green), respectively. Nuclei are stained by DAPI (blue). Scale bar, 100 mum. (E) GEO data analysis for TAS2Rs and key signaling elements expression in HGFs.