Explore
 Validate
 Learn
LearnPA1-16510
antibody from Invitrogen Antibodies
Targeting: EPAS1
bHLHe73, HIF2A, HLF, MOP2, PASD2
 Western blot
 ELISA Immunocytochemistry Immunoprecipitation Immunohistochemistry Flow cytometry Gel shift Chromatin Immunoprecipitation Other assay
Antibody data
- Antibody Data
- Antigen structure
- References [14]
- Comments [0]
- Validations
- Western blot [7]
- Immunocytochemistry [2]
- Immunohistochemistry [3]
- Other assay [17]
Submit
Validation data
Reference
Comment
Report error
- Product number
- PA1-16510 - Provider product page

- Provider
- Invitrogen Antibodies
- Product name
- HIF-2 alpha Polyclonal Antibody
- Antibody type
- Polyclonal
- Antigen
- Synthetic peptide
- Reactivity
- Human, Mouse, Rat, Hamster, Rabbit
- Host
- Rabbit
- Isotype
- IgG
- Vial size
- 100 µL
- Concentration
- 1 mg/mL
- Storage
- -20°C
Submitted references Pharmacologic Inhibition of HIF-1α Attenuates Radiation-Induced Pulmonary Fibrosis in a Preclinical Image Guided Radiation Therapy.
Evaluation of a locked nucleic acid form of antisense oligo targeting HIF-1α in advanced hepatocellular carcinoma.
Myeloid Cell Hypoxia-Inducible Factors Promote Resolution of Inflammation in Experimental Colitis.
SINHCAF/FAM60A and SIN3A specifically repress HIF-2α expression.
Serum and Tissue HIF-2 Alpha Expression in CIN, N-Acetyl Cysteine, and Sildenafil-Treated Rat Models: An Experimental Study.
Tumor-initiating cells of breast and prostate origin show alterations in the expression of genes related to iron metabolism.
CDK-dependent phosphorylation of PHD1 on serine 130 alters its substrate preference in cells.
Epigenetic re-expression of HIF-2α suppresses soft tissue sarcoma growth.
Dose-dependent effects of allopurinol on human foreskin fibroblast cells and human umbilical vein endothelial cells under hypoxia.
Cezanne regulates E2F1-dependent HIF2α expression.
Systemic and Cerebral Vascular Endothelial Growth Factor Levels Increase in Murine Cerebral Malaria along with Increased Calpain and Caspase Activity and Can be Reduced by Erythropoietin Treatment.
PITX1, a specificity determinant in the HIF-1α-mediated transcriptional response to hypoxia.
HIF-mediated metabolic switching in bladder outlet obstruction mitigates the relaxing effect of mitochondrial inhibition.
The chromatin remodeler ISWI regulates the cellular response to hypoxia: role of FIH.
Nam JK, Kim AR, Choi SH, Kim JH, Han SC, Park S, Lee YJ, Kim J, Cho J, Lee HJ, Lee YJ
International journal of radiation oncology, biology, physics 2021 Feb 1;109(2):553-566
International journal of radiation oncology, biology, physics 2021 Feb 1;109(2):553-566
Evaluation of a locked nucleic acid form of antisense oligo targeting HIF-1α in advanced hepatocellular carcinoma.
Wu J, Contratto M, Shanbhogue KP, Manji GA, O'Neil BH, Noonan A, Tudor R, Lee R
World journal of clinical oncology 2019 Mar 24;10(3):149-160
World journal of clinical oncology 2019 Mar 24;10(3):149-160
Myeloid Cell Hypoxia-Inducible Factors Promote Resolution of Inflammation in Experimental Colitis.
Lin N, Shay JES, Xie H, Lee DSM, Skuli N, Tang Q, Zhou Z, Azzam A, Meng H, Wang H, FitzGerald GA, Simon MC
Frontiers in immunology 2018;9:2565
Frontiers in immunology 2018;9:2565
SINHCAF/FAM60A and SIN3A specifically repress HIF-2α expression.
Biddlestone J, Batie M, Bandarra D, Munoz I, Rocha S
The Biochemical journal 2018 Jun 29;475(12):2073-2090
The Biochemical journal 2018 Jun 29;475(12):2073-2090
Serum and Tissue HIF-2 Alpha Expression in CIN, N-Acetyl Cysteine, and Sildenafil-Treated Rat Models: An Experimental Study.
Altintop I, Tatli M, Karakukcu C, Soyer Sarica Z, Hanım Yay A, Balcioglu E, Ozturk A
Medicina (Kaunas, Lithuania) 2018 Jul 30;54(4)
Medicina (Kaunas, Lithuania) 2018 Jul 30;54(4)
Tumor-initiating cells of breast and prostate origin show alterations in the expression of genes related to iron metabolism.
Rychtarcikova Z, Lettlova S, Tomkova V, Korenkova V, Langerova L, Simonova E, Zjablovskaja P, Alberich-Jorda M, Neuzil J, Truksa J
Oncotarget 2017 Jan 24;8(4):6376-6398
Oncotarget 2017 Jan 24;8(4):6376-6398
CDK-dependent phosphorylation of PHD1 on serine 130 alters its substrate preference in cells.
Ortmann B, Bensaddek D, Carvalhal S, Moser SC, Mudie S, Griffis ER, Swedlow JR, Lamond AI, Rocha S
Journal of cell science 2016 Jan 1;129(1):191-205
Journal of cell science 2016 Jan 1;129(1):191-205
Epigenetic re-expression of HIF-2α suppresses soft tissue sarcoma growth.
Nakazawa MS, Eisinger-Mathason TS, Sadri N, Ochocki JD, Gade TP, Amin RK, Simon MC
Nature communications 2016 Feb 3;7:10539
Nature communications 2016 Feb 3;7:10539
Dose-dependent effects of allopurinol on human foreskin fibroblast cells and human umbilical vein endothelial cells under hypoxia.
Sun Y, George J, Rocha S
PloS one 2015;10(4):e0123649
PloS one 2015;10(4):e0123649
Cezanne regulates E2F1-dependent HIF2α expression.
Moniz S, Bandarra D, Biddlestone J, Campbell KJ, Komander D, Bremm A, Rocha S
Journal of cell science 2015 Aug 15;128(16):3082-93
Journal of cell science 2015 Aug 15;128(16):3082-93
Systemic and Cerebral Vascular Endothelial Growth Factor Levels Increase in Murine Cerebral Malaria along with Increased Calpain and Caspase Activity and Can be Reduced by Erythropoietin Treatment.
Hempel C, Hoyer N, Kildemoes A, Jendresen CB, Kurtzhals JA
Frontiers in immunology 2014;5:291
Frontiers in immunology 2014;5:291
PITX1, a specificity determinant in the HIF-1α-mediated transcriptional response to hypoxia.
Mudie S, Bandarra D, Batie M, Biddlestone J, Moniz S, Ortmann B, Shmakova A, Rocha S
Cell cycle (Georgetown, Tex.) 2014;13(24):3878-91
Cell cycle (Georgetown, Tex.) 2014;13(24):3878-91
HIF-mediated metabolic switching in bladder outlet obstruction mitigates the relaxing effect of mitochondrial inhibition.
Ekman M, Uvelius B, Albinsson S, Swärd K
Laboratory investigation; a journal of technical methods and pathology 2014 May;94(5):557-68
Laboratory investigation; a journal of technical methods and pathology 2014 May;94(5):557-68
The chromatin remodeler ISWI regulates the cellular response to hypoxia: role of FIH.
Melvin A, Mudie S, Rocha S
Molecular biology of the cell 2011 Nov;22(21):4171-81
Molecular biology of the cell 2011 Nov;22(21):4171-81
No comments: Submit comment
Supportive validation
- Submitted by
- Invitrogen Antibodies (provider)
- Main image
- Experimental details
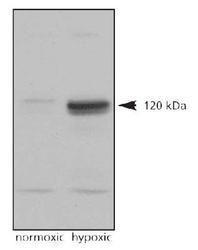
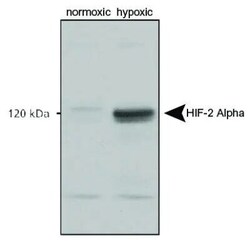
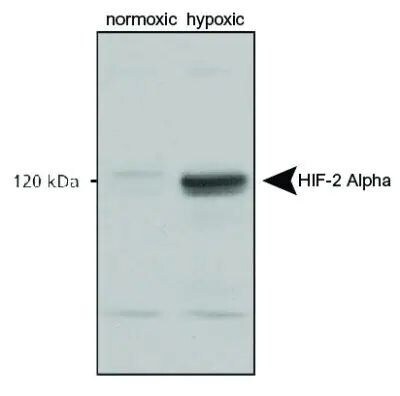
- Western Blot analysis on normoxic and hypoxic nuclear rat cell lysates using Product # PA1-16510, anti-HIF-2 alpha.

- Submitted by
- Invitrogen Antibodies (provider)
- Main image
- Experimental details
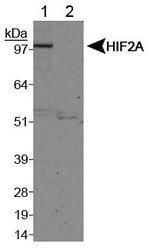
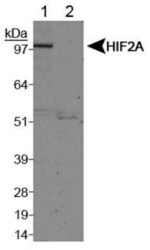
- Western blot analysis of HIF-2 alpha on Lane 1, Cobalt chloride treated COS7 nuclear extracts and Lane 2, Untreated COS7 nuclear extracts using Product # PA1-16510.

- Submitted by
- Invitrogen Antibodies (provider)
- Main image
- Experimental details
- Western blot analysis of HIF-2 alpha in normoxic and hypoxic nuclear rat cell lysates. Sample was incubated in HIF-2 alpha polyclonal antibody (Product # PA1-16510).
- Submitted by
- Invitrogen Antibodies (provider)
- Main image
- Experimental details
- Western blot analysis of HIF-2 alpha in COS7 nuclear extracts. Samples were incubated in HIF-2 alpha polyclonal antibody (Product # PA1-16510). Lane 1: Cobalt chloride treated COS7 nuclear extracts; Lane 2: Untreated COS7 nuclear extracts.

- Submitted by
- Invitrogen Antibodies (provider)
- Main image

- Experimental details
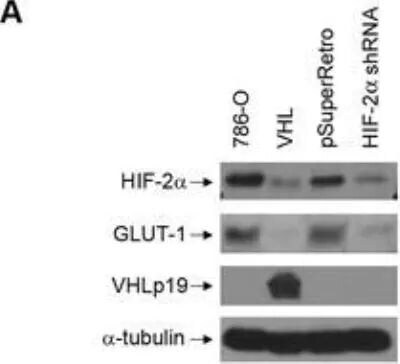
- Knockdown validation by Western blot of HIF-2 alpha in 786-O cells. Samples were incubated in HIF-2 alpha polyclonal antibody (Product # PA1-16510). Reduction of HIF-2alpha levels leads to protection in UV-triggered apoptosis, but not for apoptosis caused by glucose and serum starvation in 786-O cells. Parental 786-O or those either stably expressing wild-type VHLp19 or stably infected with a control vector (pSuperRetro) or a pool of two HIF-2alpha shRNAs vectors [21] were grown to confluence and lysed.
- Submitted by
- Invitrogen Antibodies (provider)
- Main image

- Experimental details
- Western blot analysis of HIF-2 alpha in 0.5 mg/mL Hypoxic HeLa lysate. Samples were incubated in HIF-2 alpha polyclonal antibody (Product # PA1-16510). This experiment was performed under reducing conditions using the 12-230 kDa separation system.

- Submitted by
- Invitrogen Antibodies (provider)
- Main image
- Experimental details
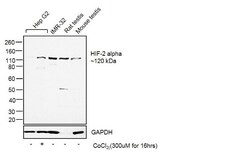
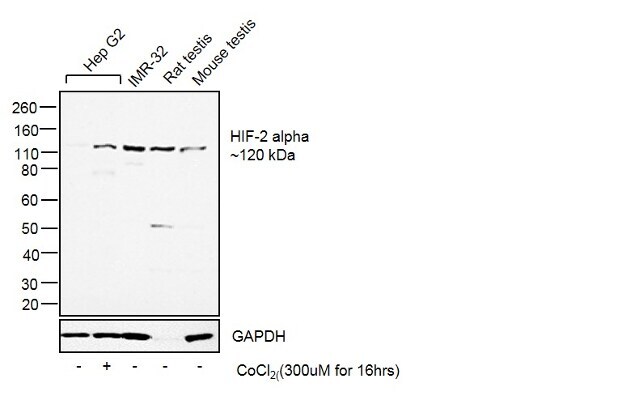
- Western blot was performed using anti-HIF2A-Polyclonal Antibody (Product # PA1-16510) a 120 kDa band was observed corresponding to HIF2A was observed across the cell lines tested and increased upon Cobalt Chloride treatment in Hep G2. Whole cell Extracts of (30ug lysate) of Hep G2 (Lane 1), Hep G2 treated with Cobalt Chloride (300uM for 16hrs) (Lane 2), IMR-32 (Lane 3), tissue extracts of Rat Testis (Lane 4) and Mouse Testis (Lane 5) were electrophoresed using Novex® NuPAGE® 4-12 % Bis-Tris gel (Product # NP0322BOX). Resolved proteins were then transferred onto a nitrocellulose membrane (Product # IB23001) by iBlot® 2 Dry Blotting System (Product # IB21001).The blot was probed with the primary antibody (1µg/mL) and detected by chemiluminescence with Goat anti-Rabbit IgG (H+L) Superclonal™ Recombinant Secondary Antibody, HRP (Product # A27036, 1:4000 dilution) using the iBright FL 1000 (Product # A32752). Chemiluminescent detection was performed using Novex® ECL Chemiluminescent Substrate Reagent Kit (Product # WP20005).
Supportive validation
- Submitted by
- Invitrogen Antibodies (provider)
- Main image

- Experimental details
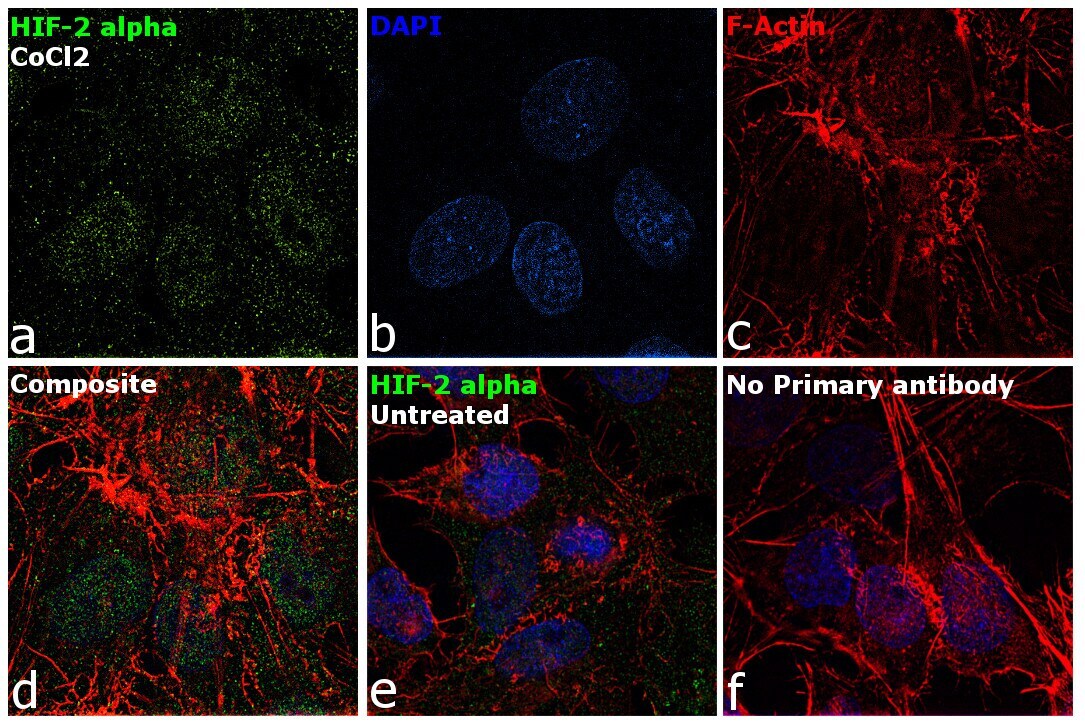
- Immunofluorescence analysis of HIF-2 alpha was performed using HepG2 cells treated with CoCl2 (300uM for 16hrs). The cells were fixed with 4% paraformaldehyde for 10 minutes, permeabilized with 0.1% Triton™ X-100 for 15 minutes, and blocked with 2% BSA for 1 hour at room temperature. The cells were labeled with HIF-2 alpha Rabbit Polyclonal Antibody (Product # PA1-16510) at 1:100 dilution in 0.1% BSA and incubated overnight at 4 degree and then labeled with Donkey anti-Rabbit IgG (H+L) Highly Cross-Adsorbed Secondary Antibody, Alexa Fluor Plus 488 (Product # A32790) at a dilution of 1:2000 for 45 minutes at room temperature (Panel a: green). Nuclei (Panel b: blue) were stained with ProLong™ Diamond Antifade Mountant with DAPI (Product # P36962). F-actin (Panel c: red) was stained with Rhodamine Phalloidin (Product # R415, 1:300). Panel d represents the composite image showing more nuclear and less cytoplasmic localization in Hep G2 cells on treatment with CoCl2. Panel e represents untreated Hep G2 cells showing faint cytoplasmic localization. Panel f represents control cells with no primary antibody to assess background. The images were captured at 60X magnification.
- Submitted by
- Invitrogen Antibodies (provider)
- Main image

- Experimental details
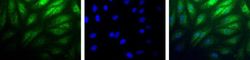
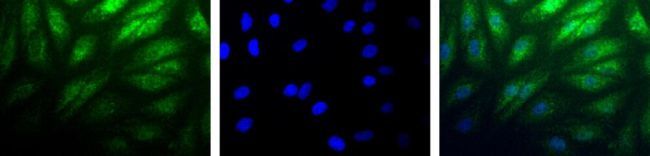
- Immunofluorescence analysis of HIF-2 alpha was performed using 70% confluent log phase MCF7 treated with Cobalt Chloride (150uM for 48hrs). The cells were fixed with 4% paraformaldehyde for 10 minutes, permeabilized with 0.1% Triton™ X-100 for 15 minutes, and blocked with 2% BSA for 45 minutes at room temperature. The cells were labeled with HIF-2 alpha Polyclonal Antibody (Product # PA1-16510) at 1:100 dilution in 0.1% BSA, incubated at 4 degree celsius overnight and then labeled with Donkey anti-Rabbit IgG (H+L) Highly Cross-Adsorbed Secondary Antibody, Alexa Fluor Plus 488 (Product # A32790), (1:2000 dilution), for 45 minutes at room temperature (Panel a: Green). Nuclei (Panel b:Blue) were stained with ProLong™ Diamond Antifade Mountant with DAPI (Product # P36962). F-actin (Panel c: Red) was stained with Rhodamine Phalloidin (Product # R415, 1:300). Panel d represents the merged image showing nuclear translocation of HIF-2 alpha upon cobalt chloride treatment in MCF7 cells. Panel e represents untreated MCF7 cells with no signal. Panel f represents control cells with no primary antibody to assess background. The images were captured at 60X magnification.

Supportive validation
- Submitted by
- Invitrogen Antibodies (provider)
- Main image
- Experimental details
- Detection of HIF-2 Alpha (Green) in RCC4 cells using Product # PA1-16510. Nuclei (Blue) are counterstained with Hoechst 33258.
- Submitted by
- Invitrogen Antibodies (provider)
- Main image
- Experimental details
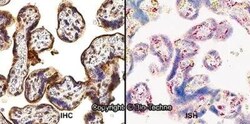
- Immunohistochemical analysis of HIF-2 alpha in formalin-fixed paraffin-embedded tissue sections of human placenta were probed for HIF-2 alpha/EPAS1 mRNA (ACD RNAScope Probe; Fast Red chromogen, ACD). Samples were incubated in HIF-2 alpha polyclonal antibody (Product # PA1-16510) using a dilution of 1:100 dilution with one-hour incubation at room temperature followed by anti-rabbit IgG VisUCyte HRP Polymer Antibody and DAB chromogen (yellow-brown). Tissue was counterstained with hematoxylin (blue). Specific staining was localized to trophoblastic cells.

- Submitted by
- Invitrogen Antibodies (provider)
- Main image

- Experimental details
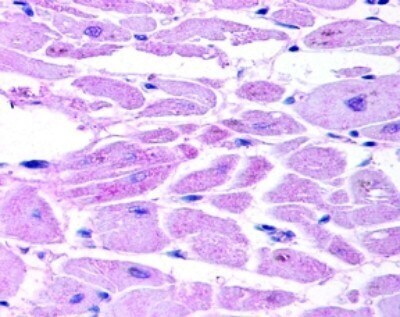
- Immunohistochemical analysis of HIF-2 alpha in human cardiac myocytes. Samples were incubated in HIF-2 alpha polyclonal antibody (Product # PA1-16510).
Supportive validation
- Submitted by
- Invitrogen Antibodies (provider)
- Main image

- Experimental details
- NULL
- Submitted by
- Invitrogen Antibodies (provider)
- Main image

- Experimental details
- NULL
- Submitted by
- Invitrogen Antibodies (provider)
- Main image
- Experimental details
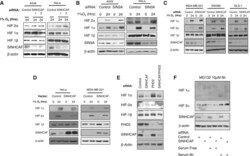
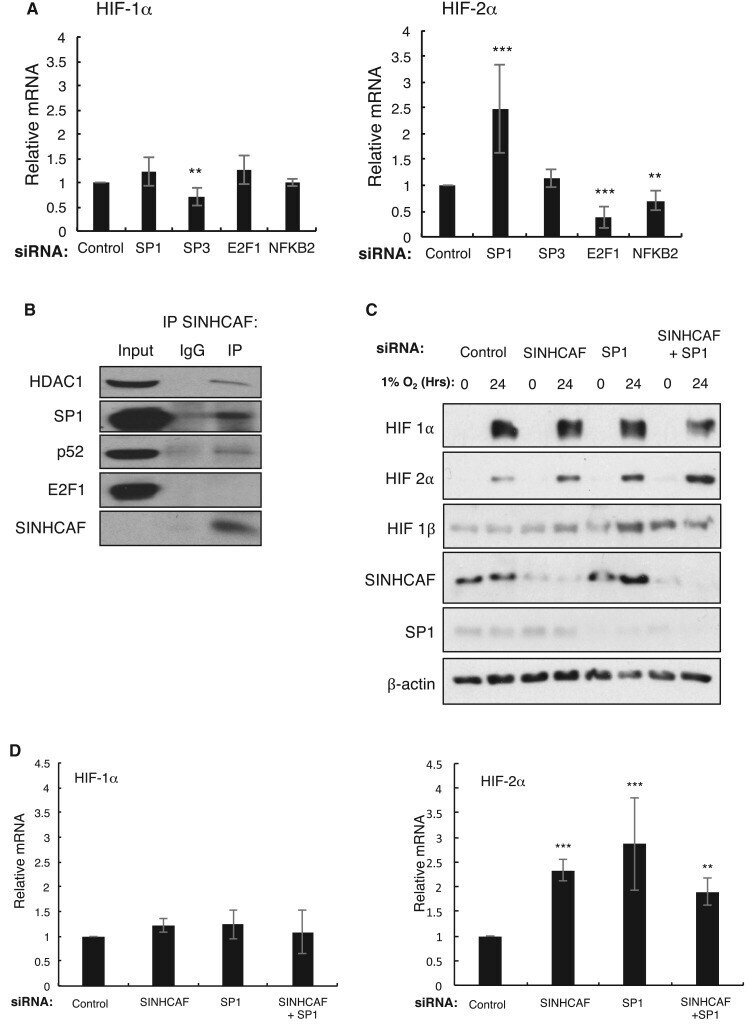
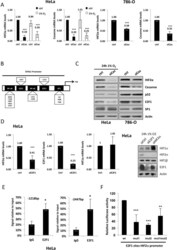
- Figure 2. SINHCAF is a repressor of HIF-2alpha protein in multiple cell lines. ( A ) Control or one of the two SINHCAF [1/2] siRNA oligonucleotides were transfected into A549 and HeLa cells cultured in the presence of hypoxia for 24 h. Lysed samples were analyzed by immunoblot for expression of HIF system isoforms and SINHCAF. ( B ) Control or SIN3A siRNA oligonucleotides were transfected to A549 and HeLa cells cultured in normoxia or hypoxia for 24 h. Lysed samples were analyzed by immunoblot for expression of HIF system isoforms and SIN3A. ( C ) Expression of HIF-2alpha following knockdown of SINHCAF and exposure to hypoxia for 24 h was determined in breast MDA-MB-231 and two colorectal (SW480, DLD-1) cancer cell lines. ( D ) SINHCAF was overexpressed in HeLa and MDA-MB-231 cells with or without exposure to hypoxia for 24 h. Lysed samples were analyzed by immunoblot for expression of HIF system isoforms and SINHCAF. ( E ) Control, SINHCAF, and PHD2 were singly or doubly knocked down in HeLa cells and expression of the HIF system isoforms was determined by immunoblot. ( F ) Control and SINHCAF siRNA oligonucleotides were transfected into HeLa cells. Where indicated, cells were starved or serum for 24 h, or serum-starved and serum-added for the final 6 h prior to harvest. MG132 was added for the final 6 h in all conditions. Representative images from at least three experiments are shown.

- Submitted by
- Invitrogen Antibodies (provider)
- Main image
- Experimental details
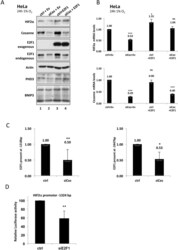
- Figure 3. SINHCAF, but not HDAC1, is a specific repressor of HIF-2alpha promoter. ( A ) HDAC1 or non-targeting siRNA oligonucleotides were transfected to HeLa cells prior to RNA extraction. RNA expression of the HIF-alpha isoforms was determined by qPCR. Graphs depict mean + SEM. * P

- Submitted by
- Invitrogen Antibodies (provider)
- Main image

- Experimental details
- Figure 4. SINHCAF regulates HIF-2alpha expression in cooperation with the sequence-specific transcription factor SP1. ( A ) siRNA knockdown of multiple transcription factors was performed in HeLa cells to examine its effect on basal expression of HIF-alpha. Graphs depict mean + SEM. * P
- Submitted by
- Invitrogen Antibodies (provider)
- Main image
- Experimental details
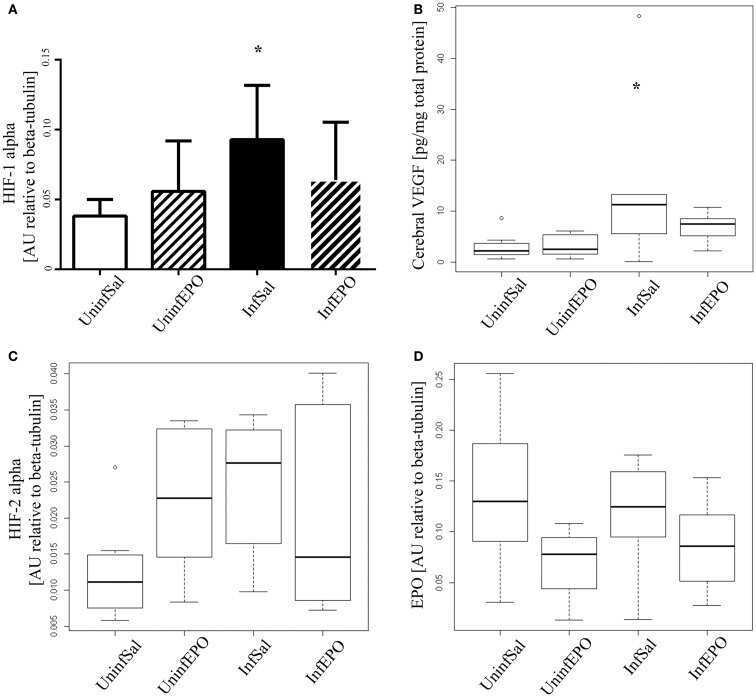
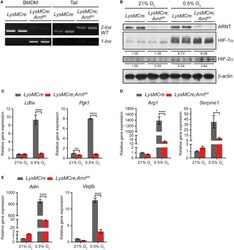
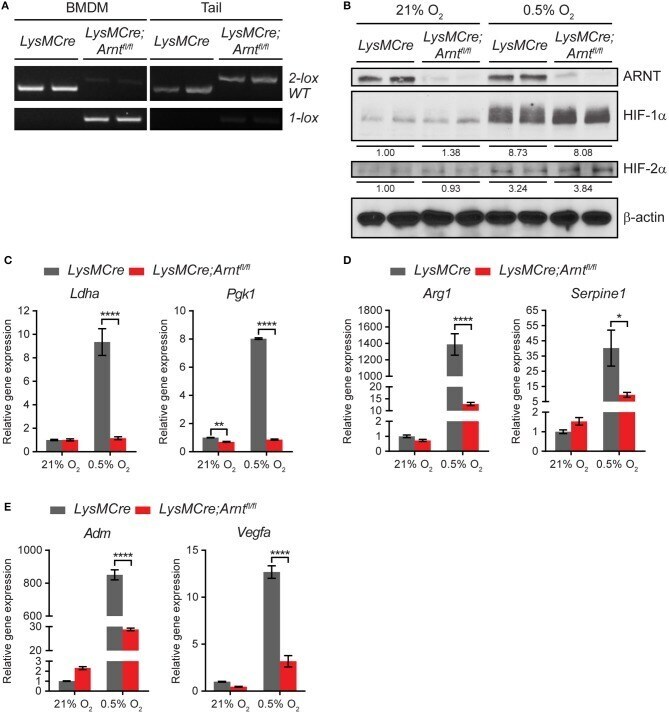
- Figure 1 Arnt deletion in macrophages disrupts both HIF-1alpha and HIF -2alpha transcriptional activity. (A) PCR analysis of genomic DNA prepared from bone marrow-derived macrophages (BMDMs) and tail of LysMCre and LysMCre;Arnt fl / fl mice. The 2 lox band is the floxed allele of Arnt , and the 1 lox band indicates successful Cre-mediated recombination. (B) Western blotting of murine ARNT, HIF-1alpha, and HIF-2alpha in protein lysates prepared from LysMCre and LysMCre;Arnt fl / fl BMDMs cultured under 21% O 2 (normoxia) or 0.5% O 2 (hypoxia) for 24 h. Beta-actin was used as loading control. Densitometry was applied for quantification of HIF-1alpha and HIF-2alpha normalized to beta-actin. The numbers indicate average values of duplicated samples. (C-E) Real-time quantitative PCR (RT-qPCR) analysis of HIF target genes in LysMCre ( n = 3; mean +- s.e.m.) and LysMCre;Arnt fl / fl ( n = 3; mean +- s.e.m.) BMDMs cultured under 21% O 2 or 0.5% O 2 for 24 h. Two-way ANOVA, * p < 0.05, ** p < 0.01, and **** p < 0.0001.
- Submitted by
- Invitrogen Antibodies (provider)
- Main image
- Experimental details
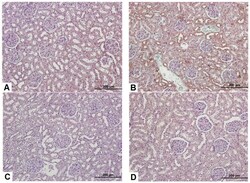
- Figure 5 Immunohistochemistry of HIF2alpha in rat kidney section after modeling for 24 h (200x). ( A ) Control group; ( B ) Model group; ( C ) NAC group; ( D ) Sildenafil group.

- Submitted by
- Invitrogen Antibodies (provider)
- Main image
- Experimental details
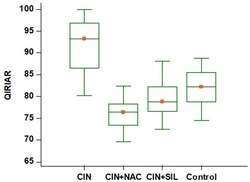
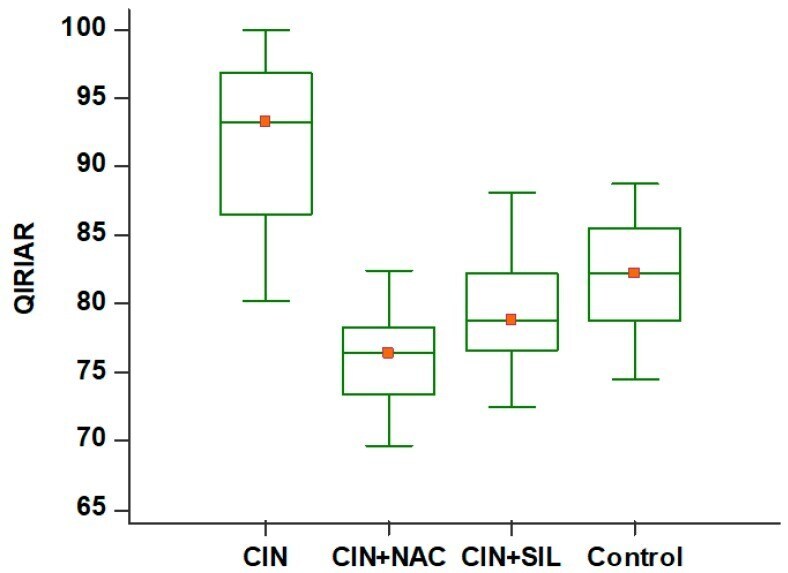
- Figure 6 HIF-2alpha immunostaining in CIN model kidneys of control, CIN, and treated groups. Ratio of HIF-2alpha-positive tubular epithelial cells with immunolocalization staining in rats after modeling. According to the multiple comparison test (post-hoc test: Tukey), all possible dual comparisons were significant ( p < 0.05). QIRIAR: Quantitative immunohistochemistry score.
- Submitted by
- Invitrogen Antibodies (provider)
- Main image

- Experimental details
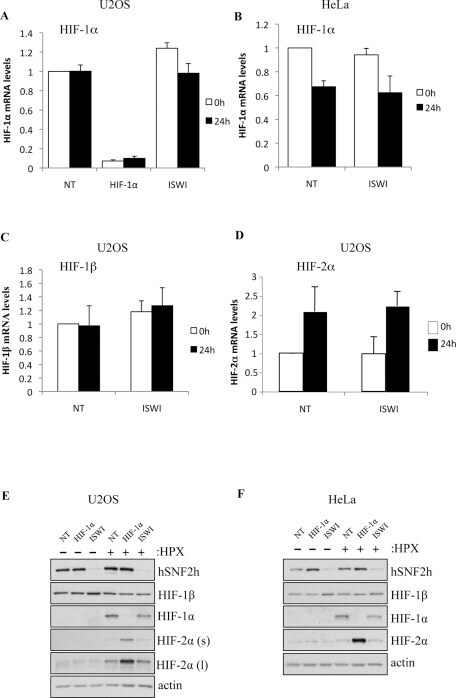
- FIGURE 3: ISWI depletion does not alter HIF mRNA or protein levels. (A) U2OS cells were depleted of HIF-1alpha or ISWI and exposed to 24 h of hypoxia, and HIF-1alpha mRNA was quantified by real-time PCR. Samples were normalized to actin and to NT control. (B) HeLa HIF-1alpha mRNA quantified by real-time PCR after depletion of ISWI by siRNA oligonucleotides. (C) U2OS HIF-1beta mRNA quantified by real-time PCR after depletion of ISWI by siRNA oligonucleotides. (D) as in C, but HIF-2alpha mRNA was measured. Bars represent the average of at least three independent biological replicates, and error bars represent the SE. The p values were calculated using Student's t test (*p < 0.05; **p < 0.01; ***p < 0.001). (E, F) Western blots of U2OS (E) and HeLa (F) whole-cell lysates, showing hSNF2h, HIF-1beta, HIF-1alpha, and HIF-2alpha (l, long exposure; s, short exposure) and actin as a loading control.
- Submitted by
- Invitrogen Antibodies (provider)
- Main image

- Experimental details
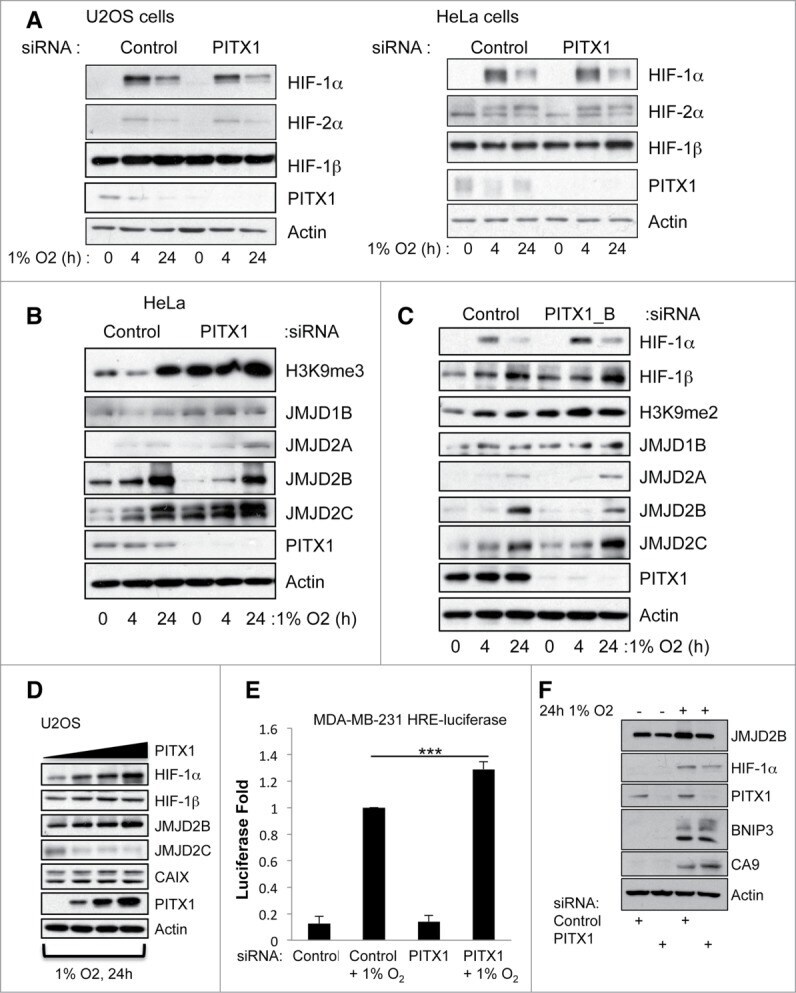
- Figure 2. PITX1 is a specificity determinant for HIF-1a-dependent target gene activation. (A) U2OS and HeLa cells were transfected with control or PITX1 siRNA, prior to treatment with 1% O2 for 24 hours. Whole cell lysates were obtained 48 hours post-transfection and analyzed by protein gel blot using the indicated antibodies. (B) HeLa cells were transfected with control or PITX1 siRNA, prior to treatment with 1% O2 for the indicated periods of time. Whole cell lysates were obtained 48 hours post-transfection and analyzed by western blot using the indicated antibodies. (C) HeLa cells were transfected, processed and analyzed as in B. (D) U2OS were co-transfected with 1 mug of GFP-HIF-1beta and increasing amounts of PITX1 plasmid (0.1, 0.25 and 0.5 mug) prior to exposure to 1% O2 for 24 hours. Whole cell lysates were obtained 48 hours post-transfection and analyzed by protein gel blot using the indicated antibodies. (E) MDA-MB-231-HRE cells were transfected with control and PITX1 siRNA oligonucleotides prior to treatment with 1% O2 for 24 hours. Luciferase activity was measured 48 hours post-transfection. Graph depicts mean and standard deviation of a minimum of 3 independent experiments. Student's t-test was performed to calculate p values, and levels of significance are denoted as follows: * P < 0.05, ** P < 0.01, and *** P < 0.001. (F) MDA-MB-231 cells were transfected with control and PITX1 siRNA oligonucleotides prior to treatment to 1% O2 for 24 hours. Whole cell lys
- Submitted by
- Invitrogen Antibodies (provider)
- Main image
- Experimental details
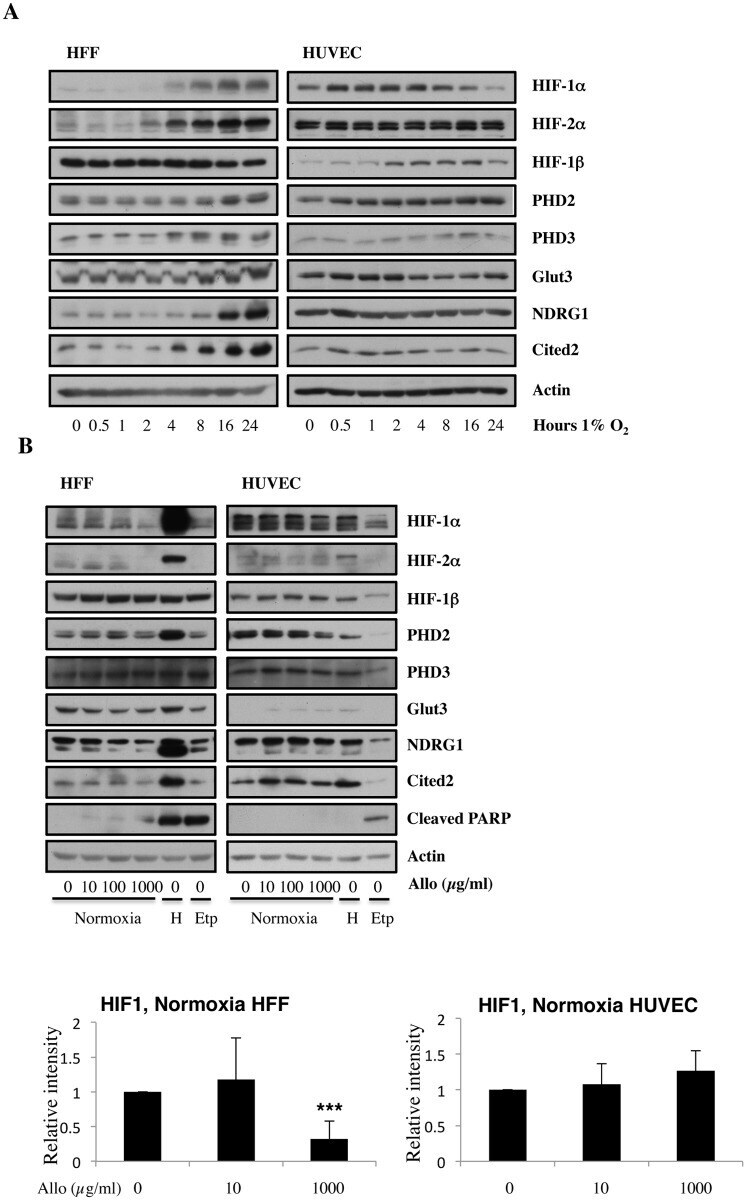
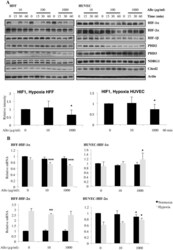
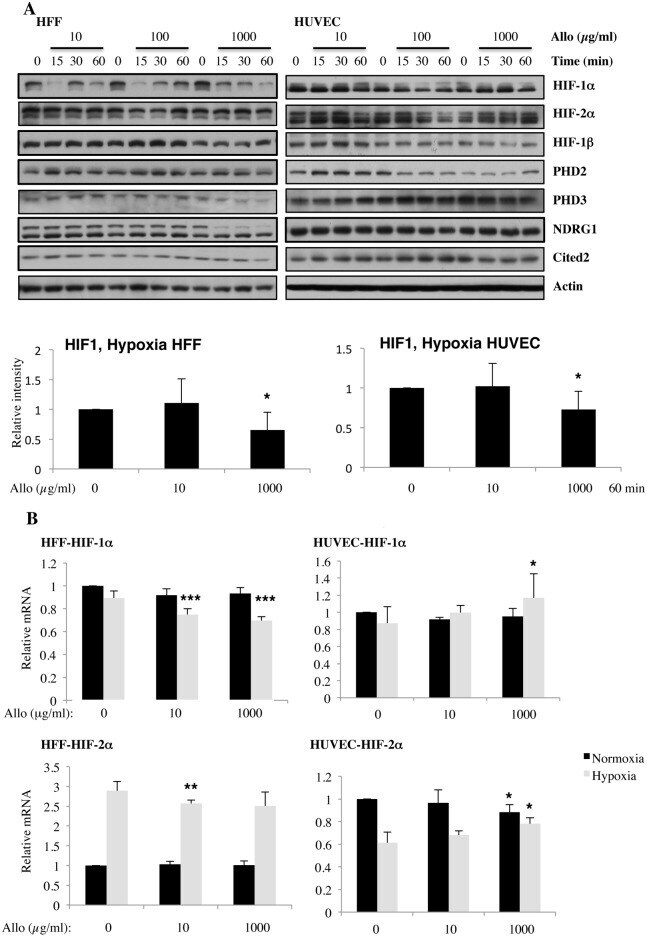
- Fig 2 Increasing doses of Allopurinol reduce HIF-1alpha levels in hypoxic HFFs, without changing HIF mRNA levels but have reduced effect in HUVEC cells. A. Cells were pre-treated with Allopurinol at 10, 100 and 1000 mug/ml for 5, 30 and 60 minutes then were incubated in 1% oxygen for 16 hours. The cells were lysed for assessment of the indicated proteins. HIF-1alpha levels were quantified using ImageJ software and graph depicts mean and standard deviation of a minimum of three independent experiments. Anova t-test was performed and p values calculated as follows: *p
- Submitted by
- Invitrogen Antibodies (provider)
- Main image
- Experimental details
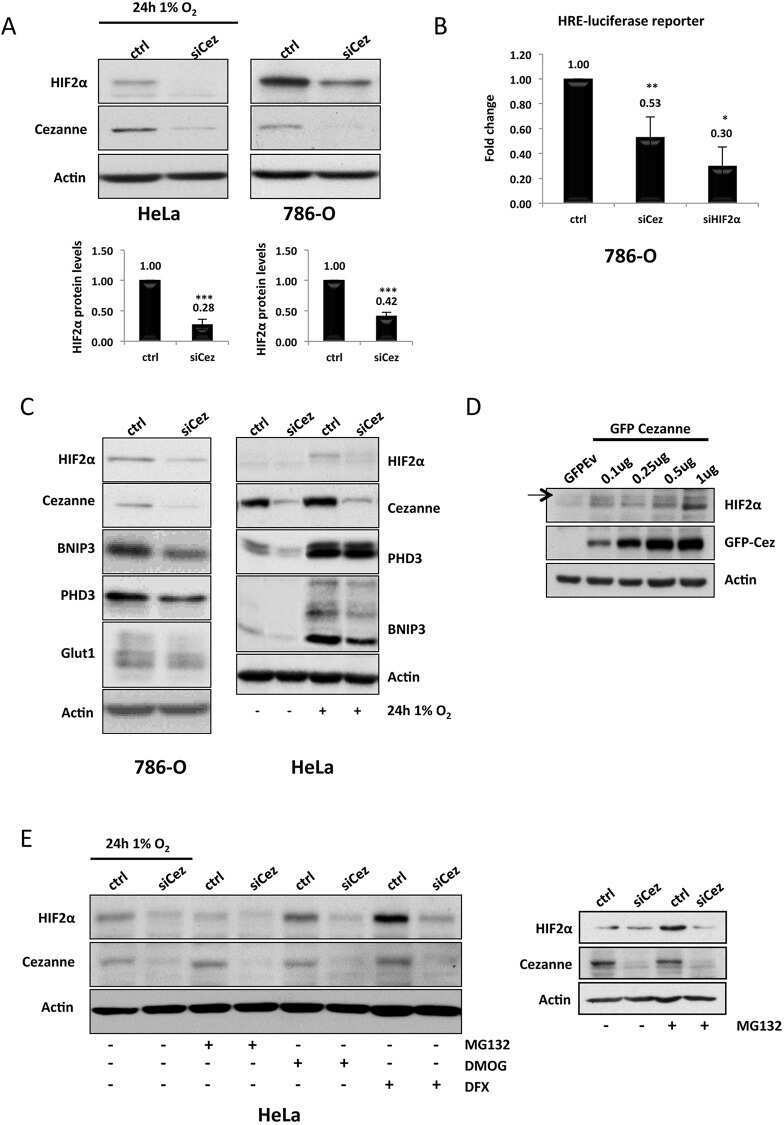
- Fig. 2. Cezanne and E2F1 modulate HIF2alpha expression. (A) HeLa and 786-O cells were transfected with control (ctrl) or Cezanne-targeting siRNAs (siCez), and whole cell lysates were prepared 48 h post-transfection, and total RNA was extracted. RT-qPCR was performed in order to analyse the mRNA levels of HIF2alpha and Cezanne using actin as a normalising gene ( P -values are significant according to the Student's t -test; *** P

- Submitted by
- Invitrogen Antibodies (provider)
- Main image
- Experimental details
- Fig. 3. Overexpression of E2F1 rescues HIF2alpha expression and activity in Cezanne-depleted cells. (A) HeLa cells were co-transfected with 30 nM of either control (ctrl) or Cezanne-targeting siRNA (siCez) plus 1 ug of either empty vector (Ev) or E2F1 expression plasmid. At 24 h after transfection, cells were exposed to 1% O 2 and incubated for a further 24 h. Whole cell lysates were analysed by western blotting with the antibodies indicated. (B) Cells were treated as explained in A, but total RNA was extracted, and the mRNA levels of HIF2alpha and Cezanne were determined by using RT-qPCR ( P -values are significant according to the Student's t -test; ns, not significant, * P

- Submitted by
- Invitrogen Antibodies (provider)
- Main image

- Experimental details
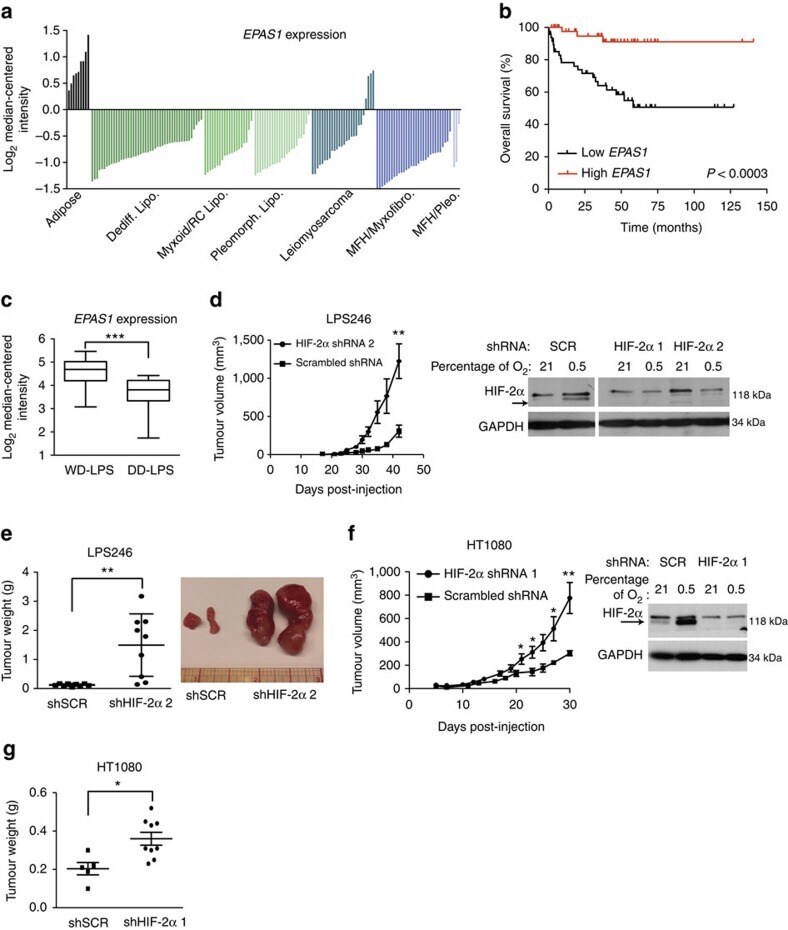
- Figure 2 Loss of HIF-2alpha promotes liposarcoma and fibrosarcoma tumour growth in vivo. ( a ) EPAS1 mRNA expression from Oncomine analysis of the Barretina et al. sarcoma patient samples data set 34 . Values are normalized to median-centered intensity, and shown on a log 2 scale. Dediff. lipo., dedifferentiated liposarcoma; MFH/myxofibro., myxofibrosarcoma; MFH/pleo., UPS; myxoid/RC lipo., myxoid/round cell liposarcoma; pleomprh. lipo., pleomorphic liposarcoma. ( b ) Kaplan-Meier curve of overall survival of liposarcoma patients from the Gobble et al. data set 35 , segregated into the bottom 50% EPAS1 expression (Low EPAS1 , n =47) and top 50% EPAS1 expression (High EPAS1 , n =47). The P -value was calculated using a log-rank (Mantel-Cox) test. ( c ) EPAS1 mRNA expression of well-differentiated liposarcoma (`WD-LPS', n =52) compared with dedifferentiated liposarcoma (`DD-LPS', n =20) patient samples from the Gobble et al. data set. Values are normalized to median-centered intensity, and shown on a log 2 scale. *** P< 0.001. ( d ) Left: tumour volume of LPS246 liposarcoma xenografts with scrambled (SCR; n =9) or HIF-2alpha shRNA ( n =9). Right: immunoblot demonstrating HIF-2alpha knockdown with two independent HIF-2alpha shRNAs compared with SCR shRNA. ** P< 0.01. ( e ) Left: weights of LPS246 xenograft tumours with SCR shRNA (shSCR) or HIF-2alpha shRNA (shHIF-2alpha 2) at time of killing, measured in grams. ** P< 0.01. Right: image of representative LPS246 tumours
- Submitted by
- Invitrogen Antibodies (provider)
- Main image
- Experimental details
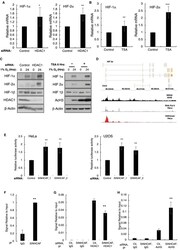
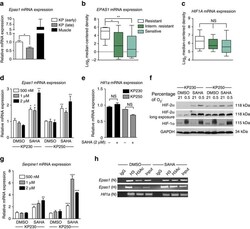
- Figure 4 HDAC inhibition increases HIF-2alpha expression in UPS. ( a ) Epas1 mRNA expression of tumours isolated from KP mice 7 weeks after Ad-Cre injection (early; n =4), 8.5 weeks after Ad-Cre injection (late; n =4), and whole-mouse gastrocnemius muscle from uninjected muscle ( n =3). ( b ) EPAS1 mRNA expression of sarcoma cell lines classified as SAHA resistant (9 cell lines), intermediate resistant (Interm. Resistant; 14 cell lines) and sensitive (12 cell lines) from the Oncomine analysis of Garnett et al. data set 45 . Values are normalized to median-centered intensity, and shown on a log 2 scale. * P< 0.05, ** P< 0.01. ( c ) HIF1A mRNA expression from the Garnett et al. data set (error bars are+-s.e.m.). SAHA resistant, 9 cell lines; Intermediate resistant (Interm. Resistant), 13 cell lines; Sensitive, 12 cell lines. ( d ) Epas1 mRNA expression of KP230 and KP250 mouse UPS cell lines treated with DMSO or SAHA at the indicated drug concentrations. Each bar represents three independent experiments performed in triplicate. * P< 0.05, ** P< 0.01. ( e ) Hif1a mRNA expression of KP230 and KP250 cells treated with DMSO or SAHA (2 muM). Each bar represents three independent experiments performed in triplicate. ( f ) Immunoblot for HIF-1alpha and HIF-2alpha protein in KP230 and KP250 cells treated with DMSO or SAHA (2 muM), grown under 21% O 2 or 0.5% O 2 conditions. ( g ) Serpine1 mRNA expression of KP230 and KP250 cells treated with DMSO or SAHA at the indicated drug concentra

- Submitted by
- Invitrogen Antibodies (provider)
- Main image

- Experimental details
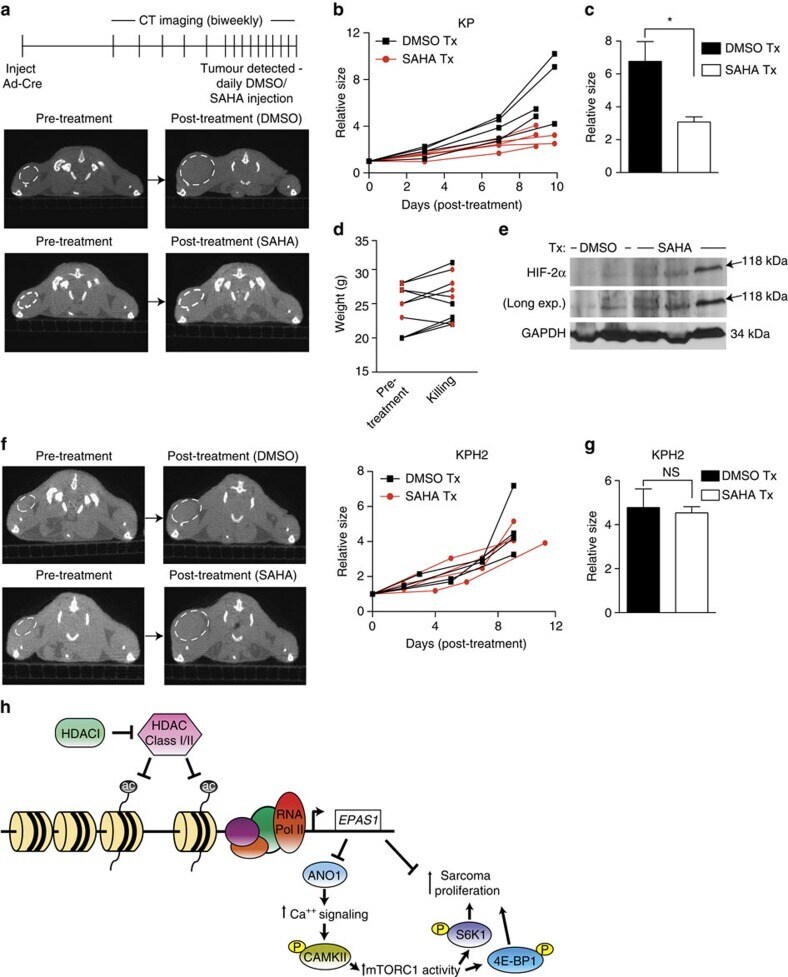
- Figure 6 HIF-2alpha expression is required for SAHA's efficacy in an autochthonous UPS model. ( a ) Top: schematic of tracking autochthonous KP tumour growth in DMSO- and SAHA-treated mice. After Ad-Cre injection, mice were imaged bi-weekly until tumours were detectable and measured ~50-100 mm 3 . Mice were randomized to DMSO control ( n =5) or SAHA ( n =5; 50 mg kg -1 per day) treatments, and tumour growth was followed by bi-weekly CT scans. Bottom: representative axial CT images of KP mice pre- and post-treatment with DMSO or SAHA. Dashed white line demarcates the tumour boundary. ( b ) Relative sizes of individual tumours from KP mice receiving DMSO or SAHA treatment. ( c ) Comparison of the relative sizes of all DMSO- and SAHA-treated KP tumours at the time of killing (error bars are+-s.e.m.). * P< 0.05. P- values were calculated from a two-tailed Student's t -test. ( d ) Weights of KP mice pre-treatment and at time of killing (error bars are+-s.e.m.). Black squares, DMSO-treated mice; red circles, SAHA-treated mice. ( e ) Immunoblot of HIF-2alpha protein in KP autochthonous tumours from DMSO- and SAHA-treated mice. GAPDH served as loading control. ( f ) Left: representative transverse CT images of KPH2 mice pre- and post-treatment with DMSO or SAHA. Mice were treated and imaged as described in a . Right: relative sizes of individual tumours from KPH2 mice receiving DMSO ( n =4) or SAHA ( n =5) treatment. ( g ) Comparison of the relative sizes of all DMSO- and S
- Submitted by
- Invitrogen Antibodies (provider)
- Main image

- Experimental details
- Fig 1 Increasing doses of Allopurinol reduce HIF-1alpha levels in normoxic HFFs and HUVEC cells. A. Characterisation of HFF and HUVEC response to hypoxia. Cells were exposed to hypoxia (1% oxygen) for the indicated periods of time. At the end of incubation, protein levels were determined in whole cell extracts by immunoblot analysis using the depicted antibodies. B. Cells were treated with Allopurinol at 10, 100 and 1000 mug/ml for 17 hours. Then the cells were lysed for assessment of the indicated protein levels. Cells were treated with Etoposide (Etop) for 24 hours under normoxia. H-cells exposed to 1% O2 for 16 hours. HIF-1alpha levels were quantified using ImageJ software and graph depicts mean and standard deviation of a minimum of three independent experiments. Anova t-test was performed and p values calculated as follows: *p