Explore
 Validate
 Learn
Learn Western blot
Antibody data
- Antibody Data
- Antigen structure
- References [1]
- Comments [0]
- Validations
- Western blot [4]
- Immunocytochemistry [2]
- Other assay [1]
Submit
Validation data
Reference
Comment
Report error
- Product number
- PA5-27346 - Provider product page

- Provider
- Invitrogen Antibodies
- Product name
- LIPA Polyclonal Antibody
- Antibody type
- Polyclonal
- Antigen
- Recombinant protein fragment
- Description
- Recommended positive controls: A431, HeLa, A549, H1299, HCT116, Mouse liver. Predicted reactivity: Pig (83%), Rhesus Monkey (98%). Store product as a concentrated solution. Centrifuge briefly prior to opening the vial.
- Reactivity
- Human, Mouse
- Host
- Rabbit
- Isotype
- IgG
- Vial size
- 100 µL
- Concentration
- 1.57 mg/mL
- Storage
- Store at 4°C short term. For long term storage, store at -20°C, avoiding freeze/thaw cycles.
Submitted references PI3Kδ coordinates transcriptional, chromatin, and metabolic changes to promote effector CD8(+) T cells at the expense of central memory.
Cannons JL, Villarino AV, Kapnick SM, Preite S, Shih HY, Gomez-Rodriguez J, Kaul Z, Shibata H, Reilley JM, Huang B, Handon R, McBain IT, Gossa S, Wu T, Su HC, McGavern DB, O'Shea JJ, McGuire PJ, Uzel G, Schwartzberg PL
Cell reports 2021 Oct 12;37(2):109804
Cell reports 2021 Oct 12;37(2):109804
No comments: Submit comment
Supportive validation
- Submitted by
- Invitrogen Antibodies (provider)
- Main image

- Experimental details
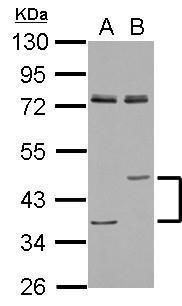
- Western blot analysis of LAL using 30 µg of A) A549 and B) H1299 lysate. Samples were loaded onto a 10% SDS-PAGE gel and probed with a LAL polyclonal antibody (Product # PA5-27346) at a dilution of 1:1000.
- Submitted by
- Invitrogen Antibodies (provider)
- Main image

- Experimental details
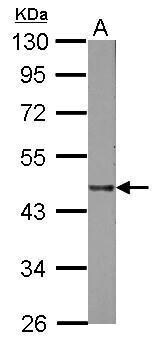
- Western Blot using LIPA Polyclonal Antibody (Product # PA5-27346). Sample (50 µg of whole cell lysate). Lane A: mouse Liver. 10% SDS PAGE. LIPA Polyclonal Antibody (Product # PA5-27346) diluted at 1:1,000. The HRP-conjugated anti-rabbit IgG antibody was used to detect the primary antibody.
- Submitted by
- Invitrogen Antibodies (provider)
- Main image
- Experimental details
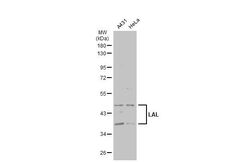
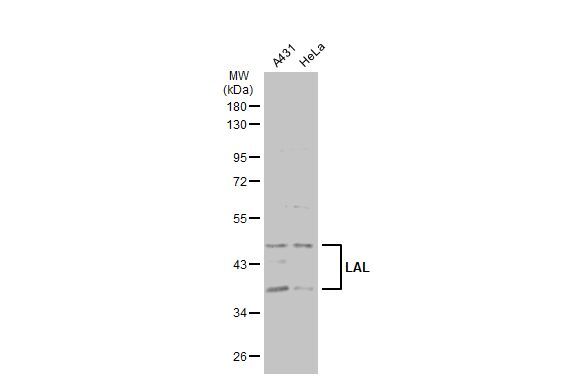
- Western Blot using LIPA Polyclonal Antibody (Product # PA5-27346). Various whole cell extracts (30 µg) were separated by 10% SDS-PAGE, and the membrane was blotted with LIPA Polyclonal Antibody (Product # PA5-27346) diluted at 1:1,000. The HRP-conjugated anti-rabbit IgG antibody was used to detect the primary antibody.
- Submitted by
- Invitrogen Antibodies (provider)
- Main image
- Experimental details
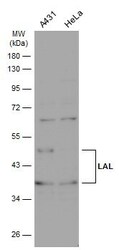
- Western Blot analysis of LIPA was performed by separating 30 µg of various whole cell extracts by 10% SDS-PAGE. Proteins were transferred to a membrane and probed with a LIPA Polyclonal Antibody (Product # PA5-27346) at a dilution of 1:1000 and a HRP-conjugated anti-rabbit IgG secondary antibody.

Supportive validation
- Submitted by
- Invitrogen Antibodies (provider)
- Main image
- Experimental details
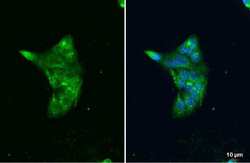
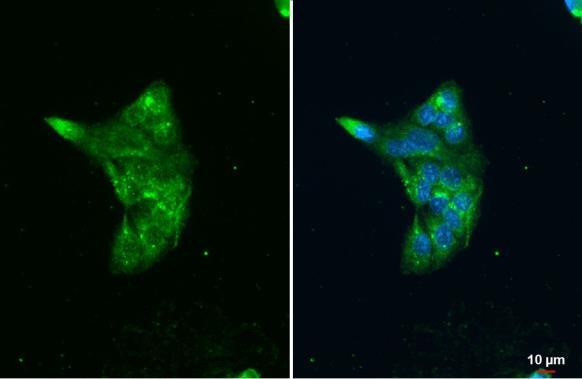
- LIPA Polyclonal Antibody detects LAL protein at lysosome by immunofluorescent analysis. Sample: HepG2 cells were fixed in ice-cold MeOH for 5 min. Green: LAL stained by LIPA Polyclonal Antibody (Product # PA5-27346) diluted at 1:500. Blue: Fluoroshield with DAPI .
- Submitted by
- Invitrogen Antibodies (provider)
- Main image

- Experimental details
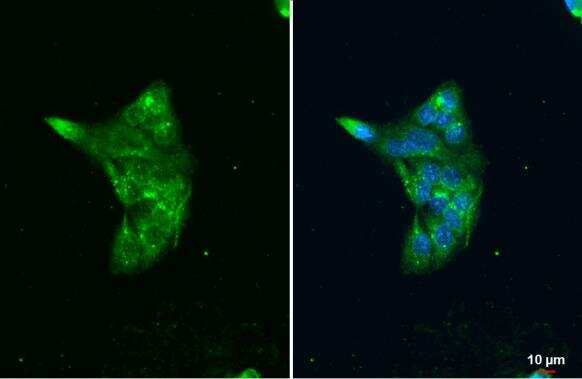
- LIPA Polyclonal Antibody detects LAL protein at lysosome by immunofluorescent analysis. Sample: HepG2 cells were fixed in ice-cold MeOH for 5 min. Green: LAL stained by LIPA Polyclonal Antibody (Product # PA5-27346) diluted at 1:500. Blue: Fluoroshield with DAPI .
Supportive validation
- Submitted by
- Invitrogen Antibodies (provider)
- Main image
- Experimental details
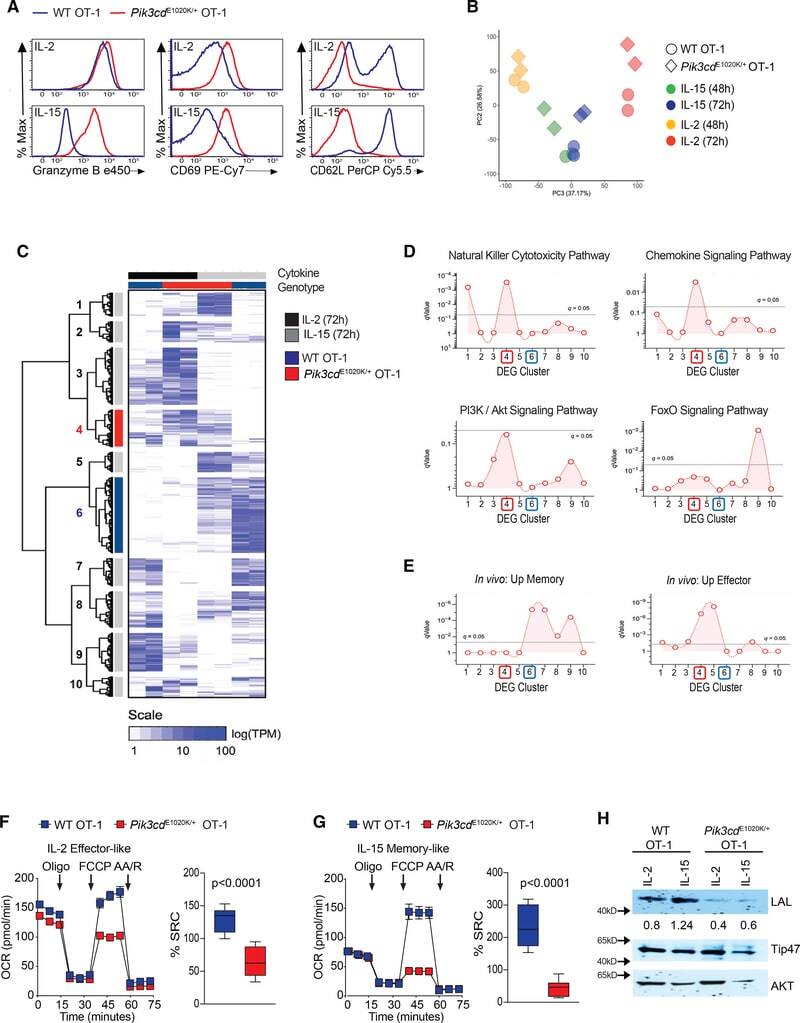
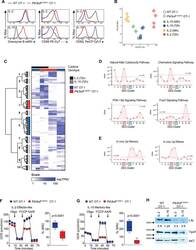
- Figure 6. IL-15 differentiated Pik3cd E1020K/+ OT-1 CD8 + T cells resemble effector cells (A-E) OT-1 cells activated with OVA 257-264 for 3 days and then cultured with either IL-2 or IL-15 to generate effector-like or memory-like cells, respectively (see Figure S6A ). (A) GzmB, CD69, and CD62L (n=3, representative flow plots). (B-E) RNA-seq analysis. (B) Principal-component analysis (PCA) of the two most variant TPM data components (WT cells, circles; Pik3cd E1020K/+ , triangles). (C) Heatmap of TPM values and Euclidian clustering for DEGs (rows) and experimental groups (columns). (D and E) Enrichment across 10 row clusters (C) of KEGG pathways (D) or curated CD8 + T cell gene sets (E) from http://www.gsea-msigdb.org/gsea/index.jsp . (F and G) OCR under basal conditions and in response to mitochondrial inhibitors oligomycin, FCCP, and antimycin A plus rotenone and calculated as the percent SRC in cells differentiated in IL-2 (F) and IL-15 (G) (representative data, n = 4). (H) LAL, Tip47, and AKT from IL-2 or IL-15 cultured cells (n = 2). Graphs (F and G) show mean +- SEM, percent SRC p < 0.0001. See Figure S7 and Table S2 .