 Explore
 Validate
 Learn
Learn Flow cytometry
Antibody data
- Antibody Data
- Antigen structure
- References [11]
- Comments [0]
- Validations
- Flow cytometry [1]
- Other assay [18]
Submit
Validation data
Reference
Comment
Report error
- Product number
- 63-9987-41 - Provider product page

- Provider
- Invitrogen Antibodies
- Product name
- CD235a (Glycophorin A) Monoclonal Antibody (HIR2 (GA-R2)), Super Bright™ 600, eBioscience™
- Antibody type
- Monoclonal
- Antigen
- Other
- Description
- Description: The HIR2 monoclonal antibody reacts with human glycophorin A, sialoglycoproteins expressed by erythroid precursors and mature circulating red cells. Applications Reported: This HIR2 antibody has been reported for use in flow cytometric analysis. Applications Tested: This HIR2 antibody has been pre-diluted and tested by flow cytometric analysis of normal human peripheral blood cells. Binding of this antibody to red cells at high antibody concentration causes cell agglutination. This may be used at 5 µL (0.015 µg) per test. A test is defined as the amount (µg) of antibody that will stain a cell sample in a final volume of 100 µL. Cell number should be determined empirically but can range from 10^5 to 10^8 cells/test. Super Bright 600 is a tandem dye that can be excited with the violet laser line (405 nm) and emits at 600 nm. We recommend using a 610/20 bandpass filter. Please make sure that your instrument is capable of detecting this fluorochrome. When using two or more Super Bright dye-conjugated antibodies in a staining panel, it is recommended to use Super Bright Complete Staining Buffer (Product # SB-4401) to minimize any non-specific polymer interactions. Please refer to the datasheet for Super Bright Staining Buffer for more information. Light sensitivity: This tandem dye is sensitive to photo-induced oxidation. Please protect this vial and stained samples from light. Fixation: Samples can be stored in IC Fixation Buffer (Product # 00-8222) (100 µL of cell sample + 100 µL of IC Fixation Buffer) or 1-step Fix/Lyse Solution (Product # 00-5333) for up to 3 days in the dark at 4°C with minimal impact on brightness and FRET efficiency/compensation. Some generalizations regarding fluorophore performance after fixation can be made, but clone specific performance should be determined empirically. Excitation: 405 nm; Emission: 600 nm; Laser: Violet Laser Super Bright Polymer Dyes are sold under license from Becton, Dickinson and Company.
- Reactivity
- Human
- Host
- Mouse
- Isotype
- IgG
- Antibody clone number
- HIR2 (GA-R2)
- Vial size
- 25 Tests
- Concentration
- 5 µL/Test
- Storage
- 4° C, store in dark, DO NOT FREEZE!
Submitted references Autophagy regulated by the HIF/REDD1/mTORC1 signaling is progressively increased during erythroid differentiation under hypoxia.
Polycomb Factor PHF19 Controls Cell Growth and Differentiation Toward Erythroid Pathway in Chronic Myeloid Leukemia Cells.
In vitro differentiation of human embryonic stem cells to hemogenic endothelium and blood progenitors via embryoid body formation.
Iron control of erythroid microtubule cytoskeleton as a potential target in treatment of iron-restricted anemia.
Negative Regulation of Erythroid Differentiation via the CBX8-TRIM28 Axis.
Microglia promote glioblastoma via mTOR-mediated immunosuppression of the tumour microenvironment.
Transcriptional States and Chromatin Accessibility Underlying Human Erythropoiesis.
Genetic programming of macrophages generates an in vitro model for the human erythroid island niche.
GATA/Heme Multi-omics Reveals a Trace Metal-Dependent Cellular Differentiation Mechanism.
Activation of KLF1 Enhances the Differentiation and Maturation of Red Blood Cells from Human Pluripotent Stem Cells.
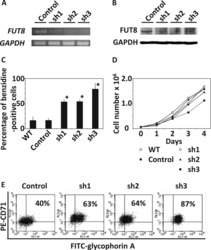
α-1,6-Fucosyltransferase (FUT8) inhibits hemoglobin production during differentiation of murine and K562 human erythroleukemia cells.
Li J, Quan C, He YL, Cao Y, Chen Y, Wang YF, Wu LY
Frontiers in cell and developmental biology 2022;10:896893
Frontiers in cell and developmental biology 2022;10:896893
Polycomb Factor PHF19 Controls Cell Growth and Differentiation Toward Erythroid Pathway in Chronic Myeloid Leukemia Cells.
García-Montolio M, Ballaré C, Blanco E, Gutiérrez A, Aranda S, Gómez A, Kok CH, Yeung DT, Hughes TP, Vizán P, Di Croce L
Frontiers in cell and developmental biology 2021;9:655201
Frontiers in cell and developmental biology 2021;9:655201
In vitro differentiation of human embryonic stem cells to hemogenic endothelium and blood progenitors via embryoid body formation.
Garcia-Alegria E, Potts B, Menegatti S, Kouskoff V
STAR protocols 2021 Mar 19;2(1):100367
STAR protocols 2021 Mar 19;2(1):100367
Iron control of erythroid microtubule cytoskeleton as a potential target in treatment of iron-restricted anemia.
Goldfarb AN, Freeman KC, Sahu RK, Elagib KE, Holy M, Arneja A, Polanowska-Grabowska R, Gru AA, White Z 3rd, Khalil S, Kerins MJ, Ooi A, Leitinger N, Luckey CJ, Delehanty LL
Nature communications 2021 Mar 12;12(1):1645
Nature communications 2021 Mar 12;12(1):1645
Negative Regulation of Erythroid Differentiation via the CBX8-TRIM28 Axis.
Kim HJ, Park JW, Kang JY, Seo SB
Molecules and cells 2021 Jul 31;44(7):444-457
Molecules and cells 2021 Jul 31;44(7):444-457
Microglia promote glioblastoma via mTOR-mediated immunosuppression of the tumour microenvironment.
Dumas AA, Pomella N, Rosser G, Guglielmi L, Vinel C, Millner TO, Rees J, Aley N, Sheer D, Wei J, Marisetty A, Heimberger AB, Bowman RL, Brandner S, Joyce JA, Marino S
The EMBO journal 2020 Aug 3;39(15):e103790
The EMBO journal 2020 Aug 3;39(15):e103790
Transcriptional States and Chromatin Accessibility Underlying Human Erythropoiesis.
Ludwig LS, Lareau CA, Bao EL, Nandakumar SK, Muus C, Ulirsch JC, Chowdhary K, Buenrostro JD, Mohandas N, An X, Aryee MJ, Regev A, Sankaran VG
Cell reports 2019 Jun 11;27(11):3228-3240.e7
Cell reports 2019 Jun 11;27(11):3228-3240.e7
Genetic programming of macrophages generates an in vitro model for the human erythroid island niche.
Lopez-Yrigoyen M, Yang CT, Fidanza A, Cassetta L, Taylor AH, McCahill A, Sellink E, von Lindern M, van den Akker E, Mountford JC, Pollard JW, Forrester LM
Nature communications 2019 Feb 20;10(1):881
Nature communications 2019 Feb 20;10(1):881
GATA/Heme Multi-omics Reveals a Trace Metal-Dependent Cellular Differentiation Mechanism.
Tanimura N, Liao R, Wilson GM, Dent MR, Cao M, Burstyn JN, Hematti P, Liu X, Zhang Y, Zheng Y, Keles S, Xu J, Coon JJ, Bresnick EH
Developmental cell 2018 Sep 10;46(5):581-594.e4
Developmental cell 2018 Sep 10;46(5):581-594.e4
Activation of KLF1 Enhances the Differentiation and Maturation of Red Blood Cells from Human Pluripotent Stem Cells.
Yang CT, Ma R, Axton RA, Jackson M, Taylor AH, Fidanza A, Marenah L, Frayne J, Mountford JC, Forrester LM
Stem cells (Dayton, Ohio) 2017 Apr;35(4):886-897
Stem cells (Dayton, Ohio) 2017 Apr;35(4):886-897
α-1,6-Fucosyltransferase (FUT8) inhibits hemoglobin production during differentiation of murine and K562 human erythroleukemia cells.
Sasaki H, Toda T, Furukawa T, Mawatari Y, Takaesu R, Shimizu M, Wada R, Kato D, Utsugi T, Ohtsu M, Murakami Y
The Journal of biological chemistry 2013 Jun 7;288(23):16839-16847
The Journal of biological chemistry 2013 Jun 7;288(23):16839-16847
No comments: Submit comment
Supportive validation
- Submitted by
- Invitrogen Antibodies (provider)
- Main image

- Experimental details
- Normal human peripheral blood cells cells were stained with Mouse IgG2b kappa Isotype Control, Super Bright 600 (Product # 63-4732) (blue histogram) or CD235a (Glycophorin A) Monoclonal Antibody, Super Bright 600 63-9987) (Product # (purple histogram). Cells in the erythrocyte gate were used for analysis.

Supportive validation
- Submitted by
- Invitrogen Antibodies (provider)
- Main image
- Experimental details
- NULL

- Submitted by
- Invitrogen Antibodies (provider)
- Main image

- Experimental details
- NULL

- Submitted by
- Invitrogen Antibodies (provider)
- Main image

- Experimental details
- NULL
- Submitted by
- Invitrogen Antibodies (provider)
- Main image
- Experimental details
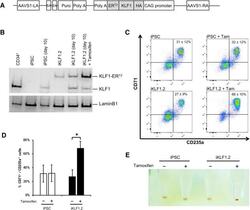
- Figure 3 Activation of KLF1 at day 10 of differentiation results in enhanced erythroid differentiation of hiPSCs. (A) : Schematic of the pZDonor-AAVS1 Puro-CAG-HA-KLF1-ER T2 -PA construct. (B) : Western blot analyses of nuclear cell lysates from adult CD34 + cells that had been differentiated for 6 days into erythroid progenitors, control undifferentiated and differentiated (day 10) induced pluripotent stem cells (iPSCs), undifferentiated iKLF1.2 iPSCs and iKLF1.2 iPSC that had been differentiated for 10 days then treated with tamoxifen for 3 hours. Endogenous KLF1 and the expected larger sized KLF1-ER T2 fusion protein was detected with the anti-KLF1 antibody and the anti-Lamin B1 antibody was used to detect nuclear proteins as a loading control. (C) : Flow cytometry analysis using antibodies against CD235a and CD71 of cells present at day 15 of the erythroid differentiation protocol in control iPSCs and iKLF1.2 iPSC cell lines in the presence (+) and absence (-) of tamoxifen from day 10. ( D) : Quantitation of flow cytometry data representing three independent experiments. Error bars represent SEM. p values were calculated using one-way ANOVA followed by Holm-Sidak's multiple comparison test (* p < .05). ( E) : Image showing the cell pellets from one representative experiment demonstrating a smaller but more intense red pellet in the tamoxifen-treated iKLF1.2 cell line. Abbreviation: iPSCs, induced pluripotent stem cells.

- Submitted by
- Invitrogen Antibodies (provider)
- Main image
- Experimental details
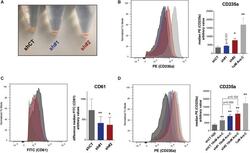
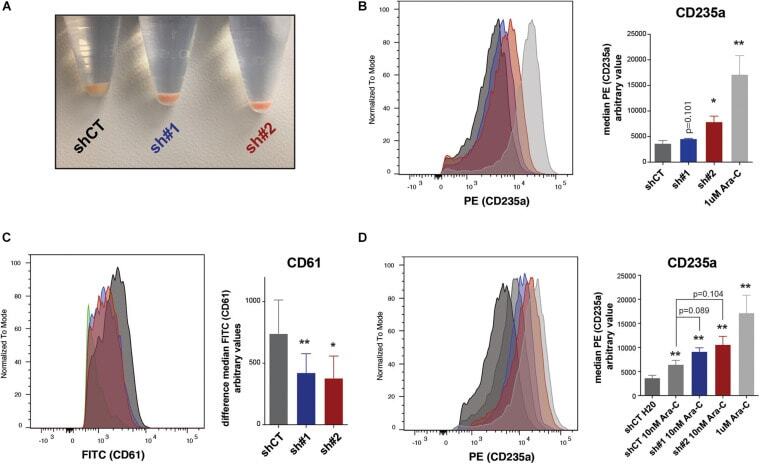
- FIGURE 5 (A) Picture of pelleted K562 infected with an empty short hairpin RNA (shRNA, shCT ) and two shRNAs against PHF19 ( sh #1 and sh#2 ) 5 days after puromycin selection. (B) CD235a marker levels measured by flow cytometry in shCT-, sh# 1-, sh#2-infected cells 4 days after puromycin selection and 1 muM of Ara-C treatment in uninfected cells as a positive control. Left , representative plot of a single experiment. Right , bar plot of the mean of median cytometry values (shCt and sh#1, n = 4; sh#1 and 1 muM of Ara-C, n = 3) + SEM. (C) CD61 marker levels measured by flow cytometry in shCT-, sh# 1-, and sh#2-infected cells 4 days after puromycin selection and treated with 1 nM phorbol myristate acetate (PMA) for 24 h. Left , representative plot of a single experiment. Right , bar plot of the mean of median cytometry values ( n = 3) + SEM. (D) CD235a marker levels measured by flow cytometry at 4 days in shCT-, sh# 1-, and sh#2-infected cells after puromycin selection and treated with 10 nM of Ara-C for 72 h, with 1 muM of Ara-C treatment in uninfected cells as a positive control. Left , representative plot of a single experiment. Right , bar plot of the mean of median cytometry values (shCt, 10 nM Ara-C; sh#1, 10 nM Ara-C, n = 24; sh#1, 10 nM Ara-C, and 1 muM of Ara-C, n = 3) + SEM. * p < 0.05 ; p * * < 0.01 .
- Submitted by
- Invitrogen Antibodies (provider)
- Main image

- Experimental details
- Fig. 3 KLF1-activated iPSC-DMs enhance erythroid maturation. a , b . Flow cytometry analyses of live CD235a + -gated cells of UCB-CD34 + erythroid cells cultured alone or in co-culture with iKLF1.2-DMs in the presence and absence of tamoxifen at day 14 ( a ) and day 21 ( b ) stained with anti-CD71 antibody and Hoechst dye (see Supplementary Fig. 3 for gating strategy and FMO controls). c Quantification and statistical analysis of absolute numbers of fully mature enucleated erythroid cells of replicate co-culture experiments ( n = 5 biologically independent samples; two-way ANOVA with Tukey''s post-test). d Cytospin of co-culture of KLF1-activated macrophages and UCB CD34 + cells showing close association and a fully mature erythroid cell with biconcave shape (arrow) (scale bar, 20 mum). e Cytospins of UCB CD34 + erythroid cells cultured alone or in co-culture with iKLF1.2-DM in the presence and absence of tamoxifen at day 14 (upper panels) and day 21 (lower panels); arrows point to enucleated cells (scale bar, 20 mum). * p < 0.05, ** p < 0.01, *** p < 0.001, **** p < 0.0001

- Submitted by
- Invitrogen Antibodies (provider)
- Main image

- Experimental details
- Fig. 4 Implication of FTH1 in the erythroid iron restriction response. a , b Influence of FTH1 levels on viability and proliferation. Graphs: mean % viable cells and fold increases in cell number for human CD34+ progenitors transduced with lentiviral shRNA vectors targeting either green fluorescent protein (GFP) or ferritin heavy chain (FTH1), and cultured 4 days in iron-replete erythroid medium. Error bars, SEM; n = 3 biologically independent experiments; *, ** P = 0.011, 0.009, one-way ANOVA with Tukey post hoc. NS not significant. GPA glycophorin A. c Influence of FTH1 levels on erythroid differentiation as determined by flow cytometry on cells treated as in a . d Mean fold change in GPA+ cells associated with lentiviral transductions and 4 days culture in iron-replete erythroid medium. Error bars, SEM; n = 3 independent experiments; *, ** P = 0.019, 0.013, unpaired two-sided Student''s t test. Note: most experiments separately assessed FTH1#1 and FTH1#2. e Distinct consequences of ferritin enforcement in iron-replete versus iron-restricted progenitors. Flow cytometry analysis of CD34+ progenitors transduced with lentiviral (LV) expression vectors for ferritin heavy (FTH1) and light (FTL) chains followed by 4 days culture in iron-replete (100% TSAT) or deficient (10% TSAT) erythroid medium. f Mean fold change in GPA+ cells associated with ferritin enforcement in cells cultured as in e . Error bars, SEM; n = 3 independent experiments; * P = 0.02, unpaired two-sided Student'

- Submitted by
- Invitrogen Antibodies (provider)
- Main image

- Experimental details
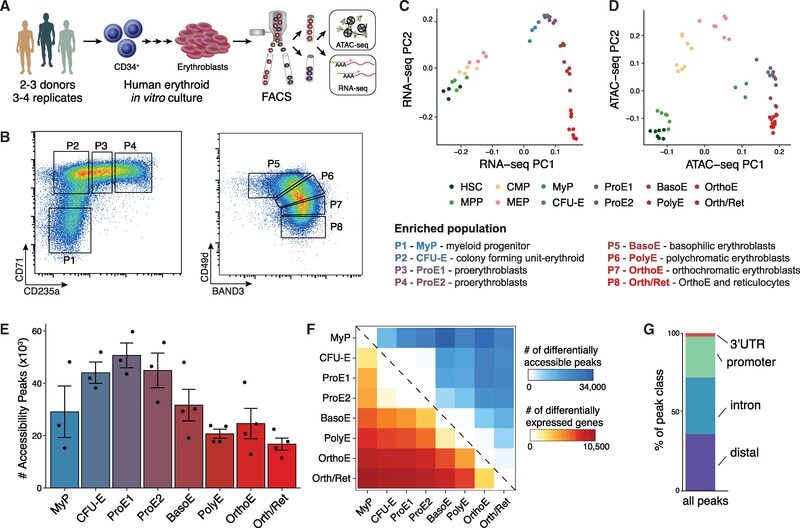
- Figure 1. An Epigenomic and Transcriptional Time Course of Human Erythroid Differentiation (A) Schematic outline of generating matched transcriptome and open chromatin profiles across human erythropoiesis. (B) FACS gating scheme showing expression of surface markers CD71, CD235a, CD49d, and BAND3 used to sort indicated populations P1-P8 (P1, MyP; P2, CFU-E; P3, ProE1; P4, ProE1; P5, BasoE; P6, PolyE; P7, OrthoE; P8, Ortho/Ret). (C and D) Principal-components plots of (C) RNA-seq data and (D) ATAC-seq data, colored by FACS-sorted populations. Color code indicated below. (E) Number of chromatin accessibility peaks across populations. Error bars represent SEM number of peaks per population between replicates. (F) Heatmap showing relative numbers of differentially accessible peaks (top, blue shades) and differentially expressed genes (bottom, red shade) between populations.
- Submitted by
- Invitrogen Antibodies (provider)
- Main image

- Experimental details
- Fig. 1 Genome-wide CRISPR screening reveals CBX8 as a regulator of K562 cell differentiation. (A) Schematic representation of genome-wide CRISPR-Cas9 screening in K562 cells with and without 3 days 30 uM hemin treatment to induce erythroid differentiation. (B) (left) Scatterplots of CS of CD235A - positive versus CD235A - negative K562 cells. (right) Gene ontology analysis of genes in the indicated regions (red). (C) CS (derived from the average of the four sgRNAs CRISPR-Cas9 guide scores within the sgRNAs targeting a given gene) for CD235A - negative K562 cells by hemin sorted after 3 days. Candidate genes and previously identified genes are indicated in red. (D) RT-qPCR of HBA1/2 in K562 cells with sgV2 (control vector) or sgCBX8, sgPRDM14, sgMETTL3, sgNAIF1 under hemin treatment. (E) (left) Cell differentiation was measured by hemoglobin staining of K562 cells with O-dianisidine. Hemin treatments were conducted for 3 days. Black arrowheads indicate O-dianisidine-positive cells. Scale bar = 25 um. (right) Quantifications are shown. (D) Values are presented as mean +- SEM (n = 3-4). (E) Values are presented as mean +- SD (n = 4). * P < 0.05, ** P < 0.01; Student's t -test.

- Submitted by
- Invitrogen Antibodies (provider)
- Main image

- Experimental details
- Fig. 2 CBX8 negatively regulates hemin-mediated K562 cell differentiation. (A) Immunoblots were performed using K562 cell lysates, which were treated with 30 uM hemin for 2 days. (B) RT-qPCR of CBX8 was performed using K562 cells treated with 30 uM hemin for 2 days. n.s, not significant. (C) Immunoblots were performed using K562 cell lysates, which were treated with 30 uM hemin for 2 days and 20 uM MG132 proteasome inhibitor for 8 h before harvested. (D) IP of endogenous CBX8 in K562 cells was performed to investigate polyubiquitination chains of CBX8. Cell lysates were immunoprecipitated using anti-CBX8 antibodies, and polyubiquitination chains were immunoblotted using FK2 antibodies that detect mono- and poly-ubiquitin. (E) Overexpression of flag-tagged CBX8 was confirmed by immunoblots. NC, normal control. (F) RT-qPCR of HBA1/2 was performed using K562 cells stably expressing flag-tagged CBX8. The relative increase of expression in cells treated with 30 uM hemin for 2 days was quantified compared to that of a mock experiment. (G) Histogram showing erythroid differentiation upon 30 uM hemin treatment for 3 days. K562 cells expressing control vector (NC) or flag-tagged CBX8 were stained with anti-APC-CD235A and FACS sorted. (B and F) Values are presented as mean +- SEM (n = 3-4). * P < 0.05; Student's t -test.

- Submitted by
- Invitrogen Antibodies (provider)
- Main image

- Experimental details
- Fig. 4 Phosphorylation of serine 196 on CBX8 by PIM1 affects K562 cell differentiation. (A) RT-qPCR of PIM1 was performed using K562 cells treated with 30 uM hemin for 2 days. (B) Immunoblots were performed using K562 cell lysates, which were treated with 30 uM, 50 uM hemin for 2 days. (C) IP of endogenous CBX8 in K562 cells was performed and proteins were immunoblotted with the indicated antibodies. (D) IP of endogenous CBX8 was performed using K562 cells treated with 30 uM hemin for 2 days and proteins were immunoblotted with the indicated antibodies. (E) GST-CBX8 WT and deletion constructs were used for GST pulldown assay with 293T cell lysates transiently expressed GFP-tagged PIM1, followed by elution and separation by SDS-PAGE. The amount of GST-CBX8 WT or deletion constructs were determined by Coomassie brilliant blue (CBB) staining. (F) In vitro kinase assay using GST-CBX8 and GST-PIM1. The phosphorylated GST-CBX8 by PIM1 were visualized via autoradiography and the amounts of GST-fusion proteins used in the assay are shown in the CBB staining. (G) In vitro kinase assay using GST-CBX8 deletion mutants and GST-PIM1. The phosphorylated GST-CBX8 WT and #2 deletion mutant were visualized via autoradiography. The amounts of GST-fusion proteins used in the assay are shown in the CBB staining. (H) GST-CBX8 modified with phosphorylation on serine 196. Mass spectrometry analysis (LC-MS / MS) was performed after in vitro kinase assay with GST-CBX8 and GST-PIM1. The graph shown in

- Submitted by
- Invitrogen Antibodies (provider)
- Main image

- Experimental details
- Fig. 5 TRIM28 induces CBX8 protein stabilization. (A) K562 cells stably expressing flag-tagged CBX8 were treated with 30 uM hemin for 2 days. Proteins in complexes with flag-tagged CBX8 were separated by SDS-PAGE after immunoprecipitation and visualized via silver staining. (B) IP of endogenous CBX8 in K562 cells was performed to confirm the interaction between TRIM28 and CBX8. K562 cells were treated with 30 uM hemin for 2 days and MG132 for 8 h before harvested. (C) GST-CBX8 WT and deletion mutants were used for GST pulldown assays. Extracts of 293T cells transiently expressing flag-tagged TRIM28 were incubated with GST-CBX8 or GST-CBX8 deletion mutants followed by elution and separation by SDS-PAGE. The amount of GST-CBX8 WT or deletion constructs were determined by CBB staining. (D) Immunoblots were performed using normal control (NC) and shTRIM28 K562 cells. (E) Immunoblots were performed using NC and shTRIM28 K562 cells treated with 30 uM hemin for 2 days. Each protein was blotted with the indicated antibodies. (F) Immunoblots were performed using NC and shTRIM28 K562 cells, treated with 30 uM hemin for 2 days and 20 uM MG132 for 8 h before being harvested. (G) IP of endogenous CBX8 in K562 cells was performed to investigate polyubiquitination chains of CBX8. NC and shTRIM28 K562 cells were treated with 20 uM MG132 for 8 h before harvested. Cell lysates were immunoprecipitated using anti-CBX8 antibodies and polyubiquitination chains were immunoblotted using FK2 antibodi

- Submitted by
- Invitrogen Antibodies (provider)
- Main image

- Experimental details
- Figure 7 mTOR signalling in TAM - MG promotes immune evasion mechanisms in human glioblastoma A Correlation between ssGSEA enrichment scores for the mTOR signature versus TAM-MG or TAM-BMDM signatures in TCGA-GBM transcriptomic data. Comparison carried out on all IDH-wild-type samples and in a subgroup-specific manner according to Wang's classifier. Size of circle is indicative of R-square value, and bold outline represents a P

- Submitted by
- Invitrogen Antibodies (provider)
- Main image

- Experimental details
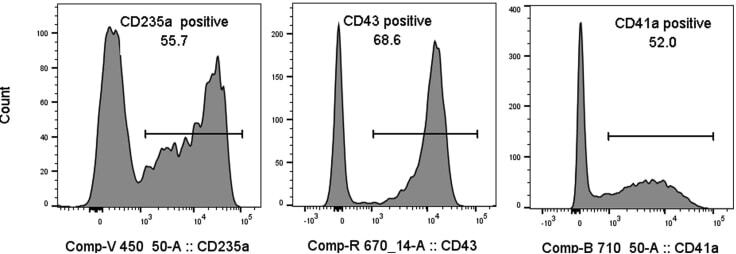
- Figure 10 Hematopoiesis analysis Flow cytometry analysis of the indicated cell surface markers at day 4 of hemogenic endothelium culture.
- Submitted by
- Invitrogen Antibodies (provider)
- Main image
- Experimental details
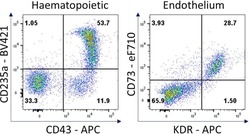
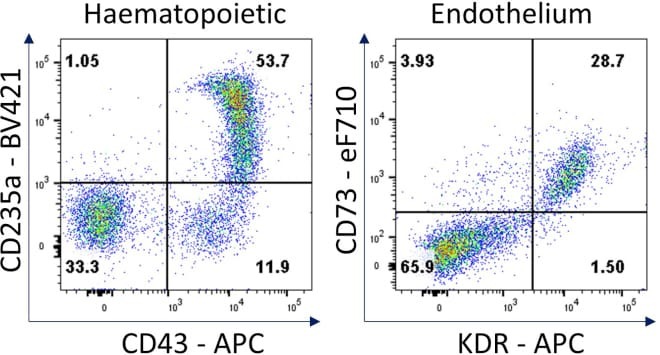
- Figure 7 Hematopoietic and endothelial cell characterization Flow cytometry analysis of day 4 hemogenic culture for hematopoietic (CD43, CD235a) and endothelial (KDR, CD73) cell surface markers.
- Submitted by
- Invitrogen Antibodies (provider)
- Main image

- Experimental details
- FIGURE 1 Hypoxia accelerates erythroid differentiation (A) Reddish pellets of K562 cells in the process of erythroid differentiation under normoxia and hypoxia. Redder pellets indicate more accumulation of hemoglobin (B) qRT-PCR analysis of the relative mRNA levels of specific erythrocyte markers CD235a and HBG. qRT-PCR was performed at the indicated time points after K562 cells were exposed to normoxia or hypoxia during erythroid differentiation. * p < 0.05, ** p < 0.01, *** p < 0.001, versus the corresponding normoxia group at different time points (C) Western blot analysis of CD235a and gamma-globin protein expression at the indicated time points after K562 cells were exposed to normoxia or hypoxia. N: normoxia; (H) hypoxia (D) Representative images of benzidine staining in K562 cells differentiated into erythrocytes. The line graph below shows the percentage of benzidine-positive cells. Scale Bar = 100 mum *** p < 0.001, versus the corresponding normoxia group. Nor: normoxia; Hyp: hypoxia (E) Flow cytometry plots show the expression of CD235a and CD71 in K562 cells. The line graph below shows the percentage of CD71 + /CD235a + cells. * p < 0.05, ** p < 0.01, *** p < 0.001, versus the respective normoxia group (F) qRT-PCR analysis of the relative mRNA levels of CD235a, HBG and HBB in HSPCs. qRT-PCR was performed at the indicated time points after HSPCs were exposed to normoxia or hypoxia during erythroid differentiation. *** p < 0.001, versus the respective normoxia group

- Submitted by
- Invitrogen Antibodies (provider)
- Main image

- Experimental details
- FIGURE 3 Autophagy mediates erythroid differentiation promoted by hypoxia (A) Reddish pellets of K562 cells differentiated into erythrocytes treated with DMSO or Baf A1 (20 nM) under normoxia and hypoxia. The red color of pellets was lightened by Baf A1 in both normoxia and hypoxia (B) qRT-PCR analysis of the relative mRNA levels of CD235a and HBG at the indicated time points after K562 cells treated with DMSO (-) as control or Baf A1 (+, 20 nM) were induced into erythroid differentiation under normoxia or hypoxia conditions. ** p < 0.01; *** p < 0.001. versus the respective normoxia group at different time points (C) Western blot analysis of p62, LC3 and gamma-globin protein expression at the indicated time points after K562 cells differentiated into erythrocytes were treated with DMSO (-) as control or Baf A1 (+, 20 nM) under normoxia or hypoxia. Nor: normoxia; Hyp: hypoxia (D) Flow cytometry plots show the expression of CD235a and CD71 in K562 cells differentiated into erythrocytes that were treated with DMSO (-) as control or Baf A1 (+, 20 nM) under normoxia or hypoxia for 3 days. The graph on the right shows the percentage of CD71 + /CD235a + cells. *** p < 0.001, versus the DMSO group under normoxia. ### p < 0.001, versus the respective DMSO group under normoxia or hypoxia (E) Representative images of benzidine staining in K562 cells treated the same as (D) . The right graph shows the percentage of benzidine-positive cells. Scale Bar = 100 mum *** p < 0.001, versus the

- Submitted by
- Invitrogen Antibodies (provider)
- Main image

- Experimental details
- FIGURE 4 Suppression of mTORC1 is required for inducing autophagy and accelerating erythroid differentiation under hypoxia (A) After K562 cells (left) and HSPCs (right) differentiated erythrocytes were exposed to normoxia or hypoxia for 3 day and 7 days, respectively, RNA-seq was performed, and then GSEA was used to analyze the major pathways related to hypoxia. NES, normalized enrichment score (B,C) Western blot shows the effects of hypoxia on p62, LC3, gamma-globin or beta-globin protein levels and mTORC1 activity at different time points in the process of erythroid differentiation of K562 cells or HSPCs (D,E) Western blot analysis of the effects of Rapa (100 nM) on p62, LC3, CD235a, gamma-globin or beta-globin protein levels and mTORC1 activity in K562- or HSPCs-differentiated erythrocytes under normoxia (F) qRT-PCR analysis of the relative mRNA levels of CD235a, HBG and HBB after HSPCs were differentiated into erythrocytes which were treated with DMSO or different concentrations of Rapa for 3 days from the fourth day to the seventh day of differentiation under normoxia. ns, not significant, ** p < 0.01, *** p < 0.001, versus the DMSO group (G) Flow cytometry plots show the expression of CD235a and CD71 in HSPCs-differentiated erythrocytes treated the same as (F) . The graph on the right shows the percentage of CD71 + /CD235a + cells. ** p < 0.01, *** p < 0.001. versus the DMSO group (H,I) Western blot analysis of the effects of TSC2 knockdown on p62, LC3, CD235a, gamma-gl
