 Explore
 Validate
 Learn
LearnPA1-46286
antibody from Invitrogen Antibodies
Targeting: MAP1LC3B
ATG8F
 Western blot Immunocytochemistry
 Immunoprecipitation Immunohistochemistry Flow cytometry Immunoelectron microscopy Other assay
Antibody data
- Antibody Data
- Antigen structure
- References [0]
- Comments [0]
- Validations
- Western blot [4]
- Immunocytochemistry [6]
- Immunohistochemistry [2]
- Flow cytometry [1]
- Other assay [7]
Submit
Validation data
Reference
Comment
Report error
- Product number
- PA1-46286 - Provider product page

- Provider
- Invitrogen Antibodies
- Product name
- LC3B Polyclonal Antibody
- Antibody type
- Polyclonal
- Antigen
- Other
- Reactivity
- Human, Mouse, Rat, Bacteria, Bovine, Canine, Porcine, Zebrafish
- Host
- Rabbit
- Isotype
- IgG
- Vial size
- 100 µL
- Concentration
- 1 mg/mL
- Storage
- -20° C, Avoid Freeze/Thaw Cycles
No comments: Submit comment
Supportive validation
- Submitted by
- Invitrogen Antibodies (provider)
- Main image
- Experimental details
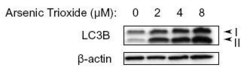
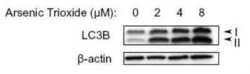
- Western Blot detection of LC3B in treated U87-MG (human glioblastoma astrocytoma) lysates using Product # PA1-46286.

- Submitted by
- Invitrogen Antibodies (provider)
- Main image
- Experimental details
- Western blot analysis of LC3B in U87-MG (human glioblastoma astrocytoma) lysates. Sample was incubated in LC3B polyclonal antibody (Product # PA1-46286).

- Submitted by
- Invitrogen Antibodies (provider)
- Main image

- Experimental details
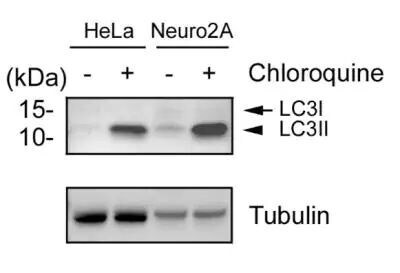
- Western blot analysis of LC3B in 10 µg Human cervical carcinoma (HeLa) and Mouse Neuroblast cells (Neuro2a). Samples were incubated in LC3B polyclonal antibody (Product # PA1-46286 using a dilution of 2 µg/mL. Treated with (+) and without (-) 50 µM Chloroquine overnight. Whole cell protein lysates were prepared in 1x Laemmli sample buffer and each lysate was separated on a 4–20% gel by SDS-PAGE, transferred to 0.2 µm PVDF membrane and blocked in 5% nonfat milk in TBST. Loading control: 1 µg/mL anti-alpha tubulin as a loading control. Detection: chemiluminescence substrate.
- Submitted by
- Invitrogen Antibodies (provider)
- Main image
- Experimental details
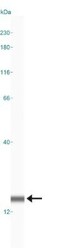
- Western blot analysis of LC3B in 0.5 mg/mL Neuro2A lysate. Samples were incubated in LC3B polyclonal (Product # PA1-46286). This experiment was performed under reducing conditions using the 12-230 kDa separation system.

Supportive validation
- Submitted by
- Invitrogen Antibodies (provider)
- Main image

- Experimental details
- Staining of treated U373-MG (human glioblastoma) cells using Product # PA1-46286.

- Submitted by
- Invitrogen Antibodies (provider)
- Main image

- Experimental details
- Immunocytochemistry analysis of LC3B in treated U373-MG cells. Samples were incubated in LC3B polyclonal antibody (Product # PA1-46286). Analysis using the HRP conjugate of anti-LC3B . The nuclei were stained with DAPI.

- Submitted by
- Invitrogen Antibodies (provider)
- Main image
- Experimental details
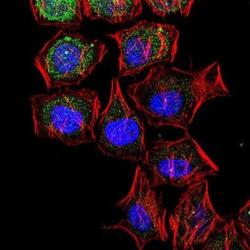
- Immunocytochemistry analysis of LC3B in HeLa cells. Samples were incubated in LC3B polyclonal antibody (Product # PA1-46286) followed by Alexa Fluor 488-conjugated Goat to rabbit IgG secondary antibody (green). Actin filaments were labeled with Alexa Fluor 568 phalloidin (red). DAPI was used to stain the cell nuclei (blue).

- Submitted by
- Invitrogen Antibodies (provider)
- Main image

- Experimental details
- Immunocytochemistry analysis of LC3B in treated U373-MG cells. Samples were incubated in LC3B polyclonal antibody (Product # PA1-46286). Analysis using the HRP conjugate of anti-LC3B . The nuclei were stained with DAPI.

- Submitted by
- Invitrogen Antibodies (provider)
- Main image
- Experimental details
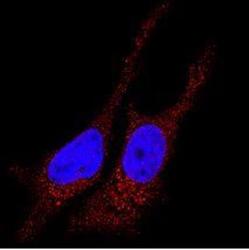
- Immunocytochemistry analysis of LC3B in HeLa cells. Samples were incubated in LC3B polyclonal antibody (Product # PA1-46286). Antibody (red). Nuclei were counterstained with DAPI (blue).

- Submitted by
- Invitrogen Antibodies (provider)
- Main image

- Experimental details
- Immunocytochemistry analysis of LC3B in treated U373-MG (human glioblastoma) cells. Samples were incubated in LC3B polyclonal antibody (Product # PA1-46286).

Supportive validation
- Submitted by
- Invitrogen Antibodies (provider)
- Main image

- Experimental details
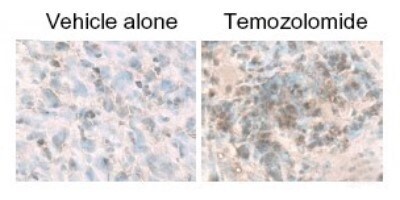
- Immunohistochemical analysis of LC3B in treated U87-MG cultured & subcutaneous tumors. Samples were incubated in LC3B polyclonal antibody (Product # PA1-46286).
- Submitted by
- Invitrogen Antibodies (provider)
- Main image

- Experimental details
- Immunohistochemical analysis of LC3B in gliobastoma multiform tissue. Samples were incubated in LC3B polyclonal antibody (Product # PA1-46286).

Supportive validation
- Submitted by
- Invitrogen Antibodies (provider)
- Main image

- Experimental details
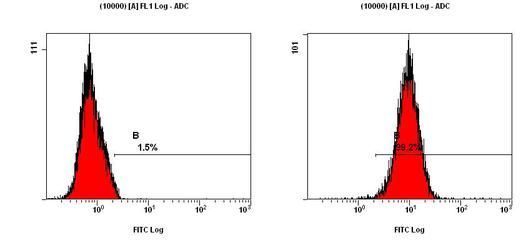
- FACS staining of NTERA-2 cells using Product # PA1-46286 at a 1:200 dilution detected using Dylight-488 conjugated goat anti-rabbit IgG secondary
Supportive validation
- Submitted by
- Invitrogen Antibodies (provider)
- Main image
- Experimental details
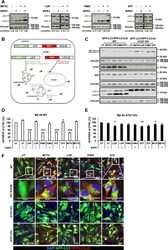
- Fig. 7 Loperamide, pimozide, and STF-62247 enhance the autophagic flux in MZ-54 cells. a MZ-54 cells were treated with 20 uM IM/100 uM TIC, 17.5 uM loperamide, 15 uM pimozide, and 40 uM STF-62247 for 8, 2, 4 and 3 h, respectively. BafA1 was added 4 h before cell harvesting at a final concentration of 40 nM. Western blotting was performed with the indicated antibodies and vinculin as loading control. For quantification, LC3-II band intensities were normalized to vinculin band intensities. b Schematic representation of the GFP-LC3B-RFP-LC3BDeltaG autophagy flux sensor. Upon expression, the GFP-LC3B-RFP-LC3BDeltaG fusion protein is cleaved by the ATG4 proteases after which GFP-LC3B becomes conjugated to PE and localizes to autophagosomes which eventually fuse with lysosomes, inducing degradation of GFP-LC3B. RFP-LC3BDeltaG remains in the cytosol, where it serves as internal control. Scheme adapted from Kaizuka et al. 48 c Stable GFP-LC3B-RFP-LC3BDeltaG-expressing MZ-54 WT or ATG7 KO cells were treated as indicated in a for 16 h followed by Western blotting with vinculin as loading control. d , e Stable GFP-LC3B-RFP-LC3BDeltaG-expressing MZ-54 WT ( d ) or ATG7 KO cells ( e ) were treated with 20 uM IM/100 uM TIC, 15 uM loperamide, 15 uM pimozide or 40 uM STF-62247 for the indicated time points followed by flow cytometry. BafA1 was added 4 h before the measurement at a final concentration of 40 nM. Mean and SEM of three independent experiments performed in triplicate

- Submitted by
- Invitrogen Antibodies (provider)
- Main image
- Experimental details
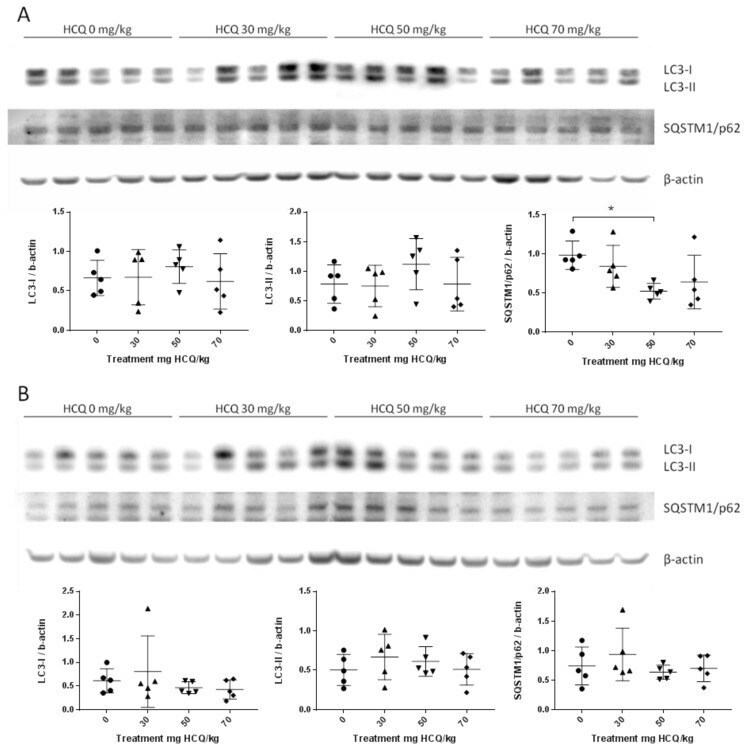
- Figure 3 Representative western blots of LC3 and SQSTM1/p62 proteins in the anterior tibialis muscle of juvenile mice sacrificed at post-natal day (PND)136 showing the inter-individual and inter-group variation of protein expression: ( A ) Male data n = 5/group; ( B ) Female data n = 5/group. Standardized protein levels were analysed by the Kruskal-Wallis test. Mann-Whitney was used for multiple comparisons; * p < 0.05.

- Submitted by
- Invitrogen Antibodies (provider)
- Main image

- Experimental details
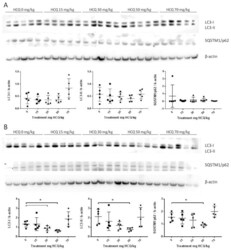
- Figure 4 Representative Western blot of LC3 and SQSTM1/p62 proteins in the anterior tibialis muscle of adult mice sacrificed at PND136 showing the inter-individual and inter-group variation of protein expression: ( A ) Male data n = 5/group; ( B ) Female data n = 5/group. Standardized protein levels were analysed by Kruskal-Wallis test. Mann-Whitney was used for multiple comparisons; * p < 0.05.
- Submitted by
- Invitrogen Antibodies (provider)
- Main image

- Experimental details
- Figure 7 4PYR induced autophagy in HepG3 cells. HepG3 cells were continuously dosed with 100 uM of 4PYR for 48, 72, and 96 h. ( A ) Increased protein expression levels of the autophagy marker LC3BII, Beclin-1, and decrease in phospho-mTOR were assessed using immunoblot in 4PYR treated HepG3 cells compared to vehicle-treated control cells. alpha-tubulin was used as a loading control for immunoblotting. The graph shows quantified protein expression levels relative to controls for ( B ) LC3B-II, ( C ) Beclin-1 and ( D ) phosphor-mTOR in HepG3 cells. Results are expressed as relative abundance (a.u.) +- SEM of two biological replicates. Statistical significance: * p < 0.05.

- Submitted by
- Invitrogen Antibodies (provider)
- Main image
- Experimental details
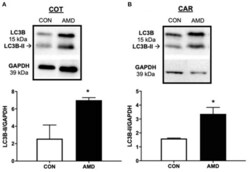
- Figure 3 Evidence of placental autophagy induction after suppressing the CXCL12-CXCR4 network. Protein abundance of cellular autophagy marker LC3B-II and representative immunoblots in ovine fetal cotyledon (COT) placenta (A) and maternal caruncle (CAR) placenta (B) following intrauterine saline (CON) or AMD3100 (AMD) infusion. Data are presented as the mean +- SEM, and significance is denoted with an asterisk when p < 0.05 (*).

- Submitted by
- Invitrogen Antibodies (provider)
- Main image
- Experimental details
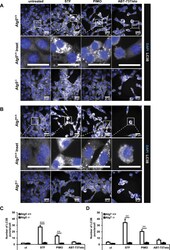
- Figure 2 STF-62247 and pimozide lead to a strong accumulation of endogenous LC3B-II protein in MEFs. ( A , B ) Atg5 +/+ and Atg5 -/- MEFs were treated with 20 uM STF-62247, 15 uM pimozide or 7.5 uM ABT-737/10 uM etoposide for 24 hours ( A ). Atg7 +/+ and Atg7 -/- MEFs were treated with 40 uM STF-62247, 10 uM pimozide or 7.5 uM ABT-737/10 uM etoposide for 24 hours ( B ). Formation of LC3B puncta was imaged using anti-LC3B immunofluorescence staining. Representative images over 25 sites per sample are shown. ( C , D ) Quantification of mean LC3B puncta per cell upon STF-62247, pimozide or ABT-737/etoposide treatment of Atg5 +/+ and Atg5 -/- ( C ) or Atg7 +/+ and Atg7 -/- ( D ) MEFs. Mean and SEM of three independent experiments performed for 25 sites per sample are shown. Significances after drug treatment of Atg5 +/+ , Atg5 -/- and Atg7 +/+ , Atg7 -/- cells are calculated versus untreated cells of the corresponding cell line. Scale bar = 30 uM. **p < 0.01, ***p < 0.001. ut = untreated, STF = STF-62247, PIMO = pimozide, eto = etoposide.

- Submitted by
- Invitrogen Antibodies (provider)
- Main image

- Experimental details
- Figure 3 STF-62247 and pimozide lead to enhanced autophagic flux in MEFs. ( A , C ) Atg5 +/+ MEFs were treated for 4 hours with 20 uM STF-62247 ( A ) or 15 uM pimozide ( C ) in the absence or presence of 40 nM BafA1. Protein levels were detected by Western blotting with vinculin as loading control. ( B , D ) Atg7 +/+ MEFs were treated for 16 hours with 40 uM STF-62247 ( B ) or for 4 hours with 10 uM pimozide ( D ) in the absence or presence of 40 nM BafA1. Protein levels were detected by Western blotting with vinculin as loading control. For quantification, LC3B-II protein levels were normalized to vinculin protein levels and expressed as fold changes compared to the untreated sample. ( E , F ) Atg5 +/+ and Atg7 +/+ MEFs were transfected with mRFP-EGFP-LC3B followed by treatment with 20 uM STF-62247 or 15 uM pimozide and 40 uM STF-62247 or 10 uM pimozide in the absence or presence of 40 nM BafA1, respectively, for 8 hours ( Atg5 +/+ ) or for 12 hours ( Atg7 +/+ ). Images were acquired by confocal microscopy. Arrows highlight mRFP + /EGFP - puncta. ( G , H ) The numbers of mRFP + /EGFP - and mRFP + /EGFP + dots per cell were quantified after treatment of Atg5 +/+ ( G ) and Atg7 +/+ ( H ) MEFs with 20 uM STF-62247 or 15 uM pimozide and 40 uM STF-62247 or 10 uM pimozide, respectively, in the absence and presence of 40 nM BafA1. Mean and SEM of three independent experiments are shown. 21-51 cells were quantified per sample. Red stars indicate significances of mRFP + /EGFP - dots
