Explore
 Validate
 Learn
Learn Western blot
Antibody data
- Antibody Data
- Antigen structure
- References [1]
- Comments [0]
- Validations
- Western blot [1]
- Immunocytochemistry [1]
- Other assay [1]
Submit
Validation data
Reference
Comment
Report error
- Product number
- PA5-67499 - Provider product page

- Provider
- Invitrogen Antibodies
- Product name
- Phospho-MYL2 (Tyr118) Polyclonal Antibody
- Antibody type
- Polyclonal
- Antigen
- Synthetic peptide
- Reactivity
- Human
- Host
- Rabbit
- Isotype
- IgG
- Vial size
- 100 µL
- Concentration
- 1 mg/mL
- Storage
- -20°C
Submitted references Piezo1 activation attenuates thrombin-induced blebbing in breast cancer cells.
O'Callaghan P, Engberg A, Eriksson O, Fatsis-Kavalopoulos N, Stelzl C, Sanchez G, Idevall-Hagren O, Kreuger J
Journal of cell science 2022 Apr 1;135(7)
Journal of cell science 2022 Apr 1;135(7)
No comments: Submit comment
Supportive validation
- Submitted by
- Invitrogen Antibodies (provider)
- Main image

- Experimental details
- U87 cells were synchronized in I (interphase) and C (Cytokinesis) respectively, then were harvested for immunoblotting. Cells were stained using a Phospho-MYL2 (Tyr118) Polyclonal Antibody (Product # PA5-67499).

Supportive validation
- Submitted by
- Invitrogen Antibodies (provider)
- Main image

- Experimental details
- Immunocytochemical analysis of Phospho-MYL2 (Tyr118) in methanol-fixed U87 cells, using Phospho-MYL2 (Tyr118) Polyclonal Antibody (Product # PA5-67499).

Supportive validation
- Submitted by
- Invitrogen Antibodies (provider)
- Main image
- Experimental details
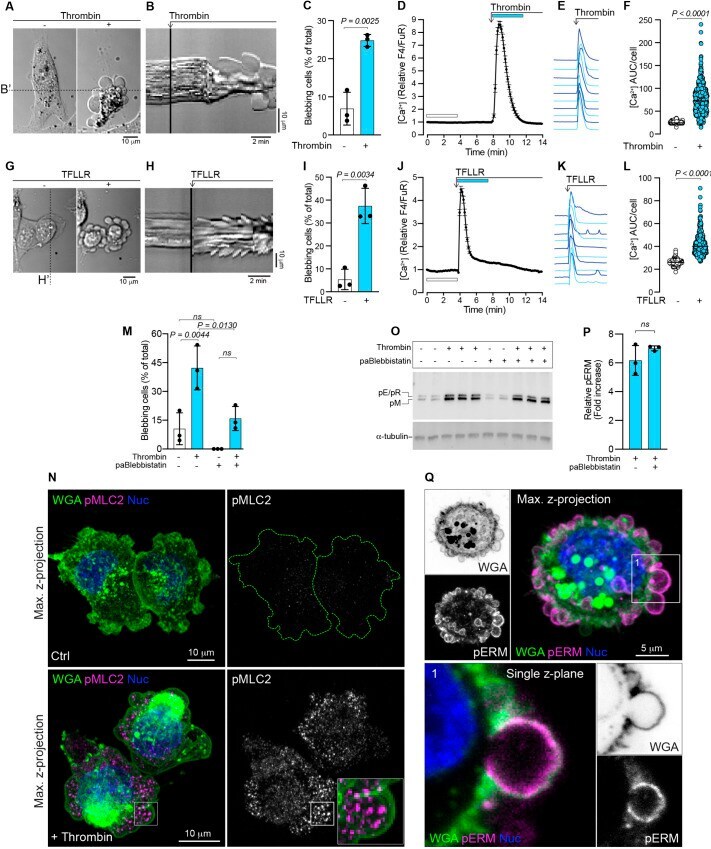
- Fig. 1. Thrombin stimulation and PAR1 activation induces blebbing in MDA-MB-231 cells. (A) Representative example of thrombin-induced blebbing in an MDA-MB-231 cell (see also Movie 2 ). The cell is presented before (left) and after (right) the addition of thrombin. Scale bar: 10 um. (B) Kymograph plotted from the time-lapse signals recorded under the dashed line B' in A; the point at which thrombin is added is indicated. Scale bars: 2 min (horizontal), 10 um (vertical). (C) Quantification of blebbing in MDA-MB-231 cell populations before and after thrombin treatment. Bars represent the mean+-s.d. from three experiments. (D) Thrombin-induced changes in cytosolic Ca 2+ in MDA-MB-231 cells as quantified by ratiometric measurements of relative Fluo-4/Fura Red (F4/FuR) fluorescence. The mean values+-s.e.m. over time for n =119 cells are plotted. (E) Examples of thrombin-induced Ca 2+ responses from individual cells from the data set in D. (F) Quantification of Ca 2+ area under the curve (AUC) per cell calculated from the relative F4/FuR plots for the durations indicated by the color-coded bars in D before and after thrombin treatment ( n =593 cells, from the three experiments in C). (G) Induction of blebbing by TFLLR stimulation in an MDA-MB-231 cell. The cell is presented before (left) and after (right) the addition of TFLLR. Scale bar: 10 um. (H) Kymograph plotted from the signal recorded under the dashed line H' in panel G, the point at which TFLLR is added is indicated. Scale